Logarithmic Functions
2. Graphing Logarithmic Functions
Learning outcomes
- I can sketch logarithmic graphs.
- I can identify domains and ranges.
- I can identify vertical asymptotes.
- I can compare logarithmic and exponential graphs.
- I can interpret logarithmic functions graphically.
Graphing Logarithmic Functions
Introduction to Logarithmic Graphs
Logarithmic functions are the inverses of exponential functions. While exponential functions describe how quantities change through repeated multiplication, logarithmic functions describe the exponent needed to produce a particular value.
A logarithmic function has the general form:
y = logₐ(x)
where:
-
a is the base.
-
a > 0 and a ≠ 1.
-
x is the input or argument.
-
y is the logarithmic value.
For example:
y = log₂(x)
asks: "To what power must 2 be raised to produce x?"
Understanding logarithmic graphs allows us to identify important features such as domains, ranges, intercepts, asymptotes, and transformations.
Logarithmic graphs are especially useful in science, engineering, finance, and situations involving quantities that vary over large numerical ranges.
The Basic Shape of a Logarithmic Graph
Consider:
y = log₂(x)
We can construct its graph by converting logarithmic expressions into exponential form.
Since:
y = log₂(x)
we can write:
x = 2ʸ
This allows us to generate points.
|
x |
y = log₂(x) |
|---|---|
|
1/8 |
−3 |
|
1/4 |
−2 |
|
1/2 |
−1 |
|
1 |
0 |
|
2 |
1 |
|
4 |
2 |
|
8 |
3 |
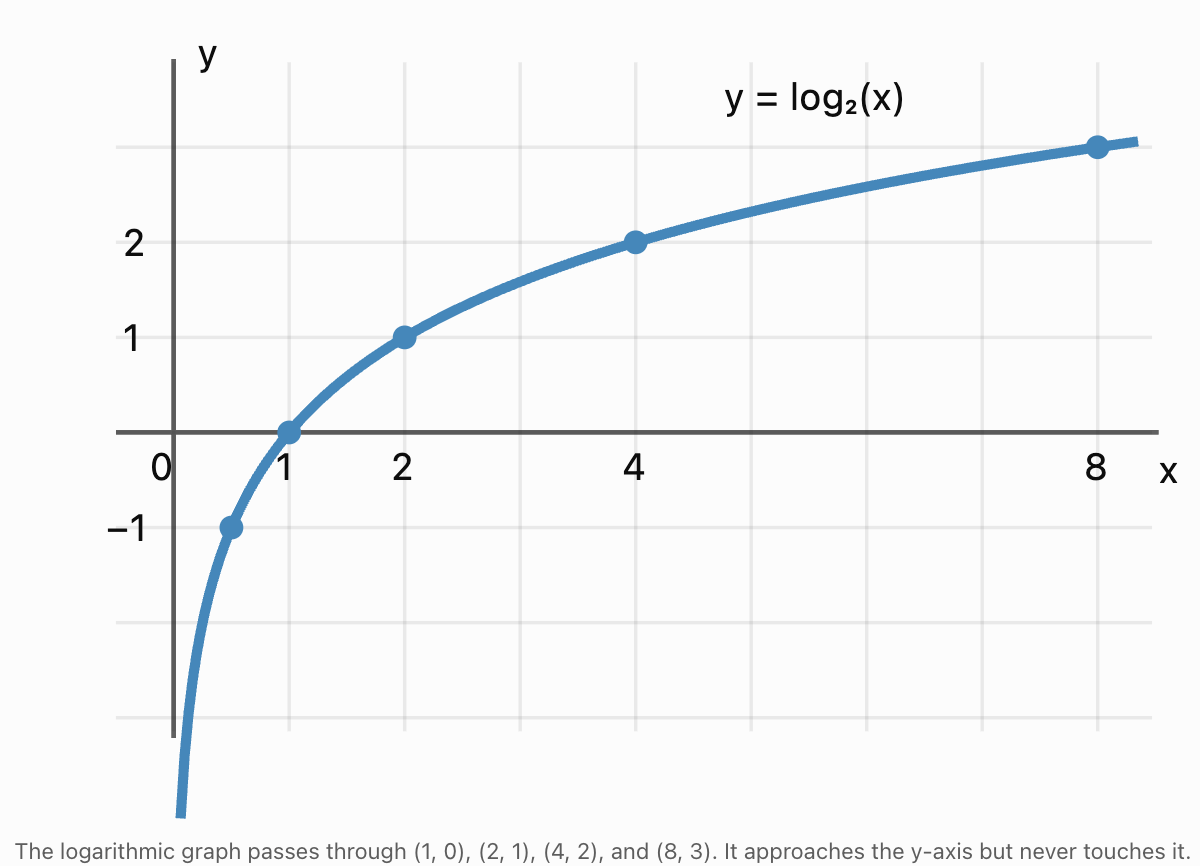
Plotting these coordinates produces a smooth curve that rises from left to right.
Important Observations
-
The graph exists only to the right of the y-axis.
-
It passes through (1, 0).
-
It increases as x increases.
-
It rises more slowly as x becomes larger.
-
It approaches the y-axis as x approaches zero from the positive side.
-
It continues indefinitely upward and downward.
These features are characteristic of logarithmic functions with bases greater than 1.
Domain of a Logarithmic Function
The domain is the set of all possible input values.
For:
y = logₐ(x)
the argument must be positive.
Therefore:
x > 0
The domain is:
(0, ∞)
This is true for every basic real logarithmic function with a valid base.
Why Must x Be Positive?
Consider:
y = log₂(x)
This is equivalent to:
x = 2ʸ
Since 2 raised to any real power is always positive, x cannot equal zero or be negative.
Therefore:
-
log₂(8) is defined.
-
log₂(1) is defined.
-
log₂(0.25) is defined.
-
log₂(0) is undefined in the real numbers.
-
log₂(−4) is undefined in the real numbers.
Worked Example
Determine the domain of:
f(x) = log₅(x)
The argument must be positive.
x > 0
Domain: (0, ∞)
Range of a Logarithmic Function
The range is the set of all possible output values.
For:
y = logₐ(x)
the logarithm can produce any real number.
For example:
log₂(1/8) = −3
log₂(1) = 0
log₂(8) = 3
The logarithmic value can become arbitrarily large or arbitrarily negative.
Therefore:
Range: (−∞, ∞)
Important Distinction
For the basic logarithmic function:
-
Domain: positive real numbers.
-
Range: all real numbers.
This is the reverse of the basic exponential function, whose domain is all real numbers and whose range is positive real numbers.
Vertical Asymptotes
An asymptote is a line that a graph approaches in a limiting sense.
For the basic logarithmic function:
y = logₐ(x)
the vertical asymptote is:
x = 0
This is the y-axis.
Understanding the Asymptote
For y = log₂(x), as x approaches zero from the right:
|
x |
log₂(x), approximately |
|---|---|
|
1 |
0 |
|
0.5 |
−1 |
|
0.25 |
−2 |
|
0.125 |
−3 |
|
0.01 |
−6.644 |
|
0.001 |
−9.966 |
As x approaches zero, the logarithm decreases without bound.
Mathematically:
lim(x → 0⁺) log₂(x) = −∞
The notation 0⁺ means approaching zero from positive values.
For bases between 0 and 1, the logarithmic function instead increases without bound as x approaches zero from the right.
Important Principle
The graph approaches its vertical asymptote but never reaches it.
The asymptote marks a boundary of the function's domain.
Intercepts of Logarithmic Graphs
An intercept is a point where a graph crosses an axis.
The x-Intercept
For:
y = logₐ(x)
the x-intercept occurs when:
y = 0
Therefore:
logₐ(x) = 0
Convert to exponential form:
x = a⁰
x = 1
Thus, every basic logarithmic function passes through:
(1, 0)
The y-Intercept
A y-intercept occurs when x = 0.
However:
logₐ(0)
is undefined.
Therefore, the basic logarithmic function has no y-intercept.
Summary
For y = logₐ(x):
-
x-intercept: (1, 0).
-
y-intercept: none.
-
Vertical asymptote: x = 0.
Increasing and Decreasing Logarithmic Functions
The shape of a logarithmic graph depends on its base.
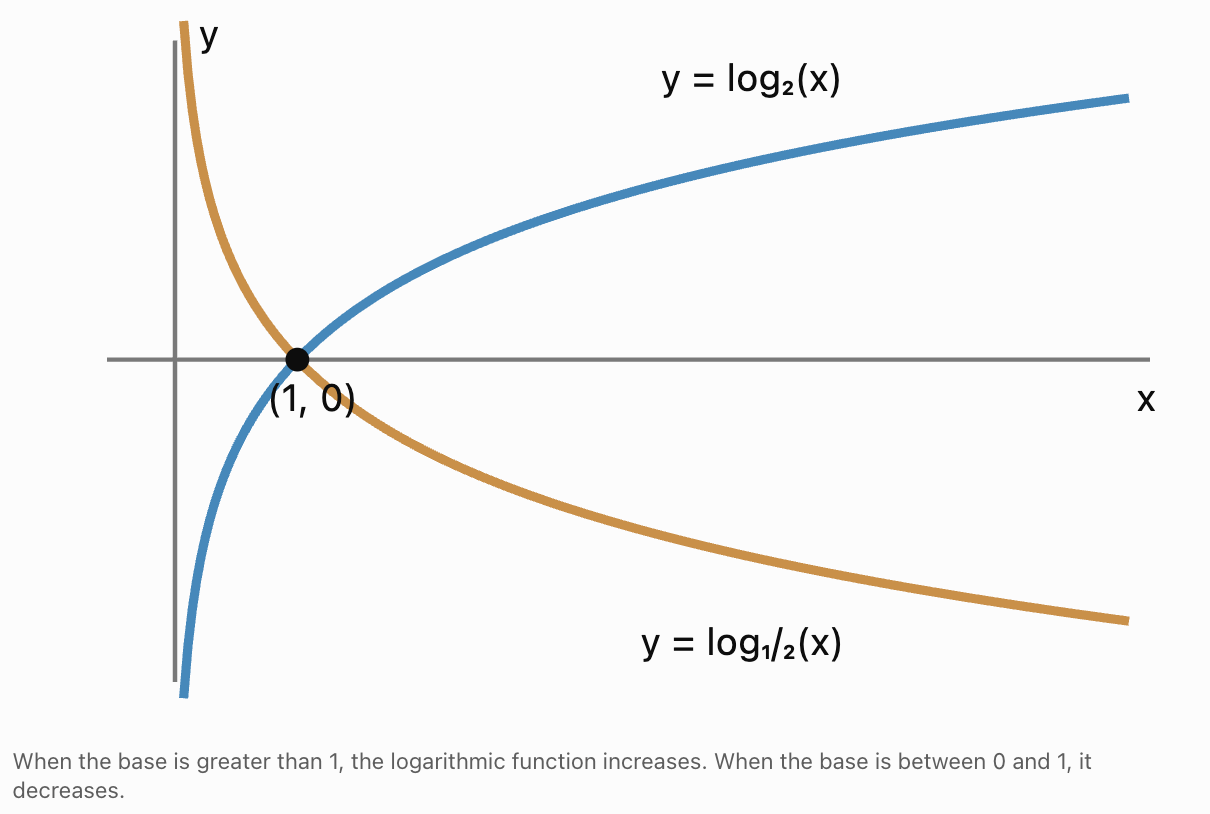
Bases Greater Than 1
For:
a > 1
the graph increases from left to right.
Examples:
y = log₂(x)
y = log₃(x)
y = log₁₀(x)
As x increases, y increases.
Bases Between 0 and 1
For:
0 < a < 1
the graph decreases from left to right.
Examples:
y = log₁/₂(x)
y = log₁/₃(x)
As x increases, y decreases.
Comparing Values
|
x |
log₂(x) |
log₁/₂(x) |
|---|---|---|
|
1/4 |
−2 |
2 |
|
1/2 |
−1 |
1 |
|
1 |
0 |
0 |
|
2 |
1 |
−1 |
|
4 |
2 |
−2 |
Notice:
log₁/₂(x) = −log₂(x)
The two graphs are reflections across the x-axis.
Comparing Logarithmic and Exponential Graphs
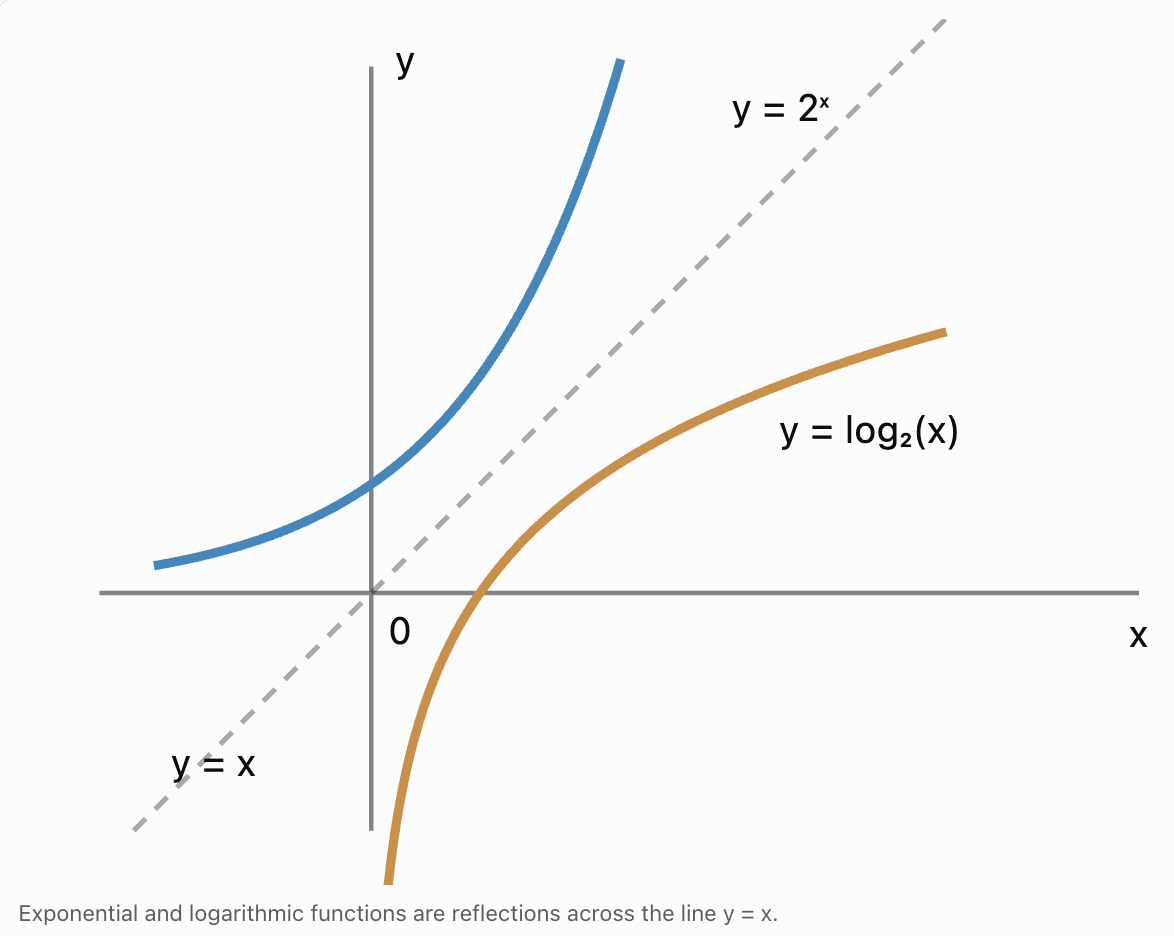
Logarithmic functions and exponential functions are inverses.
Consider:
y = 2ˣ
and:
y = log₂(x)
The exponential function converts exponents into values.
The logarithmic function converts values back into exponents.
Coordinate Relationships
For the exponential function:
|
x |
y = 2ˣ |
|---|---|
|
−2 |
1/4 |
|
−1 |
1/2 |
|
0 |
1 |
|
1 |
2 |
|
2 |
4 |
|
3 |
8 |
For its inverse:
|
x |
y = log₂(x) |
|---|---|
|
1/4 |
−2 |
|
1/2 |
−1 |
|
1 |
0 |
|
2 |
1 |
|
4 |
2 |
|
8 |
3 |
Notice that the coordinates are reversed.
For example:
The point (3, 8) lies on y = 2ˣ.
The point (8, 3) lies on y = log₂(x).
This is a defining property of inverse functions.
Reflection Across y = x
The graphs of a function and its inverse are reflections across the line:
y = x
Comparing Their Features
|
Feature |
Exponential: y = 2ˣ |
Logarithmic: y = log₂(x) |
|---|---|---|
|
Domain |
All real numbers |
x > 0 |
|
Range |
y > 0 |
All real numbers |
|
x-intercept |
None |
(1, 0) |
|
y-intercept |
(0, 1) |
None |
|
Asymptote |
y = 0 |
x = 0 |
|
Direction |
Increasing |
Increasing |
|
Inverse |
log₂(x) |
2ˣ |
The domain and range are exchanged, and the horizontal asymptote of the exponential function becomes a vertical asymptote for the logarithmic function.
Transformations of Logarithmic Functions
Like other functions, logarithmic graphs can be translated, reflected, and stretched.
The general transformed logarithmic function can be written:
y = A logₐ[B(x − h)] + k
where:
-
A controls vertical stretching and reflection.
-
a is the logarithmic base.
-
B controls horizontal stretching and reflection.
-
h determines the horizontal translation.
-
k determines the vertical translation.
The logarithm is defined only when its argument is positive:
B(x − h) > 0
The vertical asymptote occurs at:
x = h
provided A and B are nonzero and the base is valid.
Horizontal Translations
Consider:
y = log₂(x − 3)
This is the graph of y = log₂(x) shifted 3 units to the right.
Domain
The argument must be positive.
x − 3 > 0
x > 3
Domain:
(3, ∞)
Vertical Asymptote
The argument approaches zero when:
x − 3 = 0
x = 3
x-Intercept
Set y = 0.
log₂(x − 3) = 0
Convert to exponential form:
x − 3 = 2⁰
x − 3 = 1
x = 4
Therefore, the x-intercept is:
(4, 0)
Interpretation
The original graph passes through (1, 0).
After shifting 3 units right, it passes through (4, 0).
Horizontal Shifts to the Left
Consider:
y = log₃(x + 2)
This represents a shift 2 units to the left.
Domain
x + 2 > 0
x > −2
Vertical Asymptote
x = −2
x-Intercept
log₃(x + 2) = 0
x + 2 = 1
x = −1
The x-intercept is:
(−1, 0)
y-Intercept
Set x = 0.
y = log₃(2)
y ≈ 0.631
Therefore, the graph crosses the y-axis at approximately:
(0, 0.631)
Unlike the basic logarithmic graph, this transformed function has a y-intercept.
Vertical Translations
Consider:
y = log₂(x) + 3
The graph is shifted upward by 3 units.
Domain
The argument remains x.
Therefore:
x > 0
Range
The range remains all real numbers.
Vertical Asymptote
The asymptote remains:
x = 0
x-Intercept
Set y = 0.
log₂(x) + 3 = 0
log₂(x) = −3
x = 2⁻³
x = 1/8
Therefore, the x-intercept is:
(1/8, 0)
Important Principle
A vertical translation changes the output values but does not change the domain or vertical asymptote of a logarithmic function.
Reflections of Logarithmic Graphs
A negative coefficient outside a logarithm reflects its graph across the x-axis.
Consider:
y = −log₂(x)
The original graph increases.
The reflected graph decreases.
Important Features
-
Domain: x > 0.
-
Range: all real numbers.
-
Vertical asymptote: x = 0.
-
x-intercept: (1, 0).
-
Decreasing from left to right.
Reflection Across the y-Axis
Consider:
y = log₂(−x)
The argument must be positive.
−x > 0
x < 0
Therefore:
-
Domain: (−∞, 0).
-
Range: all real numbers.
-
Vertical asymptote: x = 0.
-
x-intercept: (−1, 0).
This graph is the reflection of y = log₂(x) across the y-axis.
Vertical Stretches and Compressions
Consider:
y = 3log₂(x)
Every output value of the original function is multiplied by 3.
For example:
|
x |
log₂(x) |
3log₂(x) |
|---|---|---|
|
1/2 |
−1 |
−3 |
|
1 |
0 |
0 |
|
2 |
1 |
3 |
|
4 |
2 |
6 |
The graph becomes steeper relative to the x-axis.
However, its domain and vertical asymptote remain unchanged.
Worked Example: Graphing a Transformed Logarithm
Sketch:
f(x) = 2log₃(x − 1) − 4
Identify the domain, range, vertical asymptote, and x-intercept.
Step 1: Identify Transformations
Starting with:
y = log₃(x)
the transformations are:
-
Shift right 1 unit.
-
Stretch vertically by a factor of 2.
-
Shift downward 4 units.
Step 2: Determine the Domain
The argument must be positive.
x − 1 > 0
x > 1
Domain:
(1, ∞)
Step 3: Determine the Range
A logarithmic function can produce every real output value.
Vertical stretching and translation do not change this.
Range: (−∞, ∞)
Step 4: Determine the Asymptote
Set the argument equal to zero.
x − 1 = 0
Vertical asymptote: x = 1
Step 5: Find the x-Intercept
Set y = 0.
0 = 2log₃(x − 1) − 4
4 = 2log₃(x − 1)
2 = log₃(x − 1)
Convert to exponential form:
x − 1 = 3²
x − 1 = 9
x = 10
Therefore:
x-intercept: (10, 0)
Step 6: Generate Points
|
x |
x − 1 |
log₃(x − 1) |
f(x) |
|---|---|---|---|
|
4/3 |
1/3 |
−1 |
−6 |
|
2 |
1 |
0 |
−4 |
|
4 |
3 |
1 |
−2 |
|
10 |
9 |
2 |
0 |
|
28 |
27 |
3 |
2 |
Final Interpretation
The graph increases from left to right, approaches the vertical asymptote x = 1, and crosses the x-axis at (10, 0).
It has no y-intercept because x = 0 lies outside its domain.
Finding the Domain of More Complicated Logarithmic Functions
For any real logarithmic function, the argument must be strictly positive.
This principle can be applied to more complicated expressions.
Worked Example: Linear Argument
Find the domain of:
f(x) = log₅(2x − 6)
Require:
2x − 6 > 0
2x > 6
x > 3
Domain:
(3, ∞)
Worked Example: Negative Coefficient
Find the domain of:
f(x) = ln(8 − 2x)
Require:
8 − 2x > 0
−2x > −8
Divide by −2 and reverse the inequality:
x < 4
Domain:
(−∞, 4)
Worked Example: Quadratic Argument
Find the domain of:
f(x) = log₂(x² − 9)
Require:
x² − 9 > 0
Factorise:
(x − 3)(x + 3) > 0
The product is positive when both factors are positive or both are negative.
Therefore:
x < −3 or x > 3
Domain:
(−∞, −3) ∪ (3, ∞)
This graph has two separate branches.
Its vertical asymptotes are x = −3 and x = 3, because the argument approaches zero from positive values at those boundaries.
This example demonstrates that more complicated logarithmic functions may have multiple domain intervals and vertical asymptotes.
Common and Natural Logarithmic Graphs
Two important logarithmic functions are:
y = log(x)
and:
y = ln(x)
In standard school notation:
log(x) = log₁₀(x)
ln(x) = logₑ(x)
Both graphs:
-
Have domain x > 0.
-
Have range all real numbers.
-
Pass through (1, 0).
-
Have vertical asymptote x = 0.
-
Increase from left to right.
However, they increase at different rates.
Comparing Values
|
x |
log₁₀(x), approximately |
ln(x), approximately |
|---|---|---|
|
0.1 |
−1 |
−2.303 |
|
1 |
0 |
0 |
|
2 |
0.301 |
0.693 |
|
10 |
1 |
2.303 |
|
100 |
2 |
4.605 |
For x > 1, ln(x) is greater than log₁₀(x).
For 0 < x < 1, ln(x) is more negative.
Interpreting Logarithmic Graphs
A logarithmic graph provides information about how an output changes as the input increases.
For:
y = log₂(x)
doubling the input increases the output by 1.
For example:
log₂(2) = 1
log₂(4) = 2
log₂(8) = 3
log₂(16) = 4
Each time x doubles, y increases by exactly 1.
General Pattern
For:
y = logₐ(x)
multiplying x by a increases the logarithm by 1.
This follows because:
logₐ(ax) = logₐ(x) + 1
for x > 0.
Why This Matters
Logarithmic functions compress large multiplicative changes into smaller additive changes.
This makes them useful for displaying data that spans several orders of magnitude.
Logarithmic Scales in Real-World Data
Logarithmic graphs are widely used in science and engineering.
Sound Intensity
Sound intensity level can be calculated using:
L = 10log₁₀(I/I₀)
where:
-
L = sound intensity level in decibels.
-
I = measured sound intensity.
-
I₀ = reference intensity.
If sound intensity increases by a factor of 10, the intensity level increases by 10 dB.
If it increases by a factor of 100, the intensity level increases by 20 dB.
Earthquake Magnitudes
Earthquake magnitude measurements use logarithmic relationships to represent enormous differences in seismic measurements.
Acidity and pH
The pH scale is defined by:
pH = −log₁₀(a_H⁺)
where a_H⁺ is the dimensionless activity of hydrogen ions. In dilute solutions, this is often approximated using hydrogen-ion concentration relative to 1 mol/L.
A tenfold increase in hydrogen-ion activity decreases pH by 1.
Computer Science
Logarithmic functions appear in algorithms, particularly when a problem can be repeatedly divided into smaller parts.
For example, binary search has logarithmic time complexity because each comparison eliminates approximately half the remaining possibilities.


Interpreting the Shape of a Logarithmic Graph
The graph of y = log₂(x) rises rapidly near x = 0 but increases more slowly for large x.
For example:
-
Increasing x from 1 to 2 raises y from 0 to 1.
-
Increasing x from 2 to 4 raises y from 1 to 2.
-
Increasing x from 4 to 8 raises y from 2 to 3.
-
Increasing x from 8 to 16 raises y from 3 to 4.
The horizontal increase required for the same vertical increase becomes progressively larger.
This behaviour is called diminishing growth in the rate of increase.
For bases greater than 1, the graph is increasing but concave downward.
Calculus Connection
For:
y = ln(x)
the derivative is:
dy/dx = 1/x
for x > 0.
As x increases, 1/x decreases.
This explains why the graph becomes less steep as x becomes larger.
For:
y = logₐ(x)
the derivative is:
dy/dx = 1/[x ln(a)]
For a > 1, this derivative is positive.
For 0 < a < 1, it is negative.
Thus, calculus confirms the increasing and decreasing behaviour observed graphically.
A Reliable Method for Sketching Logarithmic Graphs
When sketching a logarithmic function, use the following sequence.
-
Identify the base. Determine whether the function increases or decreases.
-
Find the domain. Set the logarithm's argument greater than zero and solve.
-
Find vertical asymptotes. Examine boundaries where the argument approaches zero from within the domain.
-
Find intercepts. Set y = 0 for x-intercepts and x = 0 for y-intercepts, where permitted.
-
Calculate convenient points. Choose arguments that are powers of the base.
-
Apply transformations. Account for shifts, stretches, and reflections.
-
Draw the curve. Sketch a smooth curve approaching its asymptote without crossing it.
-
Check the range and behaviour. Verify whether the function increases, decreases, or has multiple branches.
This approach works for many logarithmic functions encountered in secondary mathematics.
Common Mistakes
Assuming logarithmic functions accept all real inputs
The argument of a real logarithm must be positive.
Confusing the domain and range
For y = logₐ(x), the domain is x > 0 and the range is all real numbers.
Drawing a logarithmic graph through the y-axis
The basic logarithmic function has a vertical asymptote at x = 0.
Assuming every logarithmic graph increases
Logarithmic functions with bases between 0 and 1 decrease.
Confusing vertical and horizontal asymptotes
Basic exponential functions have horizontal asymptotes, while basic logarithmic functions have vertical asymptotes.
Forgetting transformations when identifying asymptotes
For y = log₂(x − 4), the vertical asymptote is x = 4, not x = 0.
Assuming all logarithmic functions pass through (1, 0)
This is true for basic logarithmic functions, but transformations can change the intercept.
Incorrectly interpreting horizontal translations
The function log₂(x − 3) shifts right 3 units, not left.
Forgetting to reverse an inequality when dividing by a negative number
This is especially important when finding the domain of functions such as ln(5 − x).
Confusing exponential and logarithmic coordinates
Inverse functions exchange their x- and y-coordinates.
Assuming logarithmic graphs are straight lines
Logarithmic functions are curved when plotted on ordinary linear axes.
Ignoring the context of a graph
A mathematical domain may need additional restrictions in a real-world situation.
Key Terms
-
Logarithmic Function: A function that determines the exponent required to produce a positive argument from a fixed base.
-
Exponential Function: A function in which the variable appears in the exponent.
-
Inverse Function: A function that reverses the action of another function.
-
Base: The fixed positive number, other than 1, used in a logarithmic expression.
-
Argument: The expression inside a logarithm.
-
Domain: The set of allowable input values.
-
Range: The set of possible output values.
-
Vertical Asymptote: A vertical line approached by a graph as the function values become unbounded near that line.
-
Horizontal Asymptote: A horizontal line approached by a graph as the input moves toward positive or negative infinity.
-
x-Intercept: A point where a graph crosses or touches the x-axis.
-
y-Intercept: A point where a graph crosses or touches the y-axis.
-
Increasing Function: A function whose outputs increase as its inputs increase.
-
Decreasing Function: A function whose outputs decrease as its inputs increase.
-
Transformation: A change to the position, orientation, or scale of a graph.
-
Horizontal Translation: A shift left or right.
-
Vertical Translation: A shift upward or downward.
-
Reflection: A transformation that flips a graph across a specified line.
-
Vertical Stretch: A transformation that multiplies the function's output values by a factor greater than 1.
-
Vertical Compression: A transformation that reduces the magnitude of the function's output values.
-
Common Logarithm: A logarithm with base 10.
-
Natural Logarithm: A logarithm with base e.
-
Logarithmic Scale: A scale that represents multiplicative changes using logarithmic values.
-
Order of Magnitude: A measure of numerical scale, commonly expressed using powers of 10.
-
Concavity: A description of how the slope of a graph changes.
-
Continuous Function: A function without breaks at points within its domain.
-
One-to-One Function: A function in which different inputs produce different outputs.
-
Reflection Across y = x: The graphical relationship between a function and its inverse.
-
Interval Notation: A method for expressing sets of real numbers using interval endpoints.
-
Graphical Interpretation: Using the features of a graph to understand mathematical relationships.
Key Takeaways
-
Logarithmic functions are the inverses of exponential functions.
-
The basic logarithmic function has the form y = logₐ(x), where a > 0 and a ≠ 1.
-
The argument of a real logarithm must always be positive.
-
The basic logarithmic function has domain (0, ∞).
-
Its range is all real numbers.
-
Every basic logarithmic graph passes through (1, 0).
-
Basic logarithmic functions have no y-intercept.
-
Their vertical asymptote is x = 0.
-
Logarithmic functions with bases greater than 1 increase from left to right.
-
Logarithmic functions with bases between 0 and 1 decrease from left to right.
-
Exponential and logarithmic graphs are reflections across y = x.
-
The domain and range of inverse functions are exchanged.
-
Horizontal translations change the domain and vertical asymptote of logarithmic functions.
-
Vertical translations change the output values but preserve the domain.
-
Reflections and stretches alter the shape or orientation of logarithmic graphs.
-
The domain of a transformed logarithmic function is determined by requiring its argument to be positive.
-
Convenient graphing points can be found by choosing arguments that are powers of the base.
-
Logarithmic graphs represent multiplicative relationships in a compressed form.
-
Logarithmic scales are useful for representing quantities spanning large numerical ranges.
-
Logarithmic functions appear in sound measurement, chemistry, earthquake analysis, computer science, and scientific modelling.
-
Graphical interpretation provides information about growth, change, intercepts, asymptotes, and mathematical restrictions.
Check Your Understanding
Recall and Understanding
-
Describe the general shape of y = log₂(x).
-
State the domain and range of a basic logarithmic function.
-
Explain why y = log₃(x) has a vertical asymptote at x = 0.
-
Describe the difference between logarithmic graphs with bases greater than 1 and bases between 0 and 1.
-
Explain how the graphs of y = 2ˣ and y = log₂(x) are related.
Application
-
Sketch y = log₃(x), identifying its domain, range, intercepts, and vertical asymptote.
-
Determine the domain and vertical asymptote of y = log₂(x − 5).
-
Find the x-intercept of y = log₄(x) + 2.
-
Sketch y = −log₂(x), explaining how it relates to y = log₂(x).
-
Determine the domain, range, and vertical asymptote of y = ln(7 − x).
Analysis and Challenge
-
A logarithmic graph passes through (2, 0) and (4, 1), and has a vertical asymptote at x = 1. Determine a function of the form y = logₐ(x − h) + k that satisfies these conditions.
-
Compare y = log₂(x) and y = log₄(x). Explain which graph increases more rapidly for x > 1 and justify your reasoning.
-
Find the domain and vertical asymptotes of y = log₃(x² − 16). Explain why the graph has two separate branches.
-
A sound intensity level is modelled by L = 10log₁₀(I/I₀). Explain graphically how the intensity level changes when the intensity is multiplied by 10, 100, and 1000.
-
Sketch y = −2log₃(x + 1) + 4. Identify its domain, range, vertical asymptote, intercepts, and transformations from y = log₃(x).
Final Summary
Logarithmic functions provide a graphical representation of inverse exponential relationships.
Their graphs have distinctive features, including restricted domains, unrestricted ranges, and vertical asymptotes.
The basic logarithmic function y = logₐ(x) passes through (1, 0) and is defined only for positive inputs.
When the base is greater than 1, the graph increases. When the base is between 0 and 1, the graph decreases.
Because logarithmic and exponential functions are inverses, their graphs are reflections across the line y = x.
Transformations allow logarithmic graphs to be shifted, stretched, compressed, and reflected. These transformations affect important features such as intercepts, domains, and asymptotes.
Logarithmic graphs are also valuable in real-world applications because they represent large multiplicative changes using comparatively small differences in output values.
The central principle is that understanding the domain, range, asymptote, intercepts, and transformations of a logarithmic function makes it possible to sketch and interpret its graph accurately without relying entirely on a calculator.