Graphing and Data Analysis
2. Gradient and intercepts
Learning outcomes
- I can determine the gradient of a straight-line graph.
- I can interpret the physical meaning of a graph's gradient.
- I can determine the x- and y-intercepts of graphs.
- I can relate graph features to physical quantities.
- I can calculate unknown quantities using gradients and intercepts.
What Is the Gradient of a Graph?
The gradient describes how steep a straight line is.
It tells us how much the value on the y-axis changes compared with a change in the value on the x-axis.
You may also hear gradient called slope.
A steep line has a larger gradient than a shallow line.
The gradient can be:
- Positive
- Negative
- Zero
- Undefined
More importantly, in science and real-world applications, the gradient often represents an actual physical quantity.
For example, the gradient of a distance-time graph can represent speed.
Calculating Gradient
To calculate the gradient of a straight line, choose two points on the line.
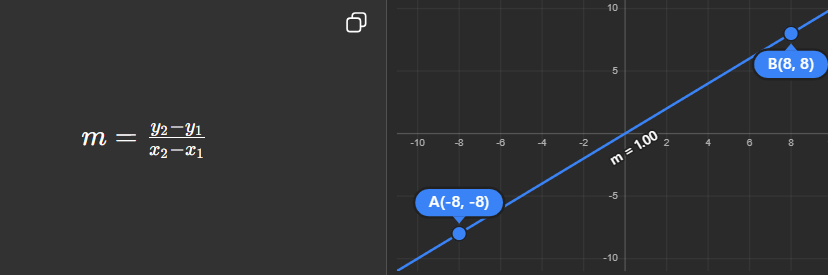
This is often remembered as:
where:
- Rise = vertical change
- Run = horizontal change
Example: Finding a Gradient
Suppose a straight line passes through:
(2, 4)
and
(6, 12)
The change in y is:
The change in x is:
Therefore:
m = 2
This means that every time x increases by 1, y increases by 2.
Choosing Points for a Gradient Calculation
When finding the gradient from a graph, choose two points that lie on the straight line.
If a line of best fit has been drawn through experimental data, the points used for the gradient calculation should usually be points on the line of best fit.
They do not have to be original experimental data points.
It is also helpful to choose points that are:
- Easy to read accurately.
- Far apart from each other.
- Located at clear grid intersections if possible.
Using points far apart usually reduces the effect of small reading errors.
Positive Gradient
A line that rises from left to right has a positive gradient.
For example:
has a gradient of:
3
This means that when x increases by 1, y increases by 3.
A positive gradient indicates that the two variables increase together.
Negative Gradient
A line that falls from left to right has a negative gradient.
For example:
has a gradient of:
−2
This means that when x increases by 1, y decreases by 2.
A negative gradient indicates that one variable decreases as the other increases.
Zero Gradient
A horizontal line has a gradient of:
0
For example:
As x changes, y remains constant.
Therefore:
and the gradient is zero.
Vertical Lines
A vertical line has an undefined gradient.
For example:
There is no horizontal change between points on the line.
This would require division by zero when calculating the gradient, which is undefined.
What Does Gradient Mean Physically?
In many graphs, the gradient is more than just a number.
It represents the rate at which one physical quantity changes compared with another.
The meaning of the gradient depends on the quantities plotted on the axes.
Example: Distance-Time Graph
Suppose distance is plotted against time.
The gradient is:
\( \frac{change \ in \ distance}{change \ in \ time} \)
This is speed.
Suppose an object travels from 0 m to 60 m in 5 seconds.
The gradient is:
\( \frac{60 - 0}{5 - 0} = 12 \)
Therefore:
speed = 12 m/s
The gradient of the graph tells us how fast the object is moving.
Units of Gradient
The units of a gradient come from:
\( \frac{units \ on \ the \ y-axis}{units \ on \ the \ x-axis} \)
For a distance-time graph:
\( \frac{meters}{seconds} \)
which gives:
m/s
For a mass-volume graph:
\( \frac{grams}{cm^3} \)
which gives:
g/cm3
This is the unit of density.
The units can therefore help us understand what the gradient physically represents.
Gradient as a Rate of Change
Gradient is fundamentally a rate of change.
It tells us:
How much does one quantity change when another quantity changes?
For example:
| Graph | Gradient can represent |
|---|---|
| Distance vs. time | Speed |
| Velocity vs. time | Acceleration |
| Mass vs. volume | Density |
| Extension vs. force | Extension per unit force |
| Cost vs. number of items | Cost per item |
The same mathematical idea can therefore describe many different physical situations.
What Is an Intercept?
An intercept is a point where a graph crosses one of its axes.
There are two main intercepts:
- x-intercept
- y-intercept
Intercepts can also have important physical meanings.
The y-Intercept
The y-intercept is the point where the graph crosses the y-axis.
At the y-intercept:
Consider:
When:
we get:
Therefore, the y-intercept is:
(0, 4)
The x-Intercept
The x-intercept is the point where the graph crosses the x-axis.
At the x-intercept:
Consider:
Set :
Add 6:
Divide by 2:
Therefore, the x-intercept is:
(3, 0)
Intercepts on a Graph
Remember:
At the y-intercept:
x = 0
At the x-intercept:
y = 0
This gives us a simple method for finding intercepts from equations.
The Straight-Line Equation
Straight-line graphs are often written in the form:
where:
- m = gradient
- c = y-intercept
Consider:
The gradient is:
4
and the y-intercept is:
3
So the line crosses the y-axis at:
(0, 3)
Finding an Unknown Quantity Using Gradient
Suppose a distance-time graph has a gradient of:
5 m/s
An object travels for 8 seconds.
Because:
we can rearrange:
Therefore:
distance = 40 m
Once we know what the gradient represents, we can use it to calculate unknown physical quantities.
Finding an Unknown Quantity Using the Intercept
Imagine a water tank contains 200 L of water at the beginning of an experiment.
Water then enters the tank at 15 L/min.
If volume is plotted against time, the relationship could be written as:
The gradient is:
15 L/min
This represents the rate at which water enters the tank.
The y-intercept is:
200 L
This represents the initial volume of water at:
After 10 minutes:
Therefore:
V = 350 L
Both the gradient and intercept provide useful physical information.
Interpreting a Real-World Graph
Suppose the cost of renting a bicycle is described by:
where:
- C is the total cost in dollars.
- t is the rental time in hours.
The gradient is:
8
This means the bicycle costs:
$8 per hour
The y-intercept is:
5
This represents an initial charge of:
$5
So the graph tells us two different things:
- Gradient → cost per hour
- y-intercept → starting fee
Using Gradient and Intercepts Together
Consider:
We can immediately identify:
and:
Therefore:
- Gradient = 3
- y-intercept = (0, 6)
To find the x-intercept, set:
So:
Therefore:
x-intercept=(−2,0)
The gradient and intercepts give us important information about the position and behaviour of the line.
Graph Features and Physical Quantities
When interpreting an experimental graph, ask three important questions.
What does the gradient represent?
Look at the quantities and units on the axes.
What does the y-intercept represent?
Ask what the dependent variable means when:
It may represent an initial value.
What does the x-intercept represent?
Ask what is happening when:
It may represent the time when a quantity reaches zero or the value required to produce a particular physical condition.
A Useful Graph Analysis Strategy
When given a straight-line graph:
1. Identify the axes
What physical quantities are plotted?
2. Identify the units
These can help determine what the gradient means.
3. Calculate the gradient
Use two clear points on the line.
4. Include units
Gradient is a physical rate when the axes represent measured quantities.
5. Find the intercepts
Look where the graph crosses each axis.
6. Interpret the results
Explain what the gradient and intercepts mean in the context of the problem.
Did You Know?
The gradient is one of the most important ideas connecting mathematics and science.
The same calculation:
\( \frac{ \Delta y }{ \Delta x } \)
can represent completely different physical quantities depending on the graph.
For example, it can represent speed, acceleration, density, resistance, a spring constant, or a rate of heating.
This is why reading the axis labels and units is just as important as calculating the gradient itself.
Key Vocabulary
Gradient – A measure of the steepness and direction of a straight line.
Slope – Another name for gradient.
Rate of change – How quickly one quantity changes compared with another.
Intercept – A point where a graph crosses an axis.
x-intercept – The point where a graph crosses the x-axis.
y-intercept – The point where a graph crosses the y-axis.
Independent variable – The variable normally plotted on the x-axis.
Dependent variable – The variable normally plotted on the y-axis.
Linear relationship – A relationship represented by a straight-line graph.
Key Takeaways
- Gradient measures the steepness and direction of a straight line.
- Gradient is calculated using the change in y divided by the change in x.
- A positive gradient rises from left to right.
- A negative gradient falls from left to right.
- A horizontal line has a gradient of zero.
- A vertical line has an undefined gradient.
- The units of a gradient come from the y-axis units divided by the x-axis units.
- In physical graphs, gradient often represents a meaningful rate of change.
- The y-intercept occurs where .
- The x-intercept occurs where .
- In , m is the gradient and c is the y-intercept.
- Gradients and intercepts can be used to calculate and interpret unknown physical quantities.