4. Designing a Science Fair Display

Learning outcomes
  • I can organize information into a clear display.
  • I can design effective graphs, diagrams, and visuals.
  • I can communicate scientific ideas clearly.
  • I can present information in a logical sequence.
  • I can create an attractive and informative display.

Designing a Science Fair Display

A science fair display is more than decoration. It is a visual scientific report that allows someone to understand your investigation without reading a long research paper or listening to your entire presentation.

A strong display should quickly answer several questions:

  • What did you investigate?
  • Why did you investigate it?
  • What did you predict?
  • How did you conduct the investigation?
  • What data did you collect?
  • What patterns did you find?
  • What did you conclude?
  • How reliable were your results?

The best displays combine clear scientific information, logical organization, effective visuals, and an attractive design.

https://images.openai.com/static-rsc-4/hv6Tvgg-ZEBuFZP4vCL7JoCt3h4HsqW9wDNagy8bPF74q9FdGTfLQ3rVrYXx5WCIQ6TUqZITe7EAvA33aAYSlOoOMs7bQB587NyyR3SZcTeu7SDeXiMPRL3yRb_06bFbP85Y8yLQYFOeX3p29aaHkOXDtTwPb_yrWE_BmrYYZ0U24rN5IC_MQ6UTvXmyIRLQ?purpose=fullsize
 
https://images.openai.com/static-rsc-4/Z1CgmLxk5BjJ6o7wuZWuLImjWKIqqeIuu_qRSECPtmfAWuam_L6ZyHUmBTUGgnbT7rJMVmfMNrFBL5d2GrhohW_nw-U6aPIj3VMCMPL-ZY1jIOOm9cE2O0lA4eQEbqW8qTYMhGsfHGWTnN_1R2OAtBaNAAEd2LuHnx8Vc1QGa7IwAGNVX7j-yVWPbMZU-Krm?purpose=fullsize
 
https://images.openai.com/static-rsc-4/veMNxV5Iw2BjFNhE-m3OnQZnlWvoBUHZEumOyBEPOVnbMEYHUOkzjF5bfFkDdb4JbYB5UouIM8bnn0cA3fNvmVdXMREZ-ckGY64C7GkN7ev6fbWyFMPj_xCxbflbAZfCZOboFZ1sXe4wDTUZJzorShu8y_fJKVr_KbWBGvCfwNhXyqN6JhBhpZOYjMlsQCEW?purpose=fullsize
 
7

The Purpose of the Display

Your display should communicate the story of your investigation.

A visitor should be able to begin at the title, move through the investigation, examine your evidence, and finish with your conclusion.

A useful overall sequence is:

Question → Background → Hypothesis → Method → Results → Analysis → Conclusion → Evaluation

This follows the same general order in which the scientific investigation developed.

The display should not force the reader to guess where to look next.


Start with a Clear Title

Your title is usually one of the first things visitors notice.

It should be:

  • large
  • easy to read
  • relevant to the investigation
  • reasonably short

A title can be straightforward.

For example:

How Temperature Affects Sugar Dissolving Rate

or:

The Effect of Ramp Height on Toy-Car Speed

A title such as:

My Science Fair Project

does not tell the reader what the investigation was actually about.

Your title should immediately communicate the main scientific idea.

Organize Information Logically

A science fair board is often divided into sections.

A possible organization is:

Left section

  • Background Information
  • Research Question
  • Hypothesis
  • Variables

Centre section

  • Title
  • Method
  • Photographs or diagrams
  • Results
  • Main graph

Right section

  • Analysis
  • Conclusion
  • Evaluation
  • Improvements
  • References

This is only one possible arrangement.

The important idea is that the sections should follow a logical sequence.

A reader should not have to jump randomly from one side of the board to another.


Create a Visual Hierarchy

Not every piece of information should look equally important.

A visual hierarchy guides the reader toward the most important information first.

Usually:

Title — largest text

Section headings — large and clearly visible

Body text — smaller but easy to read

Graph and diagram labels — large enough to read comfortably

Important results or conclusions can also be emphasized.

This helps the viewer understand the structure of the display before reading every word.


Avoid Too Much Text

One of the most common science fair display problems is trying to place the entire written report on the board.

A display is not supposed to be a wall of paragraphs.

Instead of this:

The experiment was conducted using five different ramp heights and each height was tested three times in order to obtain sufficient data. The car was released from exactly the same location during each trial and the time required for the car to travel one metre was measured...

A display could communicate the same information more efficiently:

Method

  • Tested 5 ramp heights
  • Used the same toy car and ramp
  • Released car from the same point
  • Measured travel time over 1.0 m
  • Completed 3 trials at each height
  • Calculated the average time

The second version is easier to scan quickly.


Use White Space

You do not need to fill every centimetre of the display.

Empty space between sections is called white space or negative space.

White space helps:

  • separate sections
  • reduce visual clutter
  • make text easier to read
  • draw attention to important information
  • make the display look more organized

A board packed from edge to edge can make excellent scientific work look confusing.

A good rule is:

Do not ask, "How can I fill this space?"

Ask:

"Does this information help communicate my investigation?"


Make the Research Question Easy to Find

Your research question is one of the most important parts of the display.

For example:

How does the height of a ramp affect the average speed of a toy car?

Someone viewing the display should be able to find the question almost immediately.

The rest of the display should connect directly back to this question.

Your:

  • hypothesis
  • variables
  • method
  • data
  • graph
  • conclusion

should all relate to answering it.


Include the Variables

Clearly identify:

Independent variable — what you deliberately changed

Dependent variable — what you measured

Control variables — important factors kept constant

For example:

Independent variable: Ramp height

Dependent variable: Travel time

Control variables:

  • same toy car
  • same ramp
  • same surface
  • same travel distance
  • same release point

This helps the viewer understand how the investigation was designed as a fair test.


Use Photographs Effectively

Photographs can be very useful when they actually communicate something about the investigation.

Useful photographs might show:

  • experimental setup
  • measuring equipment
  • different experimental conditions
  • samples being tested
  • changes observed during the investigation
  • final products or results
https://images.openai.com/static-rsc-4/ZNgim2gh7tA2Ma4Su8BbWulFVInI-rBppNaLN74rDtXAtmBFF-GdAupV0LISYs2A7CQwt_GjvMM2GYOIjPcS9b1wzeFsyDd9CD0fh4Qin4n1LYqi1v5VDhcI0u4CdE3H3cVwDnoaDdy5e7qb5_rCLPHCuPWSEuOCHSZlXYudHCBWec4BcqvRCSag84KflQ7T?purpose=fullsize
 
https://images.openai.com/static-rsc-4/VeevE3_kbrHDbYl1lomLIL4BN8dLjzk_BM7rjua5pQk9JHXIM2cqwxKh0_z81D5f0pYY02MozMNR8ekk3pE3sxZM5V4_Bo49PnG79xW9mwo67DHanRzbYpvaOgxRW3Kpri3PINMDX6h-aERfAaIj8W9aWakDE3Qf0yfNDwS3oD5Ph99ayIv0K8l6hPODdKZs?purpose=fullsize
 
https://images.openai.com/static-rsc-4/AEw7lJg-n6yKgBjBPyNmGNBCJndVQiEX9iSm0Yk5yBcFIT4sx3leelmzoAjcQwPQdt6PF_dLoyV4cKwsq1WF369YWqNGt2HKtrRVHQ9zS38Q748MDruU6DWB3NK-yFN6c5avDruIDM2SwqjlpHnVMiOAZdmZ9FniGuCrE_lsKQ-R60W99pVFkL_9VhLQUWKH?purpose=fullsize
 
6

A photograph should have a purpose.

Instead of including ten nearly identical photographs of a plant, you might include:

  • initial plant condition
  • experimental setup
  • comparison between treatments
  • final plant condition

A short caption can explain what each photograph shows.

For example:

Bean seedlings after 14 days under different light conditions.


Use Diagrams When Photographs Are Not Enough

Sometimes a diagram communicates an experimental setup better than a photograph.

A photograph may contain distracting background objects or make equipment difficult to identify.

A simple experimental diagram can clearly show:

  • equipment arrangement
  • direction of movement
  • distances
  • measurement locations
  • important components

For example, a ramp experiment diagram might show:

release point → ramp → start line → 1.0 m measurement zone → finish line

Diagrams should be:

  • simple
  • clearly labelled
  • large enough to read
  • scientifically accurate

Do not add decorative details that make the scientific information harder to understand.


Tables Show the Actual Data

A results table allows viewers to see the measurements you collected.

For example:

Ramp height (cm) Trial 1 (s) Trial 2 (s) Trial 3 (s) Average time (s)
10 2.84 2.79 2.81 2.81
20 2.31 2.28 2.33 2.31
30 1.97 2.01 1.95 1.98
40 1.76 1.72 1.75 1.74

A good table should include:

  • descriptive headings
  • units
  • consistent decimal places when appropriate
  • clearly organized values

However, tables are not always the easiest way to see a pattern.

That is where graphs become especially useful.


Graphs Tell the Story of Your Data

A good graph can communicate an important result in seconds.

Suppose the ramp investigation produced the example data above.

A graph makes the relationship between ramp height and travel time much easier to see than the table alone.

When designing a graph, include:

  • a descriptive title
  • clearly labelled axes
  • units
  • appropriate scales
  • accurately plotted data
  • a suitable graph type

The independent variable normally goes on the horizontal x-axis.

The dependent variable normally goes on the vertical y-axis.
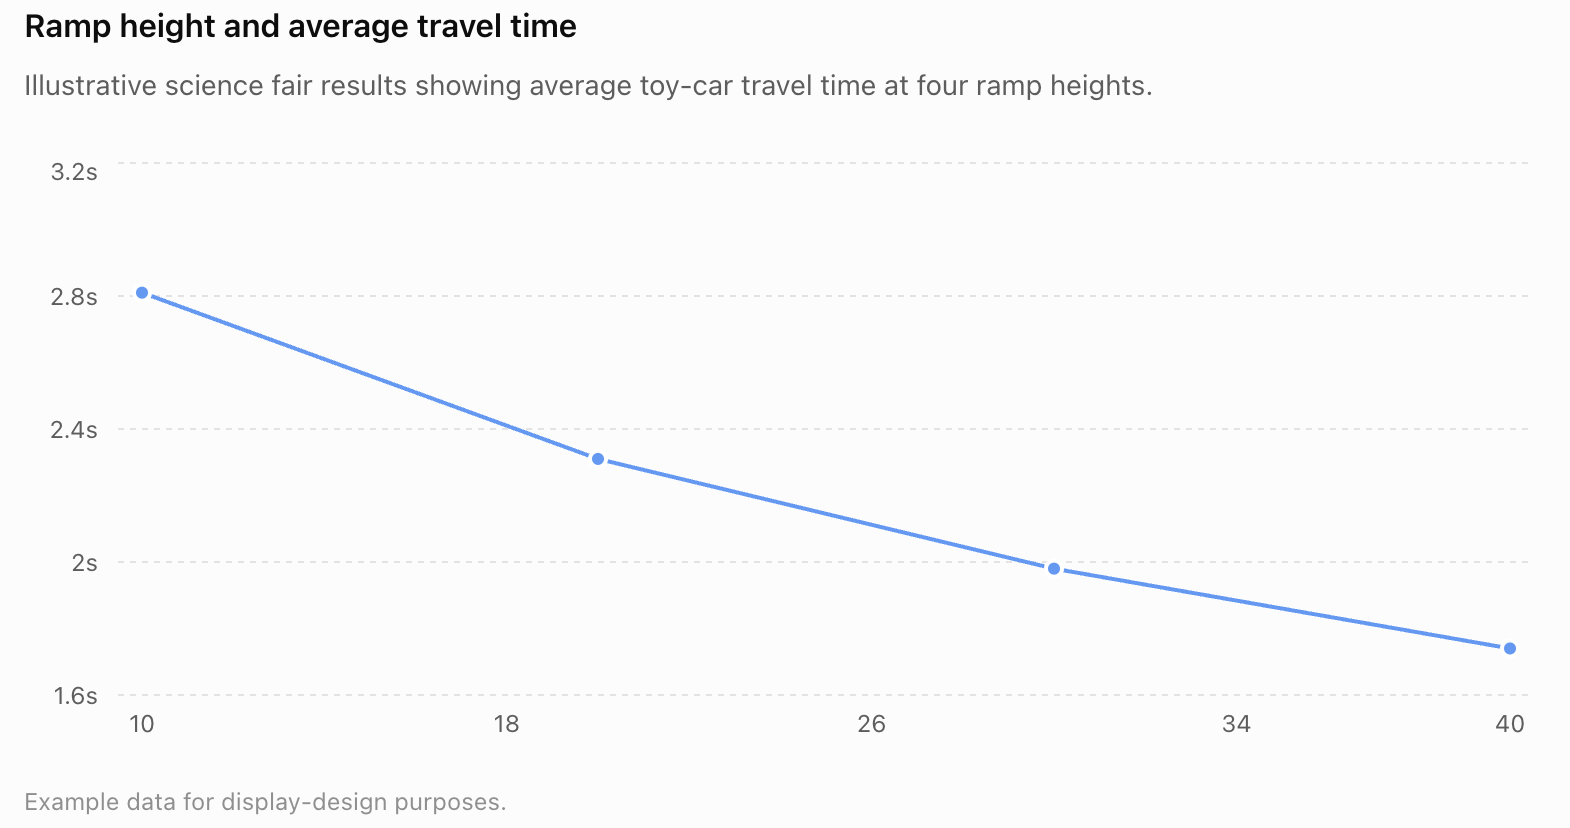
The graph immediately shows a pattern:

As ramp height increased, average travel time decreased.

That pattern is much easier to recognize visually.


Choosing the Right Type of Graph

Different data require different graphs.

Bar Graph

A bar graph is useful when comparing separate categories.

For example:

Insulation material vs temperature decrease

Categories might include:

  • cotton
  • wool
  • bubble wrap
  • aluminium foil

Line Graph

A line graph is useful when the independent variable changes through an ordered or continuous range.

Examples include:

  • temperature
  • time
  • concentration
  • distance
  • ramp height

A line graph can help show trends.


Scatter Plot

A scatter plot is useful when investigating the relationship between two numerical variables.

For example:

pendulum length vs period

The pattern of points may reveal a relationship between the variables.


Pie Chart

Pie charts show how a whole is divided into categories.

They are less commonly appropriate for experimental science data.

Do not choose a pie chart simply because it looks attractive.

Choose the graph that best communicates the scientific evidence.


Graphs Should Be Large Enough to Matter

If the graph contains your most important evidence, do not make it tiny.

The main results graph is often one of the most important visual elements on the entire display.

A visitor should be able to:

  • see the overall trend
  • read the axes
  • understand the variables
  • identify important results

without standing extremely close to the board.

https://images.openai.com/static-rsc-4/njf0P1hjtgKD7uLNb3rxy9CghD33Yxu2dfg_cgtiHjV0waTuNI1OiJFCSdpYVIg9y5SvsY4WWTB8Iro6jr4Yh-xLWIcizD8nfI4a7t-ptjEqQGO5uPf_-kroY1TCe-R4hQyHuMbdaByH02TBduUpMnBzWhKEHglfBp5WcuBPRSoN4JrC90j3sozlC4lItqGQ?purpose=fullsize
 
https://images.openai.com/static-rsc-4/27vLf_i6aerS9xQOcMYqHV7bEXzXx5yw13HY03PKuzCRGsKlX2yDH7u6yVMPsxO3tw69QK_lGOACkzmtPh3-GXrS02sEjbCFvN8ny2rhFKj6Ad4jH_k_mX546KAUF4UzqPLcobsuceBfS6MF9Zqu0kHVGKWSMedIr42rEikqh5bo8-D7YZAKLGxBx37_EUDe?purpose=fullsize
 
https://images.openai.com/static-rsc-4/MiJJ6Cwg4E0HH1ieRcMg3hRJs1SzxfgU7JU2A1XIM9mvpQRblLJuqOjvTDegIo0iZpnMNmHcVjfpFRUpyfDjqnyOiX4xy9xw_H9tuYURA0e8DEwZ8XcZHtbevWhgktpQv8iPd7dzLYVTh1Qthi3B_8I1_v7QgrHdtLqQYb_wa6bLdD-3tSxdoIYnocUPsXgd?purpose=fullsize
 
6

Do Not Decorate Graphs Excessively

A scientific graph is primarily a communication tool.

Avoid unnecessary:

  • 3D effects
  • decorative backgrounds
  • excessive colours
  • clip art
  • unusual fonts
  • distracting patterns

These can make the graph harder to interpret.

A simple, correctly labelled graph is usually more effective.


Explain What the Graph Shows

Do not assume that the graph speaks entirely for itself.

Include a short analysis.

For example:

The average travel time decreased as ramp height increased. The greatest decrease occurred between 10 cm and 20 cm. Overall, the data show a clear relationship between ramp height and travel time.

This tells the reader what pattern they should notice.

Your analysis should describe the evidence before explaining what it means.


Separate Results from Conclusions

These two sections are related but different.

Results

The results section presents:

What happened?

It might contain:

  • tables
  • graphs
  • averages
  • observations
  • photographs

Conclusion

The conclusion answers:

What does the evidence mean?

A conclusion should connect the results back to the research question and hypothesis.

For example:

The results show that increasing ramp height decreased the time required for the toy car to travel 1.0 m. Therefore, increasing ramp height increased the car's average speed. The results support the hypothesis.

This is much stronger than:

My hypothesis was correct.


Include an Evaluation

Good scientists recognize that investigations have limitations.

Your display can include a short evaluation explaining:

  • weaknesses in the method
  • sources of uncertainty
  • anomalous results
  • limitations of the data
  • possible improvements
  • useful future investigations

For example:

A major source of uncertainty was human reaction time when using the stopwatch. Using electronic light gates would improve the precision of the timing measurements.

This demonstrates scientific thinking rather than pretending the investigation was perfect.


Tell the Story with Visuals

Visuals should support the scientific story rather than simply decorate the board.

A useful sequence might be:

Experimental setup photograph

↓

Method diagram

↓

Raw-data table

↓

Main graph

↓

Photograph showing an important result

↓

Conclusion

Each visual contributes something different.

https://images.openai.com/static-rsc-4/nawqH0UR8wfdDzmOFfpLwfDAWo0GpQmSHwLavy1X_xXKiC5bphq_qimBo-2_hLmYBRSXuWjEFGBP-4iKg7l_7la7oiZw7iqhYMz7pONxd41XWFIhEJ5-bLm3dl3YYeqKBzLFpBz6kP9AfL4DKpN7xRpwS_g-Il6mxTaIyE98PZ8popqG2yAKUSzKskABRzRB?purpose=fullsize
 
https://images.openai.com/static-rsc-4/28aZH8-4GBt_b-d1THXQo9c93V6UEYjofpAS7lnZ0YtGxtq2Enj9crP-s1nsGNusWc745FJw8UpyU_Wy-gBcM9JeTezDf3S8uDfQLA19Q7yOVoghpOWNqRpuq7oqnHxpZAldaGgGNRuY9itaJcPKTkLaa9tf82AAWDa0TUTppLaGolqGsDOCItzbCcdXKEmh?purpose=fullsize
 
https://images.openai.com/static-rsc-4/fzz5dwKd-9fEDfig3hc5no2qx3Tdl88J0YBRu_TvN5Bqk0TIglhoLJDdtuYZ4Tqk1ANfQMwnGpk2Gzn03MfLP2L62JSp-OFWcOGL1moG1dvPzngp-nfu-QP9cAa2tX43Q0F0jk1Bn4MRzvcFCyMZjFNMPiQ0bAysKEhXpVCDP_RfYW8RNqu238qPThXhzNdY?purpose=fullsize
 
7

Use Colour Carefully

Colour can improve organization.

For example, you could use consistent visual cues for:

  • headings
  • borders
  • graphs
  • section backgrounds

However, too many competing colours can make a display distracting.

Colour should help the reader understand the structure rather than becoming the main attraction.

Also remember that some viewers may have difficulty distinguishing certain colour combinations. Important information should not depend entirely on colour.


Choose Readable Fonts

Science fair displays should be readable from a reasonable distance.

Avoid:

  • extremely decorative fonts
  • very thin fonts
  • tiny body text
  • using many unrelated fonts

A simple approach is to use:

  • one clear font for headings
  • one clear font for body text

or even the same font family throughout.

Consistency usually looks more professional than variety.


Keep Alignment Consistent

Sections should look intentionally positioned.

For example:

  • align headings consistently
  • keep similar margins
  • use similar spacing between sections
  • make related boxes similar in width
  • keep photographs straight
  • avoid randomly scattered elements

Small alignment differences can make a display feel disorganized even when the scientific content is excellent.


Captions Make Visuals More Useful

Photographs and diagrams should not force viewers to guess what they show.

Instead of simply displaying a photograph of several plants, add a caption:

Figure 1. Bean plants grown under 4, 8 and 12 hours of light per day after 21 days.

A useful caption can identify:

  • what is shown
  • when it was observed
  • experimental conditions
  • why the image matters

Captions turn photographs into scientific evidence.


Include References

Your background information came from other sources.

Your display should acknowledge those sources.

A references section may include:

  • textbooks
  • scientific organizations
  • journal articles
  • educational resources
  • other sources used during the project

The exact citation style may depend on your teacher's requirements.

The references section does not need to dominate the board, but it should be clear and complete enough to identify the sources used.


Example Display Structure

A three-panel board might be organized approximately like this:

LEFT PANEL CENTRE PANEL RIGHT PANEL
Background PROJECT TITLE Analysis
Research Question Hypothesis Conclusion
Variables Method Diagram Evaluation
Background Research Results Table Improvements
References MAIN GRAPH Further Questions

This is not a required layout.

Different projects may need different arrangements.

For example, a project with several important photographs might devote more space to visuals, while a project involving extensive numerical data might devote more space to graphs.

The design should serve the science.


Imagine the Viewer

Before finishing your display, imagine someone who knows nothing about your project.

Ask:

Can they identify my research question?

Can they tell what I changed and measured?

Can they understand what I did?

Can they find my main results?

Can they interpret my graph?

Can they understand my conclusion?

If not, the display probably needs revision.


The Five-Second Test

Stand several steps away from your display and look at it for about five seconds.

Can you immediately identify:

  • the title
  • the research question
  • the main graph or result
  • the major sections

If everything appears equally important, the display may lack visual hierarchy.

Then move closer and check whether the information is easy to follow in sequence.


The One-Minute Test

Now imagine a visitor spends approximately one minute examining the display.

Afterward, could they explain:

what you investigated, what you discovered, and why it matters?

If they can, the display is communicating effectively.

If they remember the decorations but not the scientific result, the design needs improvement.


Attractive Does Not Mean Decorative

A strong science fair display can be attractive because it is:

  • clean
  • balanced
  • organized
  • consistent
  • readable
  • visually interesting

It does not require:

  • glitter
  • flashing lights
  • excessive decoration
  • complicated backgrounds
  • dozens of colours
  • unrelated images

The science should remain the main focus.

https://images.openai.com/static-rsc-4/B1LSYQ-dChx5kCvD0KRCK5jDU2nF1rWNsGml4ZF5Pyzz3SAgJKcNKf56Vy17nrzQBEHrXKcIK9u_JpHt8YL_semGrwJbWhz5fuSqG4HXfsmlBVOA0S3kzCPTzufj094apKBLQgnUwFCjGmiVGmUCELO7gaYP2q_t0XcqjKzsxej6-4FLl3a4j7KI5hVrSJv_?purpose=fullsize
 
https://images.openai.com/static-rsc-4/28aZH8-4GBt_b-d1THXQo9c93V6UEYjofpAS7lnZ0YtGxtq2Enj9crP-s1nsGNusWc745FJw8UpyU_Wy-gBcM9JeTezDf3S8uDfQLA19Q7yOVoghpOWNqRpuq7oqnHxpZAldaGgGNRuY9itaJcPKTkLaa9tf82AAWDa0TUTppLaGolqGsDOCItzbCcdXKEmh?purpose=fullsize
 
https://images.openai.com/static-rsc-4/Rztbx9JhP0r84zDV9TJ95OcjycgyhOzT3NxnBVEep9jrv_QzIofmJ2zikWr72-8Oe1Ji7N9Ibtk0j0FuRFbFGE_n5-s_2hzQ60kYI1Zx-J-AiDEZ4WswdnDU2fnEd0lX_EqISqzmLlEyt1KgJouJjK1crFIdB6eGoym8vP5ZSNZhn8poeLgrq1B-hnuFVR95?purpose=fullsize
 
6

Common Mistakes

Too much text

A science fair display should summarize the investigation rather than reproduce the entire report.

Text that is too small

Important information should be readable without standing extremely close to the display.

Tiny graphs

Graphs are often among the most important pieces of evidence. Give them enough space.

Missing units

Graph axes and tables should include appropriate units.

Decorative graphs

Avoid visual effects that make data more difficult to interpret.

Random organization

Arrange sections so the investigation follows a logical sequence.

Photographs without captions

Explain what important photographs show.

Too many photographs

Choose images that contribute information rather than showing every moment of the project.

Writing "My hypothesis was correct"

A conclusion should discuss what the evidence showed.

Hiding unexpected results

Anomalous or unexpected data are part of the investigation and may deserve discussion.

Making decoration more important than science

The display should attract attention to the investigation, not away from it.

Forgetting references

Information obtained from other sources should be acknowledged appropriately.


Key Terms

Science fair display — A visual presentation communicating the question, methods, evidence, and conclusions of a scientific investigation.

Visual hierarchy — The arrangement of elements so that their relative importance is immediately apparent.

Layout — The arrangement of text, images, graphs, and other elements on a display.

White space — Empty space used to separate elements and reduce visual clutter.

Section heading — A title identifying a particular part of the display.

Graph — A visual representation of numerical data.

Bar graph — A graph using separate bars to compare categories.

Line graph — A graph commonly used to show change or trends across an ordered or continuous variable.

Scatter plot — A graph showing the relationship between two numerical variables.

Axis — A reference line on a graph used to represent a variable and its scale.

Scale — The numerical intervals used along an axis.

Data table — An organized arrangement of measurements or observations.

Diagram — A simplified visual representation used to explain an object, system, process, or experimental setup.

Caption — Short explanatory text accompanying a photograph, diagram, table, or figure.

Figure — A visual element such as a photograph, graph, chart, or diagram used to communicate information.

Results — The measurements and observations produced by an investigation.

Analysis — Examination of data to identify patterns, relationships, differences, and trends.

Conclusion — An evidence-based answer to the research question.

Evaluation — An assessment of the strengths, limitations, uncertainties, and possible improvements of an investigation.

Anomalous result — A result that differs noticeably from the general pattern.

Reference — Information identifying a source used during research.

Readability — How easily text and visual information can be read and understood.

Consistency — Using similar formatting, spacing, fonts, and design choices throughout a display.

Scientific communication — Sharing scientific questions, methods, evidence, explanations, and conclusions clearly with others.


Key Takeaways

  • A science fair display is a visual scientific report.
  • The display should communicate the complete story of your investigation.
  • Organize information in a logical sequence.
  • Make the title clear, large, and specific.
  • Make the research question easy to find.
  • Clearly identify the independent, dependent, and important control variables.
  • Use a strong visual hierarchy.
  • Do not make every piece of information equally prominent.
  • Summarize information rather than placing your entire written report on the board.
  • Use white space to reduce clutter.
  • Use photographs when they provide useful evidence or explain the experimental setup.
  • Add captions to important visuals.
  • Use diagrams when they communicate information more clearly than photographs.
  • Include data tables where useful.
  • Use graphs to make patterns in numerical data easier to recognize.
  • Choose the graph type that matches the data, not the graph that looks most decorative.
  • Label graph axes and include units.
  • Make important graphs large enough to read easily.
  • Results show what happened.
  • Analysis explains patterns in the evidence.
  • Conclusions explain what the evidence means.
  • Evaluations identify limitations and possible improvements.
  • Keep fonts, alignment, spacing, and formatting consistent.
  • Use colour to organize information rather than overwhelm it.
  • Include appropriate references.
  • An attractive scientific display should be clear, balanced, organized, readable, and informative.
  • The scientific investigation—not the decoration—should remain the focus.

A successful visitor should leave your display understanding:

What did you investigate? → What did you do? → What did you find? → What does it mean?


Check Your Understanding

1. What is the main purpose of a science fair display?

2. Why should the project title be specific?

3. Give a logical sequence for presenting the major sections of an investigation.

4. What is visual hierarchy?

5. Why is white space useful?

6. Explain why copying an entire research report onto the display is usually ineffective.

7. What information should appear on the axes of a scientific graph?

8. Which variable normally appears on the x-axis?

9. Which variable normally appears on the y-axis?

10. When would a bar graph be more appropriate than a line graph?

11. Why should photographs have captions?

12. Explain one advantage of using a diagram instead of a photograph to show an experimental setup.

13. What is the difference between a results section and a conclusion?

14. Why should an evaluation be included?

15. Give one example of an experimental limitation and an appropriate improvement.

16. Why should important scientific information not depend entirely on colour?

17. A student has included 25 photographs showing nearly identical stages of an experiment. What would you recommend?

18. A student's main graph occupies only a tiny corner of the display. Explain why this might be a problem.

19. What should a viewer understand after examining a well-designed science fair display?

20. Challenge: Sketch a possible three-panel layout for your own science fair project. Decide where you would place your title, question, hypothesis, variables, method, photographs, results table, main graph, analysis, conclusion, evaluation, and references.