Science Fair Projects
| Site: | Young Education |
| Cours: | Lab Reports and Science Fair |
| Livre: | Science Fair Projects |
| Imprimé par: | Gwestai |
| Date: | lundi, 9 novembre 2026, 16:34 |
1. Choosing a Great Project Topic
Learning outcomes
- I can identify characteristics of a strong science fair project.
- I can select a topic that interests me.
- I can evaluate whether a project is practical and testable.
- I can develop a focused research question.
- I can justify why my investigation is worthwhile.
Choosing a Great Project Topic
A strong science fair project usually begins with something simple: curiosity.
You notice something, wonder why it happens, and think of a way to investigate it.
A successful project does not need expensive equipment or an extremely complicated scientific idea. In fact, some of the strongest investigations begin with ordinary questions about everyday life.
A good science fair project should be:
- interesting to you
- scientific
- testable
- focused
- practical
- safe
- capable of producing measurable data
- worthwhile enough that the results could teach you something


Start with Something That Interests You
You will probably spend several weeks working on your science fair project. Choosing a topic you actually care about makes the process much more enjoyable.
Think about things you enjoy or questions you have wondered about.
Possible starting areas include:
- sports
- food
- plants
- animals
- weather
- water
- motion
- forces
- electricity
- sound
- light
- temperature
- materials
- environmental science
- human behaviour
- engineering
You do not need to know your exact research question immediately.
Start with a general area of interest and gradually make it more specific.
For example:
Sports
↓
Basketball
↓
Basketball bouncing
↓
Effect of temperature on basketball bounce height
↓
How does the temperature of a basketball affect its bounce height?
The final version is much more useful because it can actually be investigated.
From a Topic to a Question
A topic is a general subject.
A research question identifies exactly what you want to investigate.
For example:
Topic: Plants
This is much too broad for an investigation.
We could narrow it to:
Plant growth
Then:
Light and plant growth
Finally:
How does the number of hours of light per day affect the growth of bean plants?
Now we have something that can be tested.


What Makes a Question Testable?
A testable question is one that can be answered by collecting evidence.
Usually, you should be able to:
- change something
- measure something
- control other important factors
- repeat the investigation
- collect numerical or clearly observable data
A very useful question structure is:
How does ______ affect ______?
The first blank is usually the factor you deliberately change.
The second blank is usually what you measure.
For example:
How does ramp height affect the distance travelled by a toy car?
You can change the ramp height and measure the distance travelled.
That makes the question testable.
Variables Help Build Strong Questions
A good experimental question often contains two important variables.
The independent variable is the factor you deliberately change.
The dependent variable is the factor you measure or observe.
Consider:
How does water temperature affect the time required for sugar to dissolve?
Independent variable:
water temperature
Dependent variable:
time required for the sugar to dissolve
Other factors should be kept as similar as possible, such as:
- amount of water
- amount of sugar
- type of sugar
- container
- stirring method
These are control variables.
A strong project topic often makes it easy to identify these variables.
Broad Questions vs Focused Questions
A common problem is choosing a question that is much too broad.
Too broad
How does exercise affect people?
There are many problems here.
What type of exercise?
What does "affect" mean?
Which people?
What will be measured?
Better
How does exercise affect heart rate?
This is an improvement, but it can still be more specific.
More focused
How does two minutes of jumping jacks affect heart rate in students?
Now the investigation has a clearly measurable outcome.
Heart rate can be measured in beats per minute.
The more focused question is much easier to investigate scientifically.
Choose Something You Can Measure
Strong investigations produce data.
Whenever possible, choose something that can be measured with numbers.
You might measure:
- time
- distance
- mass
- temperature
- volume
- speed
- height
- pH
- number of objects
- number of organisms
- percentage
- force
- voltage
- current
For example:
Does fertilizer help plants?
is fairly vague.
A stronger question would be:
How does fertilizer concentration affect the average height of bean plants after 21 days?
Now the student has a clear measurement:
plant height in centimetres


Make Sure the Project Is Practical
A fascinating question is not necessarily a good science fair project.
You also need to be able to complete the investigation.
Before choosing a topic, consider:
Time
Can the investigation be completed before the deadline?
Equipment
Do you have access to the materials and measuring equipment?
Cost
Can you obtain the materials without spending too much money?
Space
Do you have somewhere appropriate to conduct the experiment?
Measurements
Can you actually measure the dependent variable?
Repetition
Can you perform enough trials to produce reliable results?
Safety
Can the investigation be performed without unnecessary risk?
A project that requires six months of plant growth is not practical if you have four weeks to complete it.
Avoid Projects That Depend on Equipment You Cannot Access
Suppose a student asks:
How does radiation affect the mutation rate of bacteria?
Scientifically, this could lead to interesting research.
For an ordinary school science fair, however, it may require:
- specialized biological materials
- controlled laboratory facilities
- radiation equipment
- specialized safety procedures
- appropriate supervision
A simpler project could investigate a related idea without requiring inaccessible equipment.
A good science fair topic fits the resources actually available to you.
Safety Comes First
Some interesting scientific questions are inappropriate for a school investigation because they introduce unnecessary risk.
Projects may require special consideration if they involve:
- dangerous chemicals
- flames or high temperatures
- high voltages
- microorganisms
- sharp equipment
- human participants
- animals
- medicines
- potentially hazardous substances
A project should never require you to place yourself or another person in unnecessary danger.
If you are uncertain about a project, discuss the idea with your teacher before beginning the investigation.


Avoid Simple Demonstrations
A demonstration shows that something happens.
An investigation asks a question and collects evidence to answer it.
For example:
Making a baking soda volcano
is mostly a demonstration.
You already know that combining the substances produces a reaction.
But you could turn the idea into an investigation:
How does the concentration of vinegar affect the volume of carbon dioxide produced when it reacts with a fixed mass of baking soda?
Now you have:
- an independent variable
- a dependent variable
- controlled variables
- measurements
- data to analyze
The project has changed from showing something to investigating something.
Avoid Questions That Can Be Answered with a Quick Search
Consider:
What temperature does water boil at?
This is scientifically meaningful, but the basic answer is already well established and easily found.
A stronger project might ask:
How does dissolved salt concentration affect the boiling temperature of water?
Now there is something to investigate.
You can:
- change salt concentration
- measure boiling temperature
- collect repeated measurements
- graph the results
- look for a relationship
The purpose of your investigation should be to collect evidence, not simply reproduce information from a textbook or website.
Think About the Data Before Choosing the Project
One of the best ways to evaluate a project idea is to imagine the final results table.
Suppose your question is:
How does ramp height affect the speed of a toy car?
You could imagine collecting data such as:
| Ramp height (cm) | Trial 1 (s) | Trial 2 (s) | Trial 3 (s) | Average time (s) |
|---|---|---|---|---|
| 5 | ||||
| 10 | ||||
| 15 | ||||
| 20 |
If you can easily imagine what you will change, what you will measure, and what data you will record, you probably have the beginning of a workable investigation.


Can You Repeat the Experiment?
A single measurement is rarely enough.
Strong investigations include repeated trials.
Suppose you are investigating:
How does ramp height affect the distance travelled by a toy car?
Instead of testing each height once, you might test each height three or five times.
You can then calculate an average.
Repeated trials help you:
- identify unusual results
- reduce the effect of random error
- calculate averages
- judge the consistency of your results
- make your conclusions more reliable
When evaluating a project idea, ask:
Can I realistically repeat this experiment several times?
Good Project Questions
Here are some examples of questions that could potentially become strong investigations:
Physics
How does the height of a ramp affect the speed of a toy car?
How does the length of a pendulum affect its period?
How does the angle of launch affect the range of a projectile?
Chemistry
How does temperature affect the rate at which sugar dissolves?
How does concentration affect the rate of a safe chemical reaction?
How does temperature affect the amount of a substance that dissolves?
Biology
How does light duration affect plant growth?
How does temperature affect seed germination?
How does salinity affect seed germination?
Environmental Science
How does soil type affect water drainage?
How does vegetation cover affect soil erosion?
How does water temperature affect dissolved oxygen?
Engineering
Which bridge design supports the greatest load?
How does blade angle affect the output of a model wind turbine?
How does insulation thickness affect the rate of heat loss?


Questions That Need Improvement
Some project ideas sound interesting but are difficult to investigate scientifically.
"Which music is best?"
The word best is subjective.
Better:
How does music volume affect the time required to complete a concentration task?
"Are plants healthy?"
"Healthy" is difficult to measure precisely.
Better:
How does the amount of water supplied each day affect the height of bean plants after three weeks?
"Which paper airplane is best?"
What does best mean?
Better:
How does wing length affect the distance travelled by a paper airplane?
Now "distance travelled" can be measured.
"Does temperature matter?"
Temperature of what? Matter to what?
Better:
How does water temperature affect the time required for a sugar cube to dissolve?
A Strong Research Question
A strong research question is usually:
specific + testable + measurable + practical
One useful structure is:
How does [independent variable] affect [dependent variable]?
For example:
How does pendulum length affect the time required for 10 complete oscillations?
Independent variable:
pendulum length
Dependent variable:
time for 10 oscillations
Possible controls:
- mass of the pendulum bob
- release angle
- string type
- timing method
This question is focused enough to produce useful experimental evidence.
Is the Investigation Worthwhile?
A good project should have a reason for being investigated.
This does not mean your project must solve a major world problem.
The investigation might be worthwhile because it:
- helps explain an everyday observation
- tests a scientific relationship
- compares materials or designs
- improves the efficiency of something
- investigates an environmental issue
- helps understand a biological process
- tests a possible engineering solution
For example:
How does insulation thickness affect the rate at which hot water cools?
This is scientifically interesting because it investigates heat transfer.
It also has practical importance because insulation is used in:
- buildings
- refrigerators
- drink containers
- clothing
- transportation


Justifying Your Project
You should be able to explain why your investigation is worth doing.
A good justification might include:
- why you chose the topic
- why the question interests you
- what scientific idea it investigates
- how the results might be useful
- what you hope to learn
For example:
Research question:
How does the thickness of insulation affect the cooling rate of hot water?
Possible justification:
This investigation is worthwhile because reducing heat transfer is important in buildings and many everyday products. By testing different thicknesses of insulation, I can investigate how insulation affects heat loss and determine whether increasing thickness significantly improves thermal insulation.
Notice that the justification does more than say:
"I chose this because it seems interesting."
It explains the scientific and practical value of the investigation.
Evaluating a Project Idea
Before committing to a topic, ask yourself:
Interest: Am I genuinely interested in this question?
Testability: Can I answer it using an experiment or systematic investigation?
Variables: Can I identify something to change and something to measure?
Measurement: Can I collect useful data?
Controls: Can I keep other important variables reasonably constant?
Equipment: Do I have the materials I need?
Time: Can I complete the investigation before the deadline?
Repetition: Can I perform several trials?
Safety: Can I perform the investigation safely?
Value: Will the results teach me something meaningful?
If you answer yes to most of these questions, you probably have a promising project.
From Interest to Investigation
A useful process is:
Interest
↓
General topic
↓
Specific idea
↓
Testable question
↓
Identify variables
↓
Check practicality and safety
↓
Decide what data will be collected
↓
Explain why the investigation is worthwhile
↓
Final project question
For example:
Interest: Sports
↓
Topic: Basketball
↓
Idea: Basketball bounce
↓
Question: Does temperature affect bounce?
↓
Focused question: How does basketball temperature affect maximum bounce height when dropped from 1.5 m?
Now the student has a project that can be planned experimentally.
Common Mistakes
Choosing a topic that is too broad
"Plants" is a topic, not a research question.
Narrow the topic until there is something specific to investigate.
Choosing a project because it looks impressive
Complicated does not automatically mean good.
A simple experiment with carefully controlled variables and high-quality measurements can be much stronger than an elaborate experiment with poor data.
Choosing a demonstration instead of an investigation
Ask yourself:
What am I changing?
What am I measuring?
If you cannot answer these questions, you may have a demonstration rather than an investigation.
Using words that cannot be measured
Words such as:
- best
- nicest
- healthiest
- strongest
- better
need to be clearly defined.
Instead of:
Which paper towel is best?
ask:
Which paper towel absorbs the greatest mass of water per gram of paper towel?
Now "best" has been replaced by a measurable quantity.
Choosing something that takes too long
Make sure your investigation can be completed within the available time.
Remember to leave time for:
- repeated trials
- analysis
- graphs
- conclusions
- evaluation
- preparing the final presentation
Forgetting about safety
Never begin an investigation simply because the idea sounds interesting.
Consider the risks first and discuss potentially hazardous procedures with your teacher.
Trying to prove what you already believe
Science is not about designing an experiment to make your preferred answer appear correct.
Your goal is to collect evidence.
Your results may support your prediction, or they may contradict it.
Either outcome can produce a successful scientific investigation.
Key Terms
Science fair project — A scientific investigation conducted to answer a question or solve a problem.
Topic — The general subject area of an investigation.
Research question — The specific question an investigation attempts to answer.
Testable question — A question that can be investigated by collecting scientific evidence.
Focused question — A clearly defined question narrow enough to investigate effectively.
Independent variable — The factor deliberately changed by the investigator.
Dependent variable — The factor measured or observed in response to the independent variable.
Control variable — A factor kept as constant as reasonably possible to make the investigation fair.
Data — Information collected during an investigation.
Quantitative data — Data expressed using numerical measurements.
Qualitative data — Descriptive observations rather than numerical measurements.
Trial — One complete repetition of an experimental procedure.
Repeated trials — Performing an experiment several times to improve confidence in the results.
Fair test — An investigation in which important variables other than the independent variable are controlled.
Practical — Realistic to complete using the available time, equipment, space, skills, and resources.
Feasible — Possible to carry out successfully under the available conditions.
Variable — A factor that can change during an investigation.
Measurement — A numerical observation made using an appropriate instrument or method.
Evidence — Information or data used to support a scientific conclusion.
Investigation — A systematic process used to answer a scientific question.
Demonstration — An activity designed mainly to show a known phenomenon rather than answer a new experimental question.
Justification — An explanation of why a choice or investigation is reasonable or worthwhile.
Reliability — The extent to which repeated measurements or trials produce consistent results.
Key Takeaways
- Strong science fair projects often begin with curiosity.
- Choose a general area that genuinely interests you.
- Gradually narrow a broad topic into a focused research question.
- A good question should be scientific and testable.
- A useful question structure is:
How does [independent variable] affect [dependent variable]?
- Strong projects usually involve something that can be measured or systematically observed.
- Numerical measurements often make results easier to analyze.
- Think about the data you could collect before committing to a project.
- A strong project should be practical with the time, equipment and materials available.
- The investigation should be safe.
- You should be able to perform repeated trials.
- A demonstration is not necessarily an investigation.
- Strong investigations involve collecting evidence to answer a question.
- Avoid vague terms such as best, better, or healthiest unless you define exactly how they will be measured.
- Simple projects can produce excellent science when variables and measurements are carefully controlled.
- Your experiment does not need to support your original prediction to be successful.
- Good science depends on evidence, not getting the answer you expected.
- You should be able to explain why your investigation is worthwhile.
- A strong final project combines:
interest + testability + measurement + practicality + safety + scientific value
Check Your Understanding
1. What is the difference between a general topic and a research question?
2. Why is it useful to choose a science fair topic that interests you?
3. Explain what makes a research question testable.
4. Improve this question:
"Which plant grows best?"
5. Identify the independent and dependent variables:
How does water temperature affect the time required for sugar to dissolve?
6. Why are repeated trials important in a science fair investigation?
7. Explain the difference between a scientific demonstration and a scientific investigation.
8. A student wants to investigate whether different types of music affect plant growth. Name one quantity the student could measure.
9. Why should you think about the data you will collect before choosing your final project?
10. Give two reasons why an interesting scientific question might not be practical for a school science fair.
11. Rewrite this as a focused, measurable research question:
"Are paper airplanes good?"
12. A student wants to investigate whether salt affects seed germination. Suggest an independent variable and a dependent variable.
13. Explain why "Which material is the best insulator?" needs to be made more specific.
14. Give one way that a student could define and measure the performance of an insulating material.
15. What should a student consider when deciding whether an investigation is safe?
16. Explain why a simple investigation can sometimes be stronger than a complicated project.
17. Why is it acceptable for experimental results to disagree with your original prediction?
18. Choose one science topic that interests you and turn it into a testable question using:
How does ______ affect ______?
19. For your question in Question 18, identify the independent and dependent variables.
20. Challenge: Write a short justification explaining why your proposed investigation would be scientifically worthwhile.
2. Research and Background Information
Learning outcomes
- I can locate reliable scientific sources.
- I can summarize scientific information in my own words.
- I can distinguish between reliable and unreliable sources.
- I can use background research to improve my investigation.
- I can cite sources appropriately.


3. Conducting the Investigation
Learning outcomes
- I can follow my experimental procedure carefully.
- I can record observations accurately.
- I can adapt procedures when unexpected problems occur.
- I can maintain safety throughout an investigation.
- I can collect sufficient data for meaningful conclusions.
Conducting the Investigation
Once your research question, hypothesis, variables, materials, and experimental procedure have been planned, it is time to carry out the investigation.
This is where careful scientific work becomes especially important.
A good experimental plan is only useful if it is followed carefully. During the investigation, you need to:
- follow the planned procedure consistently
- measure carefully
- record observations immediately
- repeat measurements when appropriate
- keep control variables as constant as possible
- respond sensibly to unexpected problems
- maintain safety
- collect enough data to answer your research question
The goal is not simply to finish the experiment. The goal is to collect reliable evidence that can be used to reach a meaningful conclusion.


Follow the Procedure Carefully
Your experimental procedure is the step-by-step plan for carrying out your investigation.
For example, a procedure for investigating how ramp height affects the motion of a toy car might include:
- Set the ramp to a height of 10 cm.
- Place the car at the marked release point.
- Release the car without pushing it.
- Measure the time required to travel 1.0 m.
- Record the result.
- Repeat the measurement three times.
- Calculate the average time.
- Increase the ramp height to 20 cm.
- Repeat the procedure.
Following the same method each time helps make the investigation a fair test.
If the car is pushed during one trial but simply released during another, an additional variable has been introduced.
Consistency Matters
Experimental conditions should be kept as consistent as possible.
Suppose you are investigating:
How does ramp height affect the time taken for a toy car to travel 1 m?
The independent variable is:
ramp height
The dependent variable is:
travel time
Important control variables could include:
- same toy car
- same ramp
- same surface
- same travel distance
- same release point
- same timing method
- same person releasing the car
The goal is to make ramp height the main factor changing between trials.


Measure Carefully
Measurements are a major source of scientific evidence.
Depending on the investigation, you might measure:
- time
- distance
- mass
- volume
- temperature
- force
- pH
- plant height
- number of organisms
- gas volume
- electrical current
- voltage
Use equipment appropriate for the measurement.
For example:
- ruler or metre stick → length
- stopwatch → time
- thermometer → temperature
- balance → mass
- measuring cylinder → liquid volume
- gas syringe → gas volume
- force meter → force
Whenever possible, measurements should include the correct unit.
Instead of recording:
Temperature = 25
record:
Temperature = 25 °C
Units give measurements meaning.


Read Instruments Correctly
Using measuring equipment properly improves the quality of your data.
When reading a scale:
- identify the unit
- determine the value of each division
- view the scale from the correct position
- record an appropriate number of digits
For liquid volume in many measuring cylinders, read the scale at eye level and use the appropriate part of the meniscus.
Viewing a scale from above or below can produce a parallax error.
The same principle applies when reading rulers, analogue meters, and other graduated instruments.
Record Data Immediately
Do not rely on memory.
Measurements and observations should be recorded as soon as they are made.
A data table prepared before the investigation can make this much easier.
For example:
| Ramp height (cm) | Trial 1 (s) | Trial 2 (s) | Trial 3 (s) | Average time (s) |
|---|---|---|---|---|
| 10 | ||||
| 20 | ||||
| 30 | ||||
| 40 | ||||
| 50 |
A good data table should clearly show:
- what was changed
- what was measured
- units
- repeated trials
- calculated values when appropriate
Never invent missing measurements simply to complete a table.
Record Observations Too
Not all useful scientific evidence consists of numbers.
Scientists also record qualitative observations.
These might include:
- colour changes
- bubbling
- formation of a precipitate
- changes in appearance
- unusual sounds
- changes in smell when safely observable without deliberately inhaling chemicals
- movement
- unexpected behaviour
- equipment problems
For example, during an acid-carbonate reaction you might record:
Rapid bubbling occurred immediately after the acid was added. The solid gradually became smaller.
These observations can help explain the numerical results.
Quantitative and Qualitative Data
Scientific investigations often produce two types of data.
Quantitative data involve numbers and measurements.
Examples:
- 24.5 °C
- 18.2 cm
- 35.6 s
- 42 mL
Qualitative data describe characteristics or observations.
Examples:
- solution changed from colourless to blue
- bubbles formed rapidly
- plant leaves became yellow
- precipitate appeared
A strong investigation may use both types of evidence.
Use Appropriate Precision
Measurements should reflect the precision of the instrument being used.
For example, if a ruler is marked in millimetres, reporting a measurement as:
12.374829 cm
would suggest a level of precision the ruler cannot provide.
Similarly, if a thermometer reads only to the nearest degree, recording:
24.736 °C
would not be justified.
Record measurements with appropriate precision, and try to use the same level of precision throughout a data set when the same instrument is being used.
Repeat Your Measurements
One measurement may be affected by random variation.
Repeating measurements allows you to see whether the result is consistent.
Suppose three measurements of travel time are:
2.41 s
2.38 s
2.43 s
These results are fairly close together.
You could calculate an average:
Average = (2.41 + 2.38 + 2.43) ÷ 3
Average = 2.41 s
Repeating trials and calculating an average can reduce the influence of random variation.


Look for Anomalous Results
Sometimes one result is very different from the others.
Suppose you record:
Trial 1 = 2.42 s
Trial 2 = 2.39 s
Trial 3 = 5.81 s
The third result appears unusual.
This is called an anomalous result or outlier.
Do not simply delete it because you do not like it.
Instead, ask:
- Was there a timing mistake?
- Was the equipment disturbed?
- Did the car hit something?
- Was the procedure different?
- Is the result repeatable?
The best response may be to perform another trial.
An unusual result can sometimes reveal a real scientific effect, so it should be investigated rather than automatically discarded.
Collect Enough Data
A science fair investigation needs enough evidence to reveal a meaningful pattern.
Suppose you want to investigate how temperature affects dissolving.
Testing only:
20 °C and 80 °C
gives very limited information.
It may be better to investigate several temperatures, such as:
20 °C, 30 °C, 40 °C, 50 °C, 60 °C and 70 °C
and perform several trials at each temperature.
This gives you more information about the relationship between the variables.
However, more data are not automatically better. Measurements should be chosen deliberately and collected carefully.
Range and Intervals
When planning measurements, consider both the range and intervals.
The range is the span of values tested.
For example:
10–50 cm ramp height
The interval is the difference between successive values.
For example:
10, 20, 30, 40, 50 cm
uses intervals of:
10 cm
A useful range and sensible intervals make patterns easier to identify.
Do Not Change Several Variables at Once
Suppose you are investigating:
How does temperature affect dissolving time?
At 20 °C you use:
- 100 mL water
- 5 g sugar
- no stirring
At 60 °C you use:
- 200 mL water
- 10 g sugar
- constant stirring
If the sugar dissolves faster at 60 °C, you cannot tell whether this was caused by:
- temperature
- water volume
- sugar mass
- stirring
Several variables changed at once.
A fair investigation should change the independent variable while controlling other important factors.
Unexpected Problems Are Normal
Real experiments do not always work exactly as planned.
You may discover that:
- a measurement is too difficult to make
- equipment does not work
- the reaction occurs too quickly
- the reaction occurs too slowly
- plants fail to germinate
- measurements vary too much
- your chosen range is inappropriate
- an important control variable was overlooked
This does not automatically mean the experiment has failed.
Scientific investigations often require problem solving and adaptation.
Adapting the Procedure
Suppose your investigation asks:
How does ramp height affect the time taken for a toy car to travel 20 cm?
You discover that the car travels 20 cm so quickly that accurate stopwatch timing is nearly impossible.
You could modify the procedure by increasing the travel distance to:
1.0 m
This may make the timing easier.
However, once you change the procedure, you should use the revised method consistently for the relevant comparable trials.
You should also record the change and explain why it was made.
Good science is transparent.
Do not quietly change the procedure and pretend that nothing changed.
Pilot Tests
A small pilot test can help identify problems before the main investigation begins.
For example, before investigating five different ramp heights with five trials each, you could perform a few preliminary tests.
You might discover:
- the lowest ramp is too shallow for the car to move reliably
- the highest ramp causes the car to leave the track
- the travel distance is too short
- stopwatch timing is difficult
You can then improve the procedure before collecting the main data.
A short pilot investigation can save considerable time later.
Record Changes to Your Method
If the procedure changes, record:
What changed?
Why did it change?
How might the change affect the results?
For example:
Original method: Measure the time for the car to travel 20 cm.
Problem: The travel time was too short to measure reliably with a handheld stopwatch.
Change: Increased the travel distance to 1.0 m.
Reason: Longer travel times reduced the relative effect of human reaction time.
This information can later become part of your evaluation.
Safety Throughout the Investigation
Safety is not something you consider only before starting.
You should continue monitoring risks throughout the investigation.
Before and during practical work:
- follow teacher instructions
- wear appropriate protective equipment
- keep the workspace organized
- handle glassware carefully
- keep liquids away from electrical equipment
- use heat sources appropriately
- clean spills promptly using the correct procedure
- tie back long hair when appropriate
- avoid loose clothing near flames or equipment
- never taste laboratory chemicals
- never deliberately inhale chemicals
- wash hands after appropriate practical activities
- report accidents, spills, breakages, or injuries immediately


Stop if Conditions Become Unsafe
If something unexpected creates a safety risk, stop the investigation.
For example:
- equipment becomes damaged
- electrical equipment gets wet
- glassware cracks
- unexpected fumes appear
- a chemical spills
- equipment becomes dangerously hot
- someone is injured
Do not continue simply because you want to finish collecting data.
Inform the teacher or supervisor and reassess the situation.
Safety takes priority over completing the experiment.
Keep the Workspace Organized
Good organization improves both safety and data quality.
Keep:
- unused equipment away from the working area
- chemicals clearly identified
- containers labelled
- electrical cables organized
- notebooks away from spills
- measuring equipment accessible
- waste in appropriate containers
An organized workspace reduces the chance of accidentally:
- mixing samples
- recording the wrong measurement
- knocking over equipment
- contaminating materials
- creating hazards
Label Your Samples
If your investigation uses several samples, label them clearly.
Suppose you are investigating plant growth at different salt concentrations.
You might label containers:
0% salt
0.5% salt
1.0% salt
1.5% salt
2.0% salt
Without clear labels, samples can easily become mixed up.
Never rely on remembering which container is which.


Record Data Honestly
Scientific integrity means recording what actually happened.
Do not change a measurement because it does not fit the expected pattern.
Do not invent a result because a trial was missed.
Do not remove unusual values simply to make a graph look better.
Suppose you predicted that increasing temperature would always decrease dissolving time, but one measurement does not fit the trend.
Record it.
Then investigate possible explanations.
Science depends on accurate and honest evidence.
Keep Raw Data
Raw data are the original measurements and observations collected during the investigation.
For example:
| Temperature (°C) | Trial 1 (s) | Trial 2 (s) | Trial 3 (s) |
|---|---|---|---|
| 20 | 92.4 | 89.7 | 94.1 |
| 30 | 71.8 | 73.2 | 70.9 |
| 40 | 55.6 | 54.2 | 56.1 |
These original measurements should be kept even if you later calculate:
- averages
- percentages
- rates
- differences
- other processed values
Raw data allow you and others to see what was actually measured.
Record Enough Detail
Your notes should contain enough information that you can understand what happened later.
Useful information may include:
- date and time
- measurement values
- units
- equipment used
- environmental conditions
- observations
- unusual events
- changes to the method
- failed trials
- safety issues
This record is sometimes called a laboratory notebook or research log.


Reliability and Repeated Trials
Reliability describes the consistency of measurements or results.
If repeated measurements are similar, confidence in the result generally increases.
Consider two sets of results.
Set A
4.2 s
4.3 s
4.1 s
These results are quite consistent.
Set B
2.1 s
7.8 s
4.4 s
These results show much greater variation.
Set B may require investigation.
Possible causes include:
- inconsistent technique
- uncontrolled variables
- measurement error
- equipment problems
- natural variation
Repeated trials help reveal these problems.
Accuracy, Precision and Reliability
These terms are related but have different meanings.
Accuracy describes how close a measurement is to the true or accepted value.
Precision describes how closely repeated measurements agree with each other or the resolution with which measurements are reported, depending on context.
Reliability describes the consistency or dependability of the results across repeated measurements or trials.
Imagine arrows being fired at a target.
A tight cluster away from the centre can be precise but inaccurate.
A scattered group around the centre may have a reasonable average but poor precision.
Good experimental technique aims for measurements that are as accurate, precise, and reliable as reasonably possible.
Know When You Have Enough Data
There is no single number of trials that is correct for every experiment.
The amount of data required depends on:
- the research question
- natural variation
- measurement uncertainty
- available time
- experimental design
- number of independent-variable values
- type of analysis
For a simple school investigation, three repeated measurements at each condition are often a useful starting point, but some investigations require more.
Ask:
Do I have enough evidence to identify a pattern and answer my research question reasonably?
That is more important than simply reaching a predetermined number of measurements.
Example Investigation
Consider:
How does salt concentration affect bean seed germination?
A student prepares solutions containing:
- 0% salt
- 0.5% salt
- 1.0% salt
- 1.5% salt
- 2.0% salt
Each treatment uses several seeds.
The student controls:
- type of seed
- number of seeds
- volume of solution
- temperature
- light conditions
- container type
- investigation duration
Every day, the student records:
- number of seeds germinated
- visible changes
- unusual observations
At the end, the student calculates the percentage germination for each concentration.
This produces much stronger evidence than using only one seed at each concentration.
From Investigation to Conclusion
The investigation produces the evidence that will eventually support your conclusion.
The overall process is:
Research question
↓
Hypothesis
↓
Variables
↓
Procedure
↓
Careful measurements and observations
↓
Repeated trials
↓
Recorded raw data
↓
Data analysis
↓
Patterns and relationships
↓
Conclusion
If the experimental data are poor, the conclusion will also be weak.
This is why careful data collection is one of the most important stages of the entire scientific investigation.
Common Mistakes
Relying on memory
Record measurements immediately.
Even a small delay can lead to confusion or forgotten details.
Changing the procedure between trials
If the method changes unnecessarily, the trials may no longer be directly comparable.
Recording numbers without units
35 is incomplete.
35 cm communicates an actual measurement.
Performing only one trial
One measurement provides little information about variation or reliability.
Deleting results that do not fit the hypothesis
Unexpected results must be investigated, not hidden.
Changing several variables simultaneously
This makes it difficult to determine which variable caused the observed effect.
Quietly changing the procedure
If a method needs to be modified, record and explain the change.
Using too narrow a range
Testing only two very similar values may make a relationship difficult to detect.
Using unrealistic precision
Do not report more decimal places than your equipment can reasonably measure.
Ignoring qualitative observations
Numbers are important, but observations can provide valuable additional evidence.
Continuing when something becomes unsafe
Stop the procedure and seek appropriate assistance.
Inventing missing data
Missing data should remain missing or the trial should be repeated when appropriate.
Never manufacture results.
Key Terms
Investigation — A systematic scientific process used to answer a question by collecting and analyzing evidence.
Experimental procedure — The step-by-step method followed during an investigation.
Independent variable — The factor deliberately changed.
Dependent variable — The factor measured or observed.
Control variable — A factor kept as constant as reasonably possible.
Fair test — An investigation in which important variables other than the independent variable are controlled.
Measurement — A numerical value obtained using an appropriate measuring method or instrument.
Observation — Information noticed and recorded during an investigation.
Quantitative data — Numerical measurements or counts.
Qualitative data — Descriptive observations.
Raw data — Original measurements and observations before processing or calculation.
Data table — An organized arrangement used to record and display data.
Trial — One complete performance of an experimental condition or procedure.
Repeated trial — Repetition of a measurement or experimental condition.
Average — A representative value calculated from several measurements, commonly the arithmetic mean.
Anomalous result — A result noticeably different from the general pattern or other repeated measurements.
Outlier — A data value that differs substantially from most other values in a data set.
Reliability — The consistency or dependability of repeated results.
Accuracy — How close a measurement is to the true or accepted value.
Precision — How closely repeated measurements agree, or the degree of detail with which a measurement can be reported.
Range — The span of independent-variable values investigated.
Interval — The difference between successive values used in an investigation.
Pilot test — A small preliminary investigation used to identify problems before the main experiment.
Parallax error — A reading error caused by viewing a measurement scale from an incorrect angle.
Laboratory notebook — A record of experimental procedures, measurements, observations, problems, and changes.
Experimental evidence — Measurements and observations used to answer a scientific question.
Scientific integrity — Honest and responsible collection, recording, analysis, and reporting of scientific information.
Key Takeaways
- Follow your experimental procedure carefully and consistently.
- Change the independent variable deliberately.
- Measure the dependent variable carefully.
- Keep important control variables as constant as reasonably possible.
- Use appropriate measuring equipment.
- Always record appropriate units.
- Record measurements immediately.
- Record both quantitative and useful qualitative observations.
- Prepare data tables before practical work when possible.
- Repeat measurements to investigate variation and improve confidence in the results.
- Do not automatically remove anomalous results.
- Investigate unusual results and repeat measurements when appropriate.
- Use a suitable range and interval of independent-variable values.
- Collect enough data to reveal meaningful patterns.
- Use a pilot test when it can help identify problems with the planned procedure.
- Unexpected problems are a normal part of experimental science.
- Procedures can be adapted when necessary, but changes should be recorded and justified.
- Keep your experimental conditions consistent after making an appropriate change.
- Maintain safety throughout the entire investigation.
- Stop if unexpected conditions make the investigation unsafe.
- Keep samples clearly labelled and the workspace organized.
- Keep your original raw data.
- Never invent, alter, or hide results to make them agree with your hypothesis.
- Good conclusions depend on good evidence.
- The purpose of conducting an investigation is not to prove your prediction correct.
The purpose is to collect accurate, honest, and sufficient evidence to answer your research question.
Check Your Understanding
1. Why is it important to follow the same experimental procedure during repeated trials?
2. What is the difference between quantitative and qualitative data?
3. Why should measurements be recorded immediately?
4. Explain why units must be included with measurements.
5. Give three examples of control variables in a toy-car ramp investigation.
6. Why are repeated trials useful?
7. What is an anomalous result?
8. A student records three times:
3.21 s, 3.18 s, 8.74 s
What should the student do about the third result?
9. Explain why the student should not simply delete the 8.74 s measurement.
10. What is a pilot test, and why might it be useful?
11. A reaction occurs too quickly to measure accurately. Give one appropriate way the procedure might be adapted.
12. Why should changes to an experimental procedure be recorded?
13. Explain the difference between raw data and processed data.
14. Why is changing several variables at the same time a problem?
15. A student is investigating temperature but changes both temperature and the amount of water between trials. Explain why this makes the results difficult to interpret.
16. Why should an experiment be stopped if unexpected conditions make it unsafe?
17. Explain why more data are not automatically better data.
18. What is scientific integrity?
19. Why is it scientifically acceptable for your results to disagree with your hypothesis?
20. Challenge: During an investigation, you discover that your original method produces highly inconsistent measurements. Explain how you would respond while maintaining the quality, transparency, and safety of the investigation.
4. Designing a Science Fair Display
Learning outcomes
- I can organize information into a clear display.
- I can design effective graphs, diagrams, and visuals.
- I can communicate scientific ideas clearly.
- I can present information in a logical sequence.
- I can create an attractive and informative display.
Designing a Science Fair Display
A science fair display is more than decoration. It is a visual scientific report that allows someone to understand your investigation without reading a long research paper or listening to your entire presentation.
A strong display should quickly answer several questions:
- What did you investigate?
- Why did you investigate it?
- What did you predict?
- How did you conduct the investigation?
- What data did you collect?
- What patterns did you find?
- What did you conclude?
- How reliable were your results?
The best displays combine clear scientific information, logical organization, effective visuals, and an attractive design.


The Purpose of the Display
Your display should communicate the story of your investigation.
A visitor should be able to begin at the title, move through the investigation, examine your evidence, and finish with your conclusion.
A useful overall sequence is:
Question → Background → Hypothesis → Method → Results → Analysis → Conclusion → Evaluation
This follows the same general order in which the scientific investigation developed.
The display should not force the reader to guess where to look next.
Start with a Clear Title
Your title is usually one of the first things visitors notice.
It should be:
- large
- easy to read
- relevant to the investigation
- reasonably short
A title can be straightforward.
For example:
How Temperature Affects Sugar Dissolving Rate
or:
The Effect of Ramp Height on Toy-Car Speed
A title such as:
My Science Fair Project
does not tell the reader what the investigation was actually about.
Your title should immediately communicate the main scientific idea.
Organize Information Logically
A science fair board is often divided into sections.
A possible organization is:
Left section
- Background Information
- Research Question
- Hypothesis
- Variables
Centre section
- Title
- Method
- Photographs or diagrams
- Results
- Main graph
Right section
- Analysis
- Conclusion
- Evaluation
- Improvements
- References
This is only one possible arrangement.
The important idea is that the sections should follow a logical sequence.
A reader should not have to jump randomly from one side of the board to another.
Create a Visual Hierarchy
Not every piece of information should look equally important.
A visual hierarchy guides the reader toward the most important information first.
Usually:
Title — largest text
Section headings — large and clearly visible
Body text — smaller but easy to read
Graph and diagram labels — large enough to read comfortably
Important results or conclusions can also be emphasized.
This helps the viewer understand the structure of the display before reading every word.
Avoid Too Much Text
One of the most common science fair display problems is trying to place the entire written report on the board.
A display is not supposed to be a wall of paragraphs.
Instead of this:
The experiment was conducted using five different ramp heights and each height was tested three times in order to obtain sufficient data. The car was released from exactly the same location during each trial and the time required for the car to travel one metre was measured...
A display could communicate the same information more efficiently:
Method
- Tested 5 ramp heights
- Used the same toy car and ramp
- Released car from the same point
- Measured travel time over 1.0 m
- Completed 3 trials at each height
- Calculated the average time
The second version is easier to scan quickly.
Use White Space
You do not need to fill every centimetre of the display.
Empty space between sections is called white space or negative space.
White space helps:
- separate sections
- reduce visual clutter
- make text easier to read
- draw attention to important information
- make the display look more organized
A board packed from edge to edge can make excellent scientific work look confusing.
A good rule is:
Do not ask, "How can I fill this space?"
Ask:
"Does this information help communicate my investigation?"
Make the Research Question Easy to Find
Your research question is one of the most important parts of the display.
For example:
How does the height of a ramp affect the average speed of a toy car?
Someone viewing the display should be able to find the question almost immediately.
The rest of the display should connect directly back to this question.
Your:
- hypothesis
- variables
- method
- data
- graph
- conclusion
should all relate to answering it.
Include the Variables
Clearly identify:
Independent variable — what you deliberately changed
Dependent variable — what you measured
Control variables — important factors kept constant
For example:
Independent variable: Ramp height
Dependent variable: Travel time
Control variables:
- same toy car
- same ramp
- same surface
- same travel distance
- same release point
This helps the viewer understand how the investigation was designed as a fair test.
Use Photographs Effectively
Photographs can be very useful when they actually communicate something about the investigation.
Useful photographs might show:
- experimental setup
- measuring equipment
- different experimental conditions
- samples being tested
- changes observed during the investigation
- final products or results


A photograph should have a purpose.
Instead of including ten nearly identical photographs of a plant, you might include:
- initial plant condition
- experimental setup
- comparison between treatments
- final plant condition
A short caption can explain what each photograph shows.
For example:
Bean seedlings after 14 days under different light conditions.
Use Diagrams When Photographs Are Not Enough
Sometimes a diagram communicates an experimental setup better than a photograph.
A photograph may contain distracting background objects or make equipment difficult to identify.
A simple experimental diagram can clearly show:
- equipment arrangement
- direction of movement
- distances
- measurement locations
- important components
For example, a ramp experiment diagram might show:
release point → ramp → start line → 1.0 m measurement zone → finish line
Diagrams should be:
- simple
- clearly labelled
- large enough to read
- scientifically accurate
Do not add decorative details that make the scientific information harder to understand.
Tables Show the Actual Data
A results table allows viewers to see the measurements you collected.
For example:
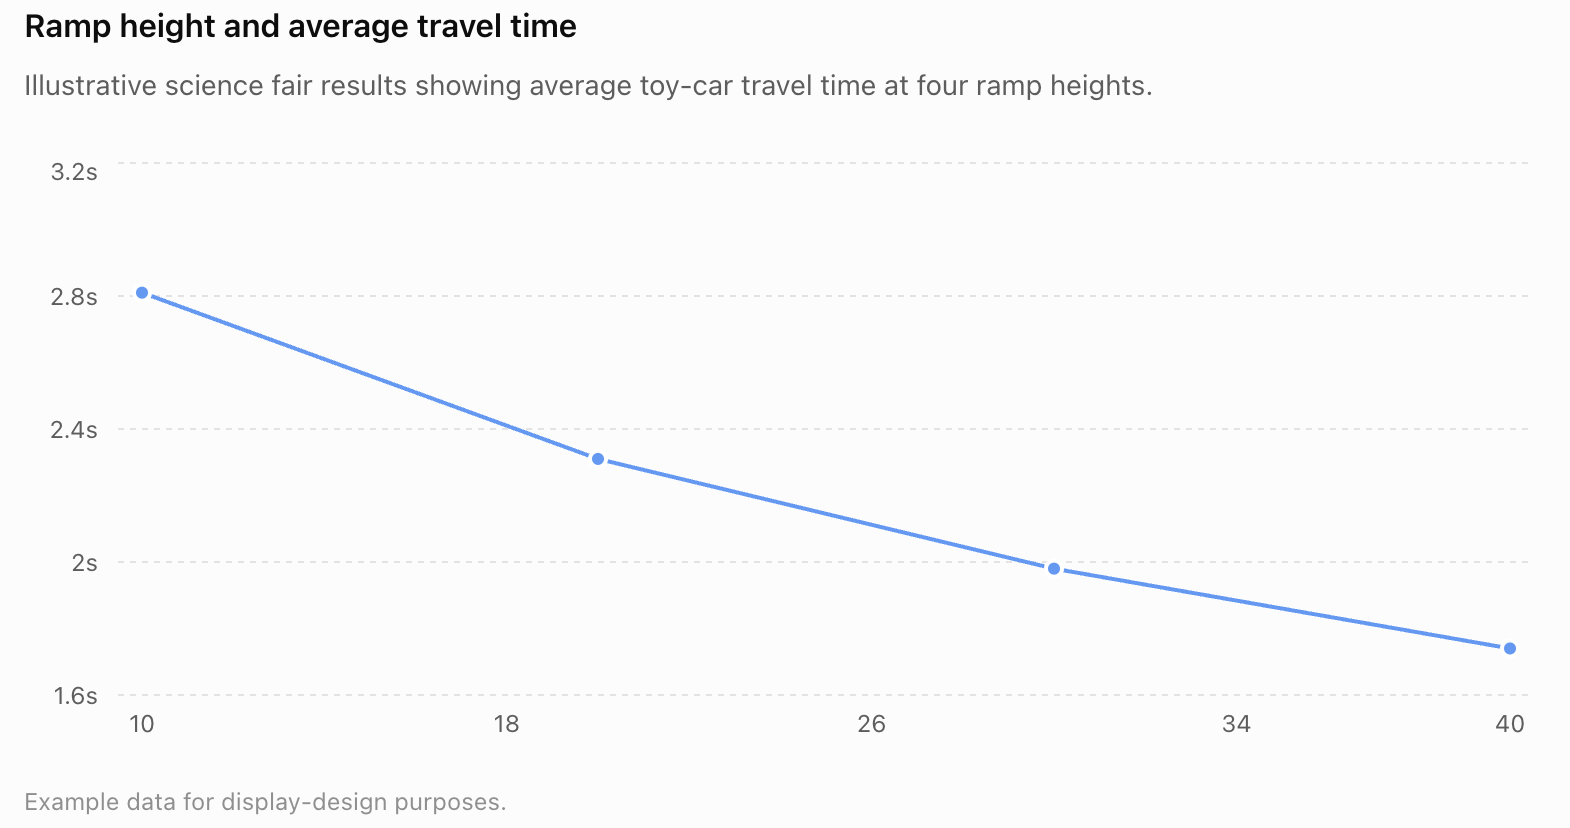
| Ramp height (cm) | Trial 1 (s) | Trial 2 (s) | Trial 3 (s) | Average time (s) |
|---|---|---|---|---|
| 10 | 2.84 | 2.79 | 2.81 | 2.81 |
| 20 | 2.31 | 2.28 | 2.33 | 2.31 |
| 30 | 1.97 | 2.01 | 1.95 | 1.98 |
| 40 | 1.76 | 1.72 | 1.75 | 1.74 |
A good table should include:
- descriptive headings
- units
- consistent decimal places when appropriate
- clearly organized values
However, tables are not always the easiest way to see a pattern.
That is where graphs become especially useful.
Graphs Tell the Story of Your Data
A good graph can communicate an important result in seconds.
Suppose the ramp investigation produced the example data above.
A graph makes the relationship between ramp height and travel time much easier to see than the table alone.
When designing a graph, include:
- a descriptive title
- clearly labelled axes
- units
- appropriate scales
- accurately plotted data
- a suitable graph type
The independent variable normally goes on the horizontal x-axis.
The dependent variable normally goes on the vertical y-axis.


5. Presenting to Judges
Learning outcomes
- I can explain my investigation confidently.
- I can answer questions using scientific evidence.
- I can summarize my results clearly.
- I can justify my conclusions.
- I can reflect on feedback to improve future investigations.
Presenting to Judges
A science fair presentation is your opportunity to explain the story of your investigation.
Your display board provides the visual information, but you provide the explanation. Judges want to understand what you investigated, why you chose the question, how you conducted the experiment, what your evidence showed, and what you learned.
You do not need to memorize a long speech or use complicated scientific vocabulary. A strong presentation shows that you understand your own investigation and can explain it clearly.
A useful goal is:
Know your project well enough that you can explain it naturally rather than simply reciting it.
What Are Judges Looking For?
Judges are usually interested in more than whether your experiment produced an impressive result.
They may want to know whether you understand:
- your research question
- the science behind the investigation
- your hypothesis
- your variables
- your experimental procedure
- your data
- patterns in your results
- limitations of the investigation
- your conclusion
- possible improvements
They may also want to see whether you can use evidence to support what you say.
If your results did not support your hypothesis, that does not make your investigation a failure.
Good science depends on evidence, not on getting the result you originally expected.
Prepare a Short Project Summary
You should be able to summarize your entire project in a few minutes.
A useful structure is:
Question → Reason → Hypothesis → Method → Results → Conclusion → Evaluation
For example:
Question
"I investigated how water temperature affects the time required for sugar to dissolve."
Reason
"I chose this because temperature affects particle motion, and I wanted to investigate how that influences dissolving."
Hypothesis
"I predicted that sugar would dissolve faster at higher temperatures."
Method
"I tested five water temperatures. I used the same volume of water and mass of sugar for every trial and completed three trials at each temperature."
Results
"The dissolving time generally decreased as temperature increased."
Conclusion
"The results supported my hypothesis. Higher water temperatures were associated with shorter dissolving times."
Evaluation
"One limitation was keeping the stirring rate exactly constant. A mechanical stirring system could improve the investigation."
That provides the judge with the complete story without explaining every small detail.
Start with the Research Question
Your research question provides a natural starting point.
Instead of beginning with:
"So, um, this is my project..."
you can begin directly:
"My investigation examined how the concentration of salt in water affects the germination of bean seeds."
The judge immediately knows what the project is about.
Then briefly explain why you chose the question.
For example:
"I was interested in this because salt can accumulate in soils, and I wanted to investigate whether increasing salinity would affect seed germination."
This connects the investigation to a larger scientific idea.


Explain the Science Behind the Project
Judges may ask about your background research.
You should understand the scientific ideas connected to your investigation.
For example, if your investigation concerns:
temperature and dissolving
you should understand ideas such as:
- particles
- kinetic energy
- solute
- solvent
- solution
- dissolving
- temperature
If your investigation concerns:
light and plant growth
you should understand ideas such as:
- photosynthesis
- light energy
- glucose
- chlorophyll
- limiting factors
- plant growth
You do not need to explain every scientific fact you researched. Focus on the science that helps the judge understand why your investigation makes sense.
Explain Your Hypothesis
Tell the judge what you predicted and, more importantly, why.
Weak explanation:
"I thought the hotter water would work better."
Stronger explanation:
"I predicted that increasing water temperature would decrease dissolving time because particles have greater average kinetic energy at higher temperatures."
The second response shows scientific reasoning.
A hypothesis should connect:
prediction + scientific explanation
Explain Your Variables
Be prepared to identify the variables in your investigation.
For example:
Research question: How does ramp height affect the time required for a toy car to travel 1.0 m?
Independent variable: Ramp height
Dependent variable: Travel time
Control variables:
- same car
- same ramp
- same surface
- same release point
- same travel distance
- same timing method
A judge might ask:
"Why did you keep the same car?"
A strong response would be:
"Different cars could have different masses, wheels, friction, or rolling resistance. Keeping the same car helped ensure that ramp height was the main variable being changed."
That demonstrates understanding of fair testing.
Explain the Method Without Reading It
You do not usually need to read every numbered step from your display.
Instead, summarize the important parts.
For example:
"I tested five ramp heights from 10 cm to 50 cm. At each height, I released the same car from the same position and measured the time required to travel one metre. I repeated each condition three times and calculated the average."
This tells the judge:
- what was changed
- what was measured
- what was controlled
- how many trials were performed
- how the data were processed
That is usually much more useful than reading a long procedure aloud.
Use Your Display as a Visual Aid
Your display board should support your presentation.
You can point to:
- your research question
- experimental photographs
- diagrams
- data tables
- graphs
- conclusion
For example:
"This photograph shows the experimental setup."
Then:
"This graph shows the main pattern in my results."
The board helps the judge follow your explanation.
However, avoid turning your back to the judge and reading directly from the display.
The board should support you, not replace you.


Focus on Your Results
Your results are one of the most important parts of the presentation.
Do not simply say:
"Here is my graph."
Explain what the graph shows.
For example:
"The graph shows that dissolving time generally decreased as water temperature increased. At the lowest temperature, the average dissolving time was greatest, while the highest temperature produced the shortest average dissolving time."
You are identifying a trend.
Depending on the investigation, you might discuss:
- increases
- decreases
- maximum values
- minimum values
- similarities
- differences
- relationships
- unusual results
- patterns
Use Numbers When They Help
Scientific evidence becomes stronger when you refer to actual measurements.
Instead of:
"The plants with more light grew much more."
you might say:
"The plants receiving 12 hours of light per day had a greater average height than the plants receiving four hours per day."
If appropriate, include important numerical values.
For example:
"Average height increased from 8.4 cm in the four-hour treatment to 14.7 cm in the twelve-hour treatment."
You do not need to memorize every value in your data table.
Know the most important results.
Evidence, Not Opinion
Judges may ask:
"Why do you think that?"
Your answer should refer to scientific evidence whenever possible.
For example:
Question: "Why did you conclude that increasing ramp height increased the car's speed?"
Weak answer:
"Because that's what I thought would happen."
Stronger answer:
"The average travel time decreased as ramp height increased. Since the car travelled the same distance in less time, its average speed increased."
The stronger answer uses the collected evidence and scientific reasoning.
A useful response structure is:
Claim → Evidence → Scientific reasoning
Claim, Evidence, Reasoning
This structure can help you answer many questions.
Claim
State what you think the evidence shows.
Increasing water temperature decreased dissolving time.
Evidence
Refer to your results.
The higher-temperature trials consistently produced shorter average dissolving times.
Reasoning
Connect the evidence to scientific knowledge.
At higher temperatures, particles have greater average kinetic energy and move more rapidly, increasing interactions between the solvent and solute.
Together:
Claim + Evidence + Reasoning
creates a strong scientific explanation.
Justify Your Conclusion
Your conclusion should answer the research question.
Suppose your question was:
How does salt concentration affect bean seed germination?
A useful conclusion might be:
"The percentage of seeds that germinated decreased as salt concentration increased. Therefore, under the conditions tested, higher salt concentrations reduced bean seed germination."
Notice the phrase:
"under the conditions tested"
Scientific conclusions should usually stay within the limits of the evidence.
You tested particular:
- concentrations
- seeds
- temperatures
- times
- conditions
Your experiment does not necessarily prove what happens under every possible condition.
Avoid Overstating Your Results
Suppose you tested 30 bean seeds.
You should not conclude:
"Salt prevents all plants from growing."
That conclusion goes far beyond your evidence.
A more appropriate conclusion might be:
"Increasing salt concentration reduced the percentage germination of bean seeds under the conditions tested."
Good scientific communication distinguishes between:
what your evidence supports
and
what might be possible but has not been demonstrated.
Be Ready to Discuss Anomalous Results
A judge may notice an unusual data point.
Do not try to hide it.
Suppose most of your measurements were:
22.1 s, 21.8 s, 22.4 s
but one was:
35.7 s
A judge might ask:
"Why is this value so different?"
You could answer:
"That result was anomalous compared with the repeated measurements. I cannot be certain why it occurred, but possible causes include a timing error or an inconsistency in the procedure. Additional trials would help determine whether it represented experimental error or real variation."
That is a scientifically responsible answer.
It Is Fine to Say "I Don't Know"
Judges may ask a question you cannot answer.
Do not invent an explanation.
Instead, you might say:
"I don't know, but that would be interesting to investigate."
or:
"My data don't allow me to answer that question confidently."
or:
"I did not control that variable, so I can't determine its effect from this investigation."
Recognizing the limits of your evidence is a sign of scientific understanding.
Listen Carefully to the Question
Sometimes students become nervous and answer a different question from the one the judge asked.
When a judge asks something:
- Listen to the complete question.
- Think briefly.
- Answer the question directly.
- Explain your reasoning.
- Refer to evidence when appropriate.
It is perfectly acceptable to take a moment to think before answering.
If you do not understand the question, ask:
"Could you please repeat or rephrase the question?"
That is better than guessing what the judge meant.


Common Questions Judges May Ask
You should be prepared for questions such as:
Why did you choose this topic?
Explain your interest and the scientific reason the question is worth investigating.
What was your hypothesis?
State the prediction and scientific reasoning.
What was your independent variable?
Identify what you deliberately changed.
What was your dependent variable?
Identify what you measured.
How did you make your experiment a fair test?
Discuss control variables.
Why did you repeat your trials?
Explain that repeated trials help investigate variation and improve confidence in the results.
What was the most important result?
Identify the major pattern and support it with evidence.
Did your results support your hypothesis?
Answer based on the data.
Were there any anomalous results?
Identify them and explain how you handled them.
What was the biggest limitation?
Identify a genuine weakness in the investigation.
How would you improve the experiment?
Suggest a specific improvement connected to a limitation.
What would you investigate next?
Suggest a logical extension of the project.
Practice Explaining Your Graph
Judges often focus on graphs because graphs summarize the evidence.
You should be able to explain:
- what the x-axis represents
- what the y-axis represents
- the overall pattern
- important values
- unusual results
- what the pattern suggests
For example:
"The x-axis shows salt concentration and the y-axis shows percentage germination. The overall pattern is downward. As salt concentration increased, germination generally decreased."
Then connect that observation to the conclusion.
Explain Limitations
Every investigation has limitations.
A limitation is not simply:
"I made mistakes."
Instead, identify something specific that could have affected the quality of the evidence.
Examples include:
- small sample size
- human reaction time
- limited measuring precision
- uncontrolled temperature
- natural biological variation
- limited range of values
- inconsistent lighting
- difficulty keeping stirring rate constant
For example:
"One limitation was using a handheld stopwatch. Human reaction time introduced uncertainty into the timing measurements."
That identifies a specific issue.
Suggest Specific Improvements
An improvement should address a limitation.
Limitation
Human reaction time affected stopwatch measurements.
Weak improvement
"Be more careful."
Stronger improvement
"Use electronic light gates to measure travel time automatically."
Another example:
Limitation
Only five seeds were used in each treatment.
Improvement
"Increase the sample size to 20 or more seeds per treatment to reduce the influence of natural variation."
A strong improvement explains how the investigation could produce better evidence.
Confidence Does Not Mean Pretending to Know Everything
Presenting confidently does not mean:
- speaking extremely loudly
- memorizing every sentence
- pretending the experiment was perfect
- refusing to admit uncertainty
- using unnecessarily complicated vocabulary
Scientific confidence means being able to say:
This is what I investigated.
This is what I did.
This is what my evidence showed.
This is what I concluded.
These are the limitations of my investigation.
This is what I would improve.
That demonstrates genuine understanding.
Body Language and Communication
How you communicate can help your audience understand you.
Try to:
- face the judge
- speak clearly
- use an appropriate volume
- avoid speaking too quickly
- point to your display when useful
- pause between important ideas
- listen carefully to questions
You do not need to stand completely still.
Natural gestures and movement are fine when they support your explanation.


Avoid Reading a Script Word for Word
A fully memorized speech can become difficult if you forget one sentence.
Instead, remember the structure of your explanation.
For example:
Question
↓
Why I chose it
↓
Hypothesis
↓
Method
↓
Main results
↓
Conclusion
↓
Limitations and improvements
This allows you to speak more naturally.
Your display can help remind you what comes next.
Practice Before the Science Fair
Practice is one of the best ways to improve your presentation.
Try presenting to:
- a classmate
- a friend
- a family member
- your teacher
- yourself
Ask them to interrupt with questions.
This helps you practise moving between:
prepared explanation
and
unplanned questions.
You can also time your presentation so that your introduction does not become unnecessarily long.
Practice Difficult Questions
Do not practise only the questions you hope judges will ask.
Also practise questions such as:
What was wrong with your experiment?
What would you change?
Why should I trust your results?
How do you know your conclusion is supported?
What other explanation could there be?
What surprised you?
What would happen if you extended the range?
You may not know the exact answers in advance, but practising scientific reasoning makes these questions easier to handle.
What If the Hypothesis Was Not Supported?
Suppose you predicted:
Increasing light duration will increase plant growth.
But your results showed no clear relationship.
Do not say:
"My experiment failed."
Instead explain:
"The results did not provide clear evidence supporting my hypothesis. Plant growth varied between the treatments, but there was no consistent relationship with light duration."
Then consider why.
Possibilities might include:
- insufficient investigation time
- natural biological variation
- small sample size
- uncontrolled temperature
- limited light differences
- measurement uncertainty
An unsupported hypothesis can still produce an excellent scientific investigation.
Separate Evidence from Possible Explanations
Suppose your plants receiving less water grew less.
Your evidence may show:
Plants receiving 20 mL per day had lower average growth than plants receiving 60 mL per day.
You might explain this using biological knowledge.
However, unless your experiment directly measured the mechanism, distinguish the observation from the explanation.
For example:
"The data show that plants receiving less water had lower average growth. One possible explanation is that reduced water availability limited processes required for growth."
This is more scientifically careful than claiming your experiment directly proved every part of the mechanism.
Reflect on Feedback
Judges may give you suggestions or ask questions that reveal weaknesses you had not considered.
Feedback can help you identify:
- variables you overlooked
- better measuring techniques
- alternative explanations
- weaknesses in your graph
- problems with your procedure
- possible future investigations
Do not treat every difficult question as criticism.
A challenging question may reveal a useful direction for improving your scientific thinking.
Record Useful Feedback
After presenting, it can be useful to write down:
What questions did judges ask?
Which questions were difficult to answer?
What strengths did they identify?
What limitations did they notice?
What improvements did they suggest?
What would I do differently next time?
This turns the judging experience into part of the scientific learning process.
From Feedback to Improvement
Imagine a judge asks:
"How did you make sure each plant received the same light intensity?"
You realize that you controlled the number of hours of light but not the plants' distance from the lamp.
That feedback identifies a possible control-variable problem.
In a future investigation, you might:
- place all plants the same distance from identical lamps
- measure light intensity
- rotate plant positions systematically
- control other environmental conditions more carefully
Feedback has now improved your experimental design skills.
Common Mistakes
Memorizing without understanding
If you understand your investigation, you can explain it even when the judge asks unexpected questions.
Reading directly from the board
Use the display as a visual aid rather than a script.
Explaining every small detail
Focus on the most important scientific information.
Saying only "My hypothesis was correct"
Explain what the evidence showed.
Ignoring numerical evidence
Refer to important measurements when they strengthen your explanation.
Hiding anomalous results
Discuss unusual results scientifically.
Making up an answer
If you do not know, say so.
Claiming the experiment proves too much
Keep conclusions within the limits of the evidence collected.
Saying the experiment had no limitations
Every investigation has limitations.
Recognizing them demonstrates scientific thinking.
Giving vague improvements
"Be more careful" is usually not enough.
Suggest a specific change to equipment, procedure, sample size, measurement technique, or variable control.
Speaking too quickly
Slow down enough for the judge to follow your explanation.
Treating feedback as failure
Feedback can reveal ways to design better investigations in the future.
Key Terms
Presentation — An organized explanation of scientific work to an audience.
Judge — A person who evaluates and discusses a science fair investigation.
Scientific communication — The clear sharing of scientific questions, methods, evidence, reasoning, and conclusions.
Summary — A concise explanation containing the most important information.
Scientific evidence — Measurements and observations used to support or challenge a scientific claim.
Claim — A statement or conclusion that can be supported by evidence.
Reasoning — Scientific explanation connecting evidence to a claim.
Claim-Evidence-Reasoning (CER) — A structure for explaining a scientific conclusion using a claim, supporting evidence, and scientific reasoning.
Trend — A general pattern or direction in data.
Anomalous result — A result that differs noticeably from the general pattern.
Hypothesis — A testable prediction supported by scientific reasoning.
Independent variable — The factor deliberately changed during an investigation.
Dependent variable — The factor measured or observed.
Control variable — A factor kept as constant as reasonably possible.
Fair test — An investigation designed so that important variables other than the independent variable are controlled.
Conclusion — An evidence-based answer to the research question.
Justification — An explanation showing why a claim, decision, or conclusion is reasonable.
Limitation — A feature of an investigation that restricts the strength, precision, or interpretation of its evidence.
Improvement — A specific change that could increase the quality of an investigation.
Uncertainty — The degree of doubt associated with a measurement or conclusion.
Reliability — The consistency or dependability of experimental results.
Sample size — The number of individual observations, organisms, objects, or measurements included in a study.
Feedback — Information provided by others that can be used to evaluate and improve work.
Reflection — Careful consideration of what was learned, what worked, and what could be improved.
Key Takeaways
- Your science fair presentation should tell the story of your investigation.
- Begin with a clear explanation of your research question.
- Explain why the question was worth investigating.
- Understand the science behind your project.
- Explain your hypothesis using scientific reasoning.
- Be prepared to identify your independent, dependent, and control variables.
- Summarize the experimental method rather than reading every step.
- Use your display as a visual aid, not as a script.
- Know the main patterns in your results.
- Use important numerical evidence when it strengthens your explanation.
- Explain graphs rather than simply pointing to them.
- Use Claim → Evidence → Reasoning to support scientific explanations.
- Your conclusion should answer your research question.
- Keep conclusions within the limits of your evidence.
- Do not hide anomalous or unexpected results.
- Be prepared to discuss limitations.
- Suggest specific improvements that address those limitations.
- An unsupported hypothesis does not mean an unsuccessful investigation.
- It is scientifically responsible to say "I don't know" when the evidence does not provide an answer.
- Listen carefully to judges' questions before responding.
- Ask for clarification when you do not understand a question.
- Confidence comes primarily from understanding your investigation.
- Practise explaining the project without memorizing every sentence.
- Practise answering difficult and unexpected questions.
- Use judges' feedback to identify improvements for future investigations.
A strong presentation ultimately communicates four things:
I understand what I investigated.
I understand the evidence I collected.
I can explain why my conclusion follows from that evidence.
I understand how my investigation could be improved.