Probability Distributions
2. Expected Value and Variance
Learning outcomes
- I can calculate expected values.
- I can calculate variance.
- I can calculate standard deviation.
- I can interpret measures of spread.
- I can solve decision-making problems using expected value.
Expected Value and Variance
Introduction to Expected Value and Variance
When analysing uncertain situations, knowing the possible outcomes and their probabilities is only the beginning. We often want to know what result to expect on average and how much individual outcomes might differ from that average.
For example:
-
What is the average number of customers expected at a shop?
-
How much might the daily number of customers vary?
-
Which investment has the greatest expected return?
-
Which game offers the best chance of winning money?
-
How can two situations have the same average outcome but different levels of risk?
Three important statistical measures help answer these questions:
-
Expected value describes the probability-weighted average outcome.
-
Variance measures how widely outcomes are spread around the expected value.
-
Standard deviation expresses that spread in the same units as the original variable.
Together, these measures help us understand probability distributions, compare uncertain outcomes, and make informed decisions.


Reviewing Random Variables and Probability Distributions
A random variable assigns a numerical value to the outcome of a random experiment.
For example, suppose a fair six-sided die is rolled.
Let X represent the number shown.
The possible values are:
X = 1, 2, 3, 4, 5, 6
Each value has probability 1/6.
A probability distribution describes the probabilities associated with the possible values of a random variable.
For a discrete random variable, the distribution can be represented using a table.
|
X |
P(X = x) |
|---|---|
|
1 |
1/6 |
|
2 |
1/6 |
|
3 |
1/6 |
|
4 |
1/6 |
|
5 |
1/6 |
|
6 |
1/6 |
A valid discrete probability distribution must satisfy two conditions:
-
Every probability must be between 0 and 1.
-
The probabilities of all possible outcomes must add to 1.
These conditions are essential when calculating expected values and measures of spread.
Understanding Expected Value
The expected value of a random variable is the average result that would be approached over many repetitions of the same random experiment under consistent conditions.
It is also called the mean of the probability distribution.
Expected value is different from simply finding the average of the possible values when those values do not all have equal probabilities.
Instead, each value is weighted according to how likely it is to occur.
For a discrete random variable X:
E(X) = ΣxP(X = x)
where:
-
E(X) is the expected value of X.
-
x represents a possible value.
-
P(X = x) is the probability of that value.
-
Σ means to add all the terms.
Steps for Calculating Expected Value
-
List the possible values of the random variable.
-
Identify the probability of each value.
-
Multiply each value by its probability.
-
Add the products.
Worked Example: Expected Value of a Die
A fair six-sided die is rolled.
Let X represent the number shown.
Each outcome has probability 1/6.
E(X) = 1(1/6) + 2(1/6) + 3(1/6) + 4(1/6) + 5(1/6) + 6(1/6)
= (1 + 2 + 3 + 4 + 5 + 6)/6
= 21/6
E(X) = 3.5
Interpreting the Result
The expected value is 3.5, even though a die cannot show 3.5.
This is not a mistake.
Expected value represents the long-run average of many rolls, not necessarily a value that can occur in a single experiment.
Calculating Expected Value from a Probability Table
Worked Example: Number of Customers
A small shop records the number of customers arriving during a particular five-minute period.
Let X represent the number of customers.
|
X |
P(X = x) |
xP(X = x) |
|---|---|---|
|
0 |
0.10 |
0 |
|
1 |
0.20 |
0.20 |
|
2 |
0.40 |
0.80 |
|
3 |
0.20 |
0.60 |
|
4 |
0.10 |
0.40 |
Calculate the expected number of customers.
E(X) = 0 + 0.20 + 0.80 + 0.60 + 0.40
E(X) = 2
The expected number of customers is 2 per five-minute period.
This does not mean exactly two customers will arrive every five minutes. Some periods may have no customers, while others may have four.

Understanding Variance
Expected value tells us the centre of a probability distribution, but it does not describe how spread out the possible outcomes are.
Consider two games.
Game A: A player always receives $5.
Game B: A player has a 50% chance of receiving $0 and a 50% chance of receiving $10.
Both games have the same expected value:
E(A) = $5
E(B) = 0(0.5) + 10(0.5) = $5
However, the outcomes are very different.
Game A always produces the same result.
Game B produces either $0 or $10.
Game B therefore has greater variability.
Variance measures the average squared distance of the possible values from the expected value, weighted by their probabilities.
A larger variance indicates that outcomes tend to be more spread out.
A smaller variance indicates that outcomes tend to be closer to the expected value.
The Variance Formula
For a discrete random variable X:
Var(X) = Σ(x − μ)²P(X = x)
where:
-
Var(X) is the variance of X.
-
x is a possible value.
-
μ = E(X) is the expected value.
-
P(X = x) is the probability of that value.
The expression:
(x − μ)
represents the difference between a value and the mean.
Squaring the difference ensures that negative and positive deviations do not cancel each other.
Steps for Calculating Variance
-
Calculate the expected value, μ.
-
Subtract μ from each possible value.
-
Square each difference.
-
Multiply each squared difference by its probability.
-
Add the results.
Worked Example: Variance of a Simple Distribution
Suppose X has the following probability distribution:
|
X |
P(X = x) |
|---|---|
|
1 |
0.25 |
|
2 |
0.50 |
|
3 |
0.25 |
Step 1: Calculate the Expected Value
E(X) = 1(0.25) + 2(0.50) + 3(0.25)
= 0.25 + 1.00 + 0.75
μ = 2
Step 2: Calculate Squared Deviations
|
X |
P(X = x) |
x − μ |
(x − μ)² |
(x − μ)²P(X = x) |
|---|---|---|---|---|
|
1 |
0.25 |
−1 |
1 |
0.25 |
|
2 |
0.50 |
0 |
0 |
0 |
|
3 |
0.25 |
1 |
1 |
0.25 |
Step 3: Add the Weighted Squared Deviations
Var(X) = 0.25 + 0 + 0.25
Var(X) = 0.5
The variance is 0.5.
This indicates that the outcomes have some spread around the expected value of 2.
An Alternative Formula for Variance
Variance can also be calculated using a shorter formula:
Var(X) = E(X²) − [E(X)]²
where:
E(X²) = Σx²P(X = x)
This formula is often more efficient when working with probability tables.
Worked Example: Using the Alternative Formula
Use the distribution:
|
X |
P(X = x) |
|---|---|
|
1 |
0.25 |
|
2 |
0.50 |
|
3 |
0.25 |
We already know:
E(X) = 2
Calculate E(X²):
E(X²) = 1²(0.25) + 2²(0.50) + 3²(0.25)
= 0.25 + 2.00 + 2.25
= 4.5
Now calculate variance:
Var(X) = 4.5 − 2²
= 4.5 − 4
Var(X) = 0.5
Both formulas produce the same answer.
Comparing Two Probability Distributions
Two distributions may have the same expected value but different variances.
Consider:
Distribution A
|
X |
Probability |
|---|---|
|
4 |
0.5 |
|
6 |
0.5 |
Distribution B
|
X |
Probability |
|---|---|
|
0 |
0.5 |
|
10 |
0.5 |
Both have expected value 5.
However:
Var(A) = (4 − 5)²(0.5) + (6 − 5)²(0.5) = 1
Var(B) = (0 − 5)²(0.5) + (10 − 5)²(0.5) = 25
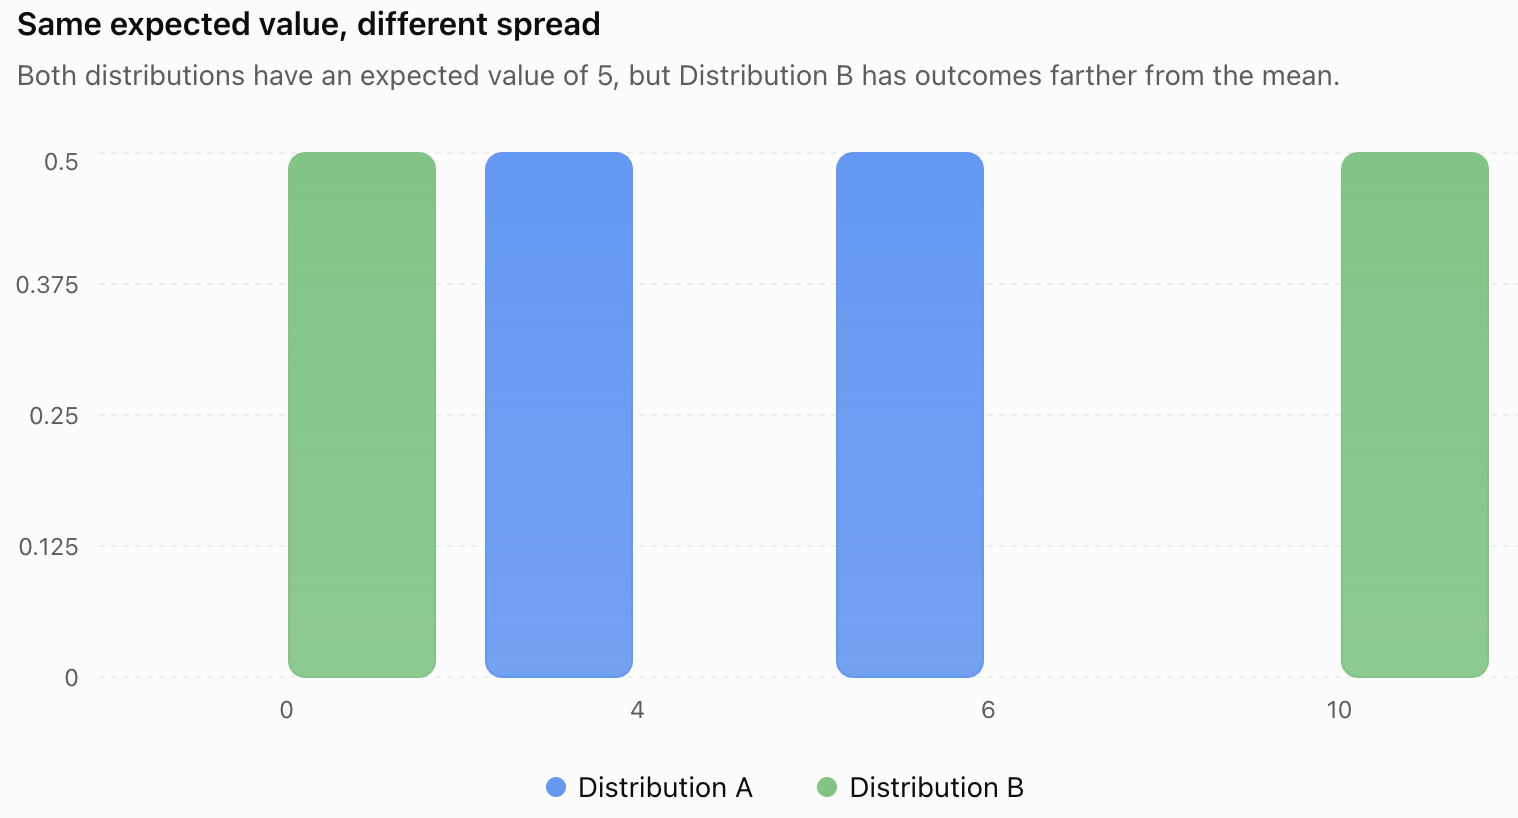
Distribution B has a much greater variance because its outcomes are farther from the mean.
This demonstrates why expected value alone does not fully describe a random variable.
Standard Deviation
The standard deviation is the positive square root of the variance.
For a random variable X:
σ = √Var(X)
where σ (sigma) represents the standard deviation.
Standard deviation measures the spread of outcomes around the mean.
Unlike variance, standard deviation is expressed in the same units as the original variable.
For example:
-
If X is measured in dollars, standard deviation is measured in dollars.
-
If X is measured in seconds, standard deviation is measured in seconds.
-
If X is measured in metres, standard deviation is measured in metres.
Variance, by contrast, is expressed in squared units.
Worked Example: Standard Deviation
Suppose:
Var(X) = 9
Then:
σ = √9
σ = 3
If X represents the number of customers, the standard deviation is 3 customers.
Calculating Standard Deviation from a Distribution
Consider the distribution:
|
X |
P(X = x) |
|---|---|
|
1 |
0.25 |
|
2 |
0.50 |
|
3 |
0.25 |
We previously calculated:
E(X) = 2
Var(X) = 0.5
Therefore:
σ = √0.5
σ ≈ 0.707
The standard deviation is approximately 0.71.
Interpreting the Result
The possible values are relatively close to the expected value of 2.
A standard deviation of approximately 0.71 indicates a modest spread around the mean.
Standard deviation should not be interpreted as a strict limit on how far outcomes can lie from the mean.
Comparing Standard Deviations
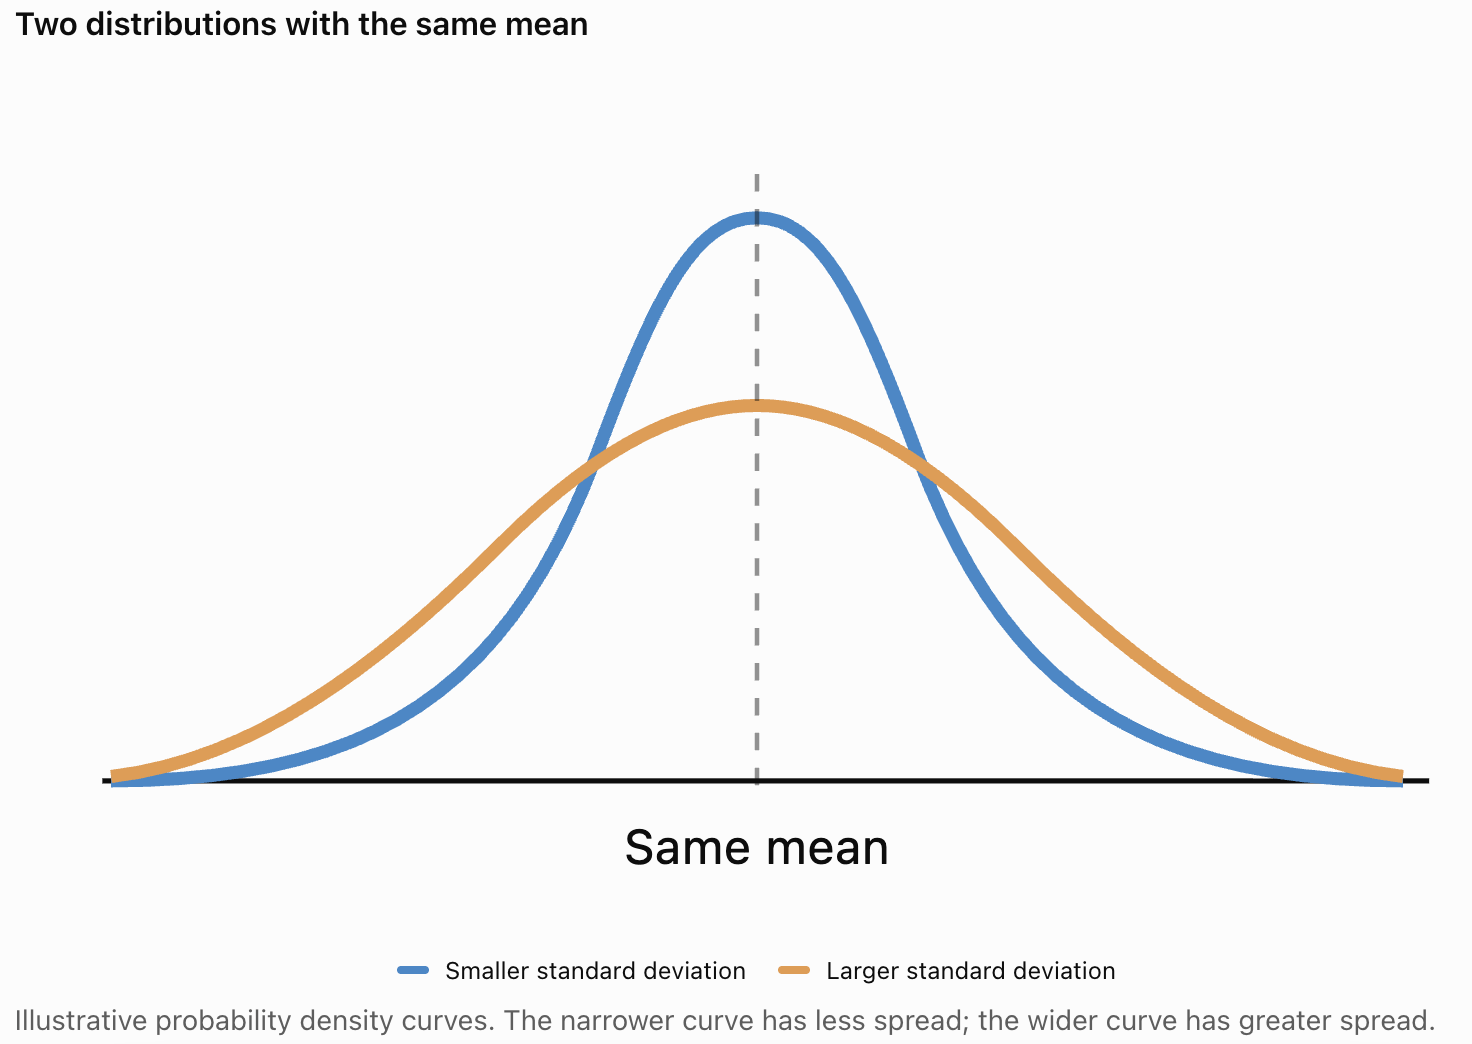
A smaller standard deviation means that values tend to cluster more closely around the mean.
A larger standard deviation means that values tend to be more widely spread.
Important Interpretation
Standard deviation describes variability, not whether an outcome is good or bad.
A high standard deviation may represent:
-
Greater uncertainty.
-
More variable results.
-
A wider range of possible outcomes.
Whether this is desirable depends on the situation.
For example, a company may prefer consistent production quality, while a researcher may be interested in naturally variable measurements.
Variance and Standard Deviation of a Fair Die
A fair six-sided die provides a useful example.
The expected value is:
E(X) = 3.5
Calculate E(X²):
E(X²) = [1² + 2² + 3² + 4² + 5² + 6²]/6
= (1 + 4 + 9 + 16 + 25 + 36)/6
= 91/6
≈ 15.1667
Calculate variance:
Var(X) = E(X²) − [E(X)]²
= 91/6 − 3.5²
= 91/6 − 12.25
Var(X) = 35/12 ≈ 2.917
Calculate standard deviation:
σ = √(35/12)
σ ≈ 1.708
Summary
For a fair six-sided die:
-
Expected value = 3.5
-
Variance ≈ 2.917
-
Standard deviation ≈ 1.708
These values describe both the centre and spread of the die's probability distribution.
Properties of Expected Value
Expected value follows several useful mathematical rules.
Adding a Constant
If a constant c is added to every possible value:
E(X + c) = E(X) + c
For example, if:
E(X) = 5
then:
E(X + 3) = 8
Multiplying by a Constant
If every possible value is multiplied by a constant a:
E(aX) = aE(X)
For example:
E(4X) = 4E(X)
Combining Both Operations
E(aX + b) = aE(X) + b
This rule is useful when converting units or transforming random variables.
Properties of Variance and Standard Deviation
Variance behaves differently from expected value.
Adding a Constant
Adding a constant to every outcome shifts the distribution but does not change its spread.
Var(X + c) = Var(X)
For example, if every employee receives a $100 increase in a particular payment, the variance of those payments remains unchanged.
Multiplying by a Constant
Multiplying every outcome by a constant changes the variance by the square of that constant.
Var(aX) = a²Var(X)
For example, if:
Var(X) = 4
then:
Var(3X) = 3² × 4
= 36
Standard Deviation
Standard deviation changes by the absolute value of the multiplier.
SD(aX + b) = |a|SD(X)
These properties are useful when changing measurement units or comparing transformed distributions.
Expected Value in Games and Gambling
Expected value can be used to determine whether a game is mathematically fair.
A fair game has an expected net gain of zero.
Worked Example: A Dice Game
A player pays $4 to roll a fair six-sided die.
If the player rolls a 6, they receive $18.
Otherwise, they receive nothing.
Let X represent the player's net gain.
If the player wins:
X = 18 − 4 = $14
If the player loses:
X = −$4
The probabilities are:
P(win) = 1/6
P(lose) = 5/6
Expected value:
E(X) = 14(1/6) + (−4)(5/6)
= 14/6 − 20/6
= −6/6
E(X) = −$1
Interpretation
The player loses an average of $1 per game over many repetitions.
The game is not mathematically fair to the player.

Using Expected Value for Decision-Making
Expected value is especially useful when comparing choices involving uncertain outcomes.
Worked Example: Comparing Two Projects
A business is considering two possible projects.
Project A
-
80% probability of earning $1,000
-
20% probability of losing $500
Expected value:
E(A) = 0.80(1000) + 0.20(−500)
= 800 − 100
E(A) = $700
Project B
-
50% probability of earning $1,800
-
50% probability of losing $200
Expected value:
E(B) = 0.50(1800) + 0.50(−200)
= 900 − 100
E(B) = $800
Project B has the higher expected profit.
However, we should also compare the variance and standard deviation.
Comparing Risk Using Variance
Project A
Expected value:
μ = 700
Variance:
Var(A) = (1000 − 700)²(0.80) + (−500 − 700)²(0.20)
= 300²(0.80) + (−1200)²(0.20)
= 90,000(0.80) + 1,440,000(0.20)
= 72,000 + 288,000
Var(A) = 360,000
Standard deviation:
SD(A) = √360,000
SD(A) = $600
Project B
Expected value:
μ = 800
Variance:
Var(B) = (1800 − 800)²(0.50) + (−200 − 800)²(0.50)
= 1000²(0.50) + (−1000)²(0.50)
= 500,000 + 500,000
Var(B) = 1,000,000
Standard deviation:
SD(B) = √1,000,000
SD(B) = $1,000
Comparing the Projects
|
Measure |
Project A |
Project B |
|---|---|---|
|
Expected profit |
$700 |
$800 |
|
Variance |
360,000 dollars² |
1,000,000 dollars² |
|
Standard deviation |
$600 |
$1,000 |
|
Maximum possible loss |
$500 |
$200 |
Interpretation
Project B has a higher expected profit, but also greater variability.
Project A has a lower expected profit and a smaller standard deviation.
Interestingly, Project A has a larger possible loss, despite its lower variance.
This illustrates an important point:
Standard deviation measures spread, but it does not fully describe every type of risk.
A decision-maker should consider:
-
Expected return.
-
Variability.
-
Maximum possible loss.
-
Available financial resources.
-
The consequences of an unfavourable outcome.
-
Personal or organizational risk tolerance.
Expected Value and Insurance
Insurance provides another practical application of expected value.
Suppose an insurance company estimates that a particular type of claim has:
-
A 2% probability of occurring.
-
An average payout of $5,000 if it occurs.
The expected payout per policy is:
E(X) = 0.02(5000) + 0.98(0)
E(X) = $100
The expected claim cost is $100 per policy.
An insurance company must consider this expected cost, along with administrative expenses, uncertainty, reserves, and other factors when setting premiums.

Expected Value and the Binomial Distribution
The binomial distribution describes the number of successes in a fixed number of independent trials when each trial has the same probability of success.
If:
X follows a binomial distribution with parameters n and p,
then:
E(X) = np
Var(X) = np(1 − p)
SD(X) = √[np(1 − p)]
where:
-
n is the number of trials.
-
p is the probability of success.
-
1 − p is the probability of failure.
Worked Example: Coin Tosses
A fair coin is tossed 20 times.
Let X represent the number of heads.
n = 20
p = 0.5
Expected value:
E(X) = 20 × 0.5
E(X) = 10
Variance:
Var(X) = 20 × 0.5 × 0.5
Var(X) = 5
Standard deviation:
SD(X) = √5
SD(X) ≈ 2.236
Interpretation
The expected number of heads is 10.
The standard deviation is approximately 2.24 heads, describing the typical scale of variation around the expected number.
The actual number of heads will not necessarily be 10 in every set of 20 tosses.
Understanding Measures of Spread
Expected value, variance, and standard deviation describe different aspects of a distribution.
|
Measure |
What it describes |
Units |
|---|---|---|
|
Expected value |
Centre or long-run average |
Original units |
|
Variance |
Average squared deviation from the mean |
Squared units |
|
Standard deviation |
Scale of spread around the mean |
Original units |
Small Variance and Standard Deviation
A small variance indicates that outcomes tend to be close to the expected value.
Examples include:
-
Consistent manufacturing measurements.
-
Predictable delivery times.
-
Stable daily demand.
Large Variance and Standard Deviation
A large variance indicates that outcomes tend to be more widely spread.
Examples include:
-
Highly variable sales.
-
Uncertain investment returns.
-
Inconsistent waiting times.
However, the meaning of "large" or "small" depends on the scale and context of the variable.
The Relationship Between Standard Deviation and Normal Distributions
Many naturally occurring measurements can be approximately modelled using a normal distribution.
A normal distribution has a symmetrical, bell-shaped curve.
For an exactly normal distribution:
-
Approximately 68% of values lie within one standard deviation of the mean.
-
Approximately 95% lie within two standard deviations.
-
Approximately 99.7% lie within three standard deviations.
This is known as the Empirical Rule.

Example: Test Scores
Suppose test scores are approximately normally distributed with:
Mean = 70
Standard deviation = 10
Then approximately:
-
68% of scores lie between 60 and 80.
-
95% lie between 50 and 90.
-
99.7% lie between 40 and 100.
These percentages are approximate and apply to distributions that are normal or closely resemble a normal distribution.
They should not automatically be applied to every probability distribution.
Common Mistakes
Confusing expected value with the most likely outcome
Expected value is a weighted average, while the most likely outcome is the mode.
Assuming expected value must be a possible outcome
The expected value of a die is 3.5, even though a die cannot show 3.5.
Forgetting to multiply each value by its probability
Expected value is calculated using weighted values.
Calculating variance without first finding the mean
Variance measures spread around the expected value.
Forgetting to square deviations
Negative and positive deviations would otherwise cancel.
Confusing variance and standard deviation
Standard deviation is the square root of variance.
Using the wrong units
Variance has squared units, while standard deviation has the original units.
Assuming a larger expected value always means a better decision
Risk, possible losses, and other factors may also be important.
Assuming a larger variance always means a worse outcome
Greater variability may be acceptable or desirable in some situations.
Applying normal-distribution rules to every distribution
The 68–95–99.7 rule applies specifically to normal distributions.
Key Terms
-
Expected Value: The probability-weighted average of the possible values of a random variable.
-
Mean: The average value of a probability distribution.
-
Random Variable: A variable that assigns numerical values to outcomes of a random experiment.
-
Probability Distribution: A description of the probabilities associated with possible values of a random variable.
-
Variance: The probability-weighted average of squared deviations from the expected value.
-
Standard Deviation: The positive square root of variance.
-
Deviation: The difference between an observed or possible value and the mean.
-
Squared Deviation: The square of the difference between a value and the mean.
-
Weighted Average: An average in which values contribute according to assigned weights.
-
Spread: The extent to which values differ from one another or from the centre of a distribution.
-
Variability: The degree to which outcomes differ across observations or trials.
-
Risk: The possibility of outcomes that differ from expectations, particularly unfavourable outcomes.
-
Fair Game: A game with an expected net gain of zero for the player.
-
Long-Run Average: The average outcome approached over many repeated experiments.
-
Binomial Distribution: A distribution describing the number of successes in repeated independent trials with constant success probability.
-
Normal Distribution: A symmetrical, bell-shaped continuous probability distribution.
-
Empirical Rule: The approximate 68–95–99.7 pattern for normal distributions.
-
Risk Tolerance: The amount of uncertainty or potential loss a decision-maker is willing or able to accept.
-
Probability Model: A mathematical representation of uncertain outcomes.
-
Decision-Making Under Uncertainty: Choosing between alternatives when their outcomes are not known with certainty.
Key Takeaways
-
Expected value describes the long-run average outcome of a random variable.
-
Expected value is calculated by multiplying each possible value by its probability and adding the products.
-
Variance measures the average squared distance of outcomes from the expected value.
-
Standard deviation is the positive square root of variance.
-
Variance is measured in squared units, while standard deviation uses the original units.
-
Two distributions can have the same expected value but different variances.
-
A smaller standard deviation indicates outcomes tend to cluster more closely around the mean.
-
A larger standard deviation indicates greater variability.
-
Expected value can be used to evaluate games, business projects, insurance, and financial decisions.
-
A fair game has an expected net gain of zero.
-
Expected value alone does not fully describe risk.
-
Variance and standard deviation help compare uncertainty between different choices.
-
For a binomial distribution, E(X) = np and Var(X) = np(1 − p).
-
Adding a constant changes expected value but not variance.
-
Multiplying a random variable by a constant changes variance by the square of that constant.
-
The Empirical Rule describes how values are distributed around the mean in a normal distribution.
-
Expected value, variance, and standard deviation are essential tools in probability, statistics, and decision-making.
Check Your Understanding
Recall and Understanding
-
Define expected value and explain what it represents.
-
State the formula for calculating the expected value of a discrete random variable.
-
Explain the difference between variance and standard deviation.
-
Why are deviations squared when calculating variance?
-
Explain why two distributions can have the same expected value but different standard deviations.
Application
-
A random variable X has values 1, 2, and 3 with probabilities 0.2, 0.5, and 0.3. Calculate E(X).
-
Using the distribution in Question 6, calculate Var(X).
-
Calculate the standard deviation of the distribution in Question 6.
-
A fair six-sided die is rolled. Calculate its expected value and variance.
-
A binomial random variable has n = 12 and p = 0.25. Calculate its expected value, variance, and standard deviation.
Analysis and Challenge
-
A game costs $5 to play. A player has a 20% chance of receiving $20 and an 80% chance of receiving nothing. Calculate the expected net gain and determine whether the game is fair.
-
Two investments have the same expected return but different standard deviations. Explain how this information could influence a decision.
-
A random variable has E(X) = 8 and Var(X) = 4. Find E(3X + 2), Var(3X + 2), and SD(3X + 2).
-
A business is considering two projects. Project A has a 70% chance of earning $1,000 and a 30% chance of losing $400. Project B has a 40% chance of earning $2,000 and a 60% chance of losing $100. Calculate the expected value of each project and discuss which might be preferable.
-
Explain why expected value and standard deviation should be considered together when making decisions under uncertainty.
Final Summary
Expected value, variance, and standard deviation are fundamental tools for analysing probability distributions.
Expected value describes the long-run average outcome, while variance and standard deviation measure how widely possible outcomes are spread around that average.
By calculating these measures, students can compare probability distributions, interpret uncertainty, and evaluate decisions involving risk.
Understanding both the expected outcome and the variability of possible results provides a more complete picture than considering the average alone.
These concepts are widely used in probability, statistics, business, finance, engineering, science, and real-world decision-making.