Probability Distributions
| サイト: | Young Education |
| コース: | Probability and Combinatorics |
| ブック: | Probability Distributions |
| 印刷者: | Guest user |
| 日付: | 2026年 11月 9日(月曜日) 16:39 |
1. Random Variables
Learning outcomes
- I can define random variables.
- I can distinguish between discrete and continuous variables.
- I can determine probability distributions.
- I can calculate expected values.
- I can interpret random variables in context.
Random Variables
Introduction to Random Variables
Many situations involve uncertainty. We may not know how many customers will enter a shop tomorrow, how long a bus will take to arrive, or how many heads will appear when a coin is tossed several times.
Although individual outcomes may be unpredictable, mathematics allows us to describe and analyse these situations using probability.
A random variable is a variable that assigns a numerical value to each possible outcome of a random experiment.
Random variables are important because they allow us to:
-
Represent uncertain outcomes using numbers.
-
Distinguish between different types of data.
-
Calculate the probability of different results.
-
Determine expected values.
-
Make predictions and informed decisions.
Random variables form an important foundation for probability distributions, statistics, risk analysis, and mathematical modelling.


Understanding Random Variables
A random experiment is a process whose outcome cannot be predicted with certainty.
Examples include:
-
Tossing a coin.
-
Rolling a die.
-
Selecting a card from a shuffled deck.
-
Measuring the lifetime of a battery.
-
Recording the number of customers arriving at a shop.
A random variable assigns a number to the outcome.
Random variables are commonly represented by capital letters such as X, Y, or Z.
Example: Rolling a Die
Suppose a fair six-sided die is rolled.
Let X represent the number shown.
The possible values are:
X = 1, 2, 3, 4, 5, 6
Each value has a probability of:
P(X = x) = 1/6
The random variable X describes the numerical outcome of the experiment.
Example: Tossing Two Coins
Suppose two fair coins are tossed.
The possible outcomes are:
HH, HT, TH, TT
Let X represent the number of heads obtained.
|
Outcome |
Value of X |
|---|---|
|
HH |
2 |
|
HT |
1 |
|
TH |
1 |
|
TT |
0 |
The possible values of X are:
0, 1, 2
Notice that different outcomes can produce the same value of the random variable.
For example, HT and TH both give X = 1.
This distinction is important when constructing probability distributions.
Discrete Random Variables
A discrete random variable can take a finite or countably infinite set of possible values.
Discrete random variables usually arise from counting.
Examples include:
-
The number of students absent from school.
-
The number of goals scored in a football match.
-
The number of defective products in a sample.
-
The number of heads obtained in five coin tosses.
-
The number of customers entering a shop.
Discrete random variables often take whole-number values, although this is not required.
For example, a random variable representing a financial gain or loss could take values of −$5, $0, and $10.
Worked Example: Number of Heads
Three fair coins are tossed.
Let X represent the number of heads.
The possible values are:
X = 0, 1, 2, 3
The complete sample space is:
HHH, HHT, HTH, THH, HTT, THT, TTH, TTT
There are eight equally likely outcomes.
|
Number of heads, X |
Number of outcomes |
Probability |
|---|---|---|
|
0 |
1 |
1/8 |
|
1 |
3 |
3/8 |
|
2 |
3 |
3/8 |
|
3 |
1 |
1/8 |
This table is a discrete probability distribution.

Continuous Random Variables
A continuous random variable can take any real value within an interval or collection of intervals.
Continuous random variables usually arise from measurement.
Examples include:
-
A person's height.
-
The mass of an object.
-
The time required to complete a race.
-
The temperature of a liquid.
-
The distance travelled by a vehicle.
-
The lifetime of a battery.
For example, suppose X represents the time required to run 100 metres.
Possible values might include:
12.1 seconds
12.14 seconds
12.143 seconds
12.1437 seconds
The time can theoretically take infinitely many values within a range.
Important Distinction
A continuous random variable is not limited to the precision of the measuring instrument.
A stopwatch may display times to two decimal places, but the underlying time remains continuous.
Discrete Versus Continuous Variables
|
Feature |
Discrete |
Continuous |
|---|---|---|
|
Typical source |
Counting |
Measuring |
|
Possible values |
Finite or countably infinite |
Values across intervals |
|
Examples |
Number of students, dice results |
Height, mass, time |
|
Probability at an exact value |
Can be positive |
Zero for a continuous distribution |
|
Probability representation |
Probability mass function |
Probability density function |


Probability Distributions
A probability distribution describes how probabilities are assigned to the possible values of a random variable.
It answers questions such as:
-
Which outcomes are most likely?
-
Which outcomes are least likely?
-
What is the probability of a particular result?
-
How are the possible values distributed?
For a discrete random variable, a probability distribution can be represented using a table, graph, or formula.
Rules for a Discrete Probability Distribution
A valid discrete probability distribution must satisfy two conditions.
Every probability must be between 0 and 1.
0 ≤ P(X = x) ≤ 1
The probabilities of all possible values must add to 1.
ΣP(X = x) = 1
These conditions ensure that the distribution represents all possible outcomes correctly.
Constructing a Probability Distribution
Worked Example: Rolling a Fair Die
Let X represent the number shown when a fair six-sided die is rolled.
|
X |
P(X = x) |
|---|---|
|
1 |
1/6 |
|
2 |
1/6 |
|
3 |
1/6 |
|
4 |
1/6 |
|
5 |
1/6 |
|
6 |
1/6 |
Check the total probability:
6 × 1/6 = 1
Therefore, the distribution is valid.
Worked Example: Two Coin Tosses
Let X represent the number of heads obtained when two fair coins are tossed.
The sample space is:
HH, HT, TH, TT
Each outcome has probability 1/4.
|
X |
Outcomes |
P(X = x) |
|---|---|---|
|
0 |
TT |
1/4 |
|
1 |
HT, TH |
2/4 |
|
2 |
HH |
1/4 |
Simplifying:
|
X |
P(X = x) |
|---|---|
|
0 |
0.25 |
|
1 |
0.50 |
|
2 |
0.25 |
Check:
0.25 + 0.50 + 0.25 = 1
This is a valid probability distribution.
Representing Probability Distributions Graphically
Discrete probability distributions are often displayed using bar charts.
Each bar represents the probability of a particular value.
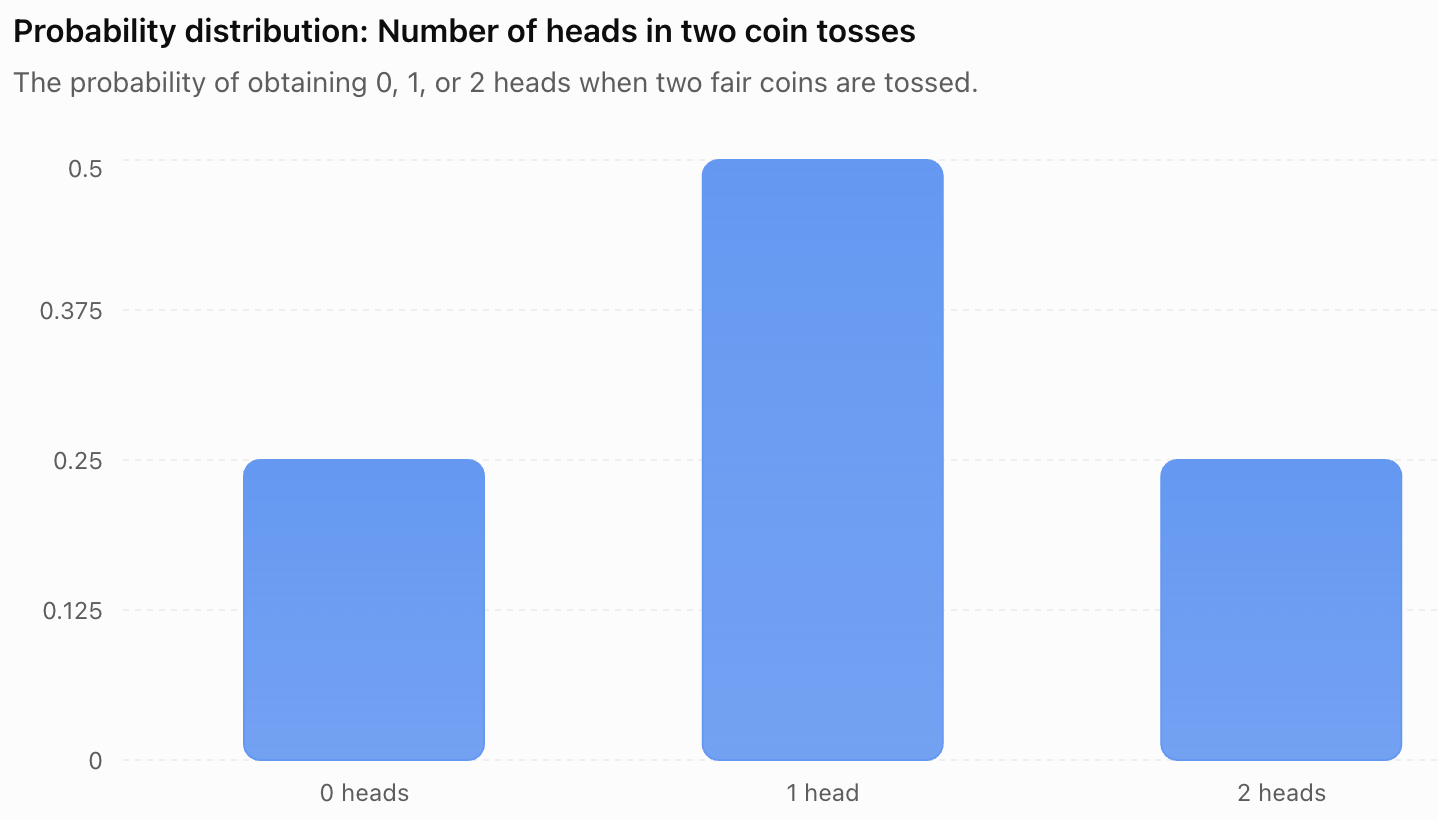
The graph shows that:
-
Obtaining one head is the most likely result.
-
Obtaining zero heads and two heads are equally likely.
-
The probabilities add to 1.
A probability distribution provides more information than a simple list of possible values because it shows how likely each value is.
Calculating Probabilities from a Distribution
Once a probability distribution is known, probabilities involving several values can be calculated.
Suppose a random variable X has the following distribution:
|
X |
P(X = x) |
|---|---|
|
0 |
0.10 |
|
1 |
0.25 |
|
2 |
0.40 |
|
3 |
0.25 |
Example: Find P(X = 2)
From the table:
P(X = 2) = 0.40
Example: Find P(X ≥ 2)
The symbol ≥ means greater than or equal to.
P(X ≥ 2) = P(X = 2) + P(X = 3)
= 0.40 + 0.25
P(X ≥ 2) = 0.65
Example: Find P(X < 2)
P(X < 2) = P(X = 0) + P(X = 1)
= 0.10 + 0.25
P(X < 2) = 0.35
Example: Find P(X ≠ 0)
Using complementary probability:
P(X ≠ 0) = 1 − P(X = 0)
= 1 − 0.10
P(X ≠ 0) = 0.90
Expected Value
The expected value of a random variable is the probability-weighted average of its possible values.
It describes the long-run average result that would be obtained if the random experiment were repeated many times under the same conditions.
Expected value is also called the mean of a probability distribution.
The expected value of a discrete random variable X is:
E(X) = ΣxP(X = x)
This means:
-
Multiply each possible value by its probability.
-
Add the resulting products.
Worked Example: Expected Value of a Die
A fair six-sided die is rolled.
Let X represent the number shown.
Each outcome has probability 1/6.
E(X) = 1(1/6) + 2(1/6) + 3(1/6) + 4(1/6) + 5(1/6) + 6(1/6)
= (1 + 2 + 3 + 4 + 5 + 6)/6
= 21/6
E(X) = 3.5
Interpreting the Result
The expected value is 3.5, even though a die cannot show 3.5.
This is not a mistake.
Expected value represents the average result over many rolls, not necessarily a value that can occur in one experiment.
Expected Value from a Probability Table
Worked Example: Number of Customers
A small shop records the number of customers arriving during a particular five-minute period.
Let X represent the number of customers.
|
X |
P(X = x) |
|---|---|
|
0 |
0.10 |
|
1 |
0.20 |
|
2 |
0.40 |
|
3 |
0.20 |
|
4 |
0.10 |
Calculate the expected number of customers.
Step 1: Multiply each value by its probability.
|
X |
P(X = x) |
xP(X = x) |
|---|---|---|
|
0 |
0.10 |
0 |
|
1 |
0.20 |
0.20 |
|
2 |
0.40 |
0.80 |
|
3 |
0.20 |
0.60 |
|
4 |
0.10 |
0.40 |
Step 2: Add the products.
E(X) = 0 + 0.20 + 0.80 + 0.60 + 0.40
E(X) = 2
Final answer:
The expected number of customers is 2 per five-minute period.
This does not mean exactly two customers will arrive every time. It describes the long-run average.
Expected Value in Games
Expected value is useful when evaluating games involving money, prizes, or risk.
Worked Example: A Prize Game
A game costs $3 to play.
A player rolls a fair six-sided die.
-
Rolling a 6 wins a $12 prize.
-
Rolling any other number wins nothing.
Let X represent the player's net gain.
The possible outcomes are:
-
Win: $12 − $3 = $9
-
Lose: $0 − $3 = −$3
The probabilities are:
P(win) = 1/6
P(lose) = 5/6
Expected value:
E(X) = 9(1/6) + (−3)(5/6)
= 9/6 − 15/6
= −6/6
E(X) = −$1
Interpreting the Result
The player loses an average of $1 per game in the long run.
The negative expected value indicates that the game favours the organizer.
A game with an expected net gain of zero is called a fair game in the mathematical sense.

Expected Value and Decision-Making
Expected value can help compare uncertain choices.
Suppose a business is considering two projects.
Project A
-
70% probability of earning $1,000
-
30% probability of losing $200
Expected value:
E(A) = 0.70(1000) + 0.30(−200)
= 700 − 60
E(A) = $640
Project B
-
50% probability of earning $1,500
-
50% probability of losing $100
Expected value:
E(B) = 0.50(1500) + 0.50(−100)
= 750 − 50
E(B) = $700
Project B has the higher expected monetary value.
However, expected value is not the only consideration. Project B also has a greater possible loss? No: its stated loss is smaller, but its outcome variability and uncertainty differ. Decision-makers should also consider risk, available resources, and the consequences of different outcomes.
Missing Probabilities
Sometimes a probability distribution contains an unknown probability.
Because all probabilities must add to 1, the missing value can be calculated.
Worked Example
Suppose X has the following distribution:
|
X |
P(X = x) |
|---|---|
|
0 |
0.15 |
|
1 |
0.30 |
|
2 |
k |
|
3 |
0.20 |
Find k.
The probabilities must add to 1:
0.15 + 0.30 + k + 0.20 = 1
0.65 + k = 1
k = 1 − 0.65
k = 0.35
The completed distribution is:
|
X |
P(X = x) |
|---|---|
|
0 |
0.15 |
|
1 |
0.30 |
|
2 |
0.35 |
|
3 |
0.20 |
Probability Distributions for Continuous Variables
Continuous random variables are described using probability density functions.
Unlike discrete probability distributions, probabilities are associated with intervals rather than individual exact values.
For a continuous random variable:
P(X = a) = 0
for any exact value a, provided the distribution is continuous.
This does not mean that the value is impossible. It means that a single point has zero probability within a continuous range.
Example: Waiting Time
Suppose X represents the waiting time for a bus.
The waiting time might be:
-
2.5 minutes
-
2.53 minutes
-
2.537 minutes
-
2.5374 minutes
The probability of waiting exactly 2.500000... minutes is zero in a continuous model.
However, the probability of waiting between 2 and 3 minutes can be positive.
Probability as Area
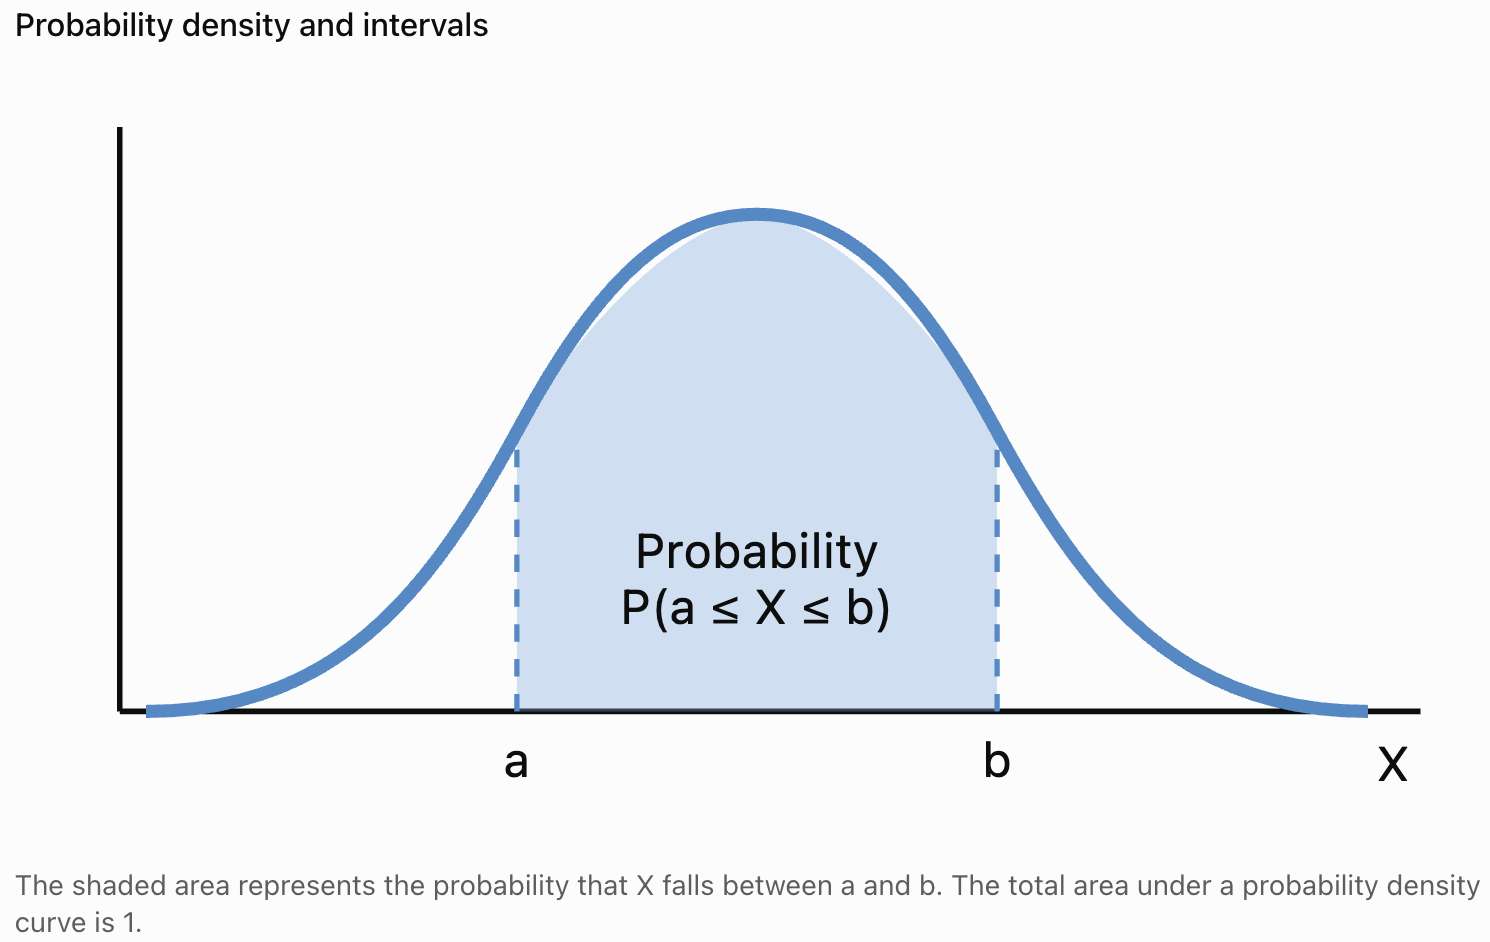
For continuous distributions, probability is represented by the area under a probability density curve.
The total area under the curve equals 1.
The Uniform Distribution
A uniform distribution describes a situation where all outcomes within a specified range are equally likely in the appropriate sense.
For a continuous uniform distribution between a and b, the probability density is constant.
Worked Example: Random Waiting Time
Suppose a bus arrives at a uniformly random time between 0 and 10 minutes after a passenger arrives.
Let X represent the waiting time.
What is the probability that the passenger waits less than 4 minutes?
For a uniform distribution:
P(X < 4) = Length of favourable interval / Total interval length
= 4/10
P(X < 4) = 0.40
There is a 40% probability of waiting less than four minutes.
Expected Value of a Continuous Uniform Distribution
For X uniformly distributed between a and b:
E(X) = (a + b)/2
For the waiting-time example:
E(X) = (0 + 10)/2
E(X) = 5 minutes
The expected waiting time is five minutes.
The Binomial Distribution
The binomial distribution describes the number of successes in a fixed number of independent trials when each trial has the same probability of success.
Examples include:
-
The number of heads in ten coin tosses.
-
The number of defective items in a sample.
-
The number of successful attempts in a series of trials.
The binomial probability formula is:
P(X = r) = C(n, r)pʳ(1 − p)^(n−r)
where:
-
n is the number of trials.
-
r is the number of successes.
-
p is the probability of success on each trial.
Worked Example: Three Coin Tosses
A fair coin is tossed three times.
Find the probability of obtaining exactly two heads.
n = 3
r = 2
p = 0.5
P(X = 2) = C(3, 2)(0.5)²(0.5)¹
= 3 × 0.25 × 0.5
P(X = 2) = 0.375
There is a 37.5% probability of obtaining exactly two heads.
Expected Value of a Binomial Random Variable
For a binomial random variable:
E(X) = np
For ten fair coin tosses:
n = 10
p = 0.5
E(X) = 10 × 0.5
E(X) = 5 heads
The expected number of heads is five.
Interpreting Random Variables in Context
Random variables are useful because they connect mathematical probability to real situations.
However, numerical results must be interpreted carefully.
Example: School Attendance
Let X represent the number of absent students in a class on a particular day.
If:
E(X) = 2.4
this means the long-run average number of absent students is 2.4.
It does not mean exactly 2.4 students can be absent on one day.
Example: Product Defects
Let X represent the number of defective products in a batch.
A probability distribution can help a company estimate:
-
The probability of finding no defective products.
-
The probability of finding more than five defective products.
-
The expected number of defective products.
Example: Travel Time
Let X represent the time required to travel to school.
The probability distribution can help estimate:
-
The likelihood of arriving within 20 minutes.
-
The chance of a journey taking longer than 30 minutes.
-
The expected travel time.


Random Variables and Mathematical Modelling
A mathematical model uses equations and probability distributions to represent a real situation.
For example, a school may model the number of students arriving late each morning.
The model could be used to estimate the probability that more than ten students arrive late.
However, mathematical models depend on assumptions.
Important questions include:
-
Are the outcomes independent?
-
Are the probabilities constant?
-
Is the sample representative?
-
Does the distribution match the observed data?
-
Are there external factors that affect the results?
A probability model is useful only when its assumptions reasonably represent the situation being studied.
Common Mistakes
Confusing a random variable with an outcome
A random variable assigns a numerical value to an outcome. Different outcomes may produce the same value.
Assuming all random variables are discrete
Random variables may be discrete or continuous.
Assuming discrete variables must always be whole numbers
Discrete variables can take any finite or countably infinite set of numerical values.
Forgetting that probabilities must add to 1
A valid discrete probability distribution must have total probability equal to 1.
Using negative probabilities
Probabilities must always lie between 0 and 1.
Confusing expected value with the most likely value
The expected value is a weighted average, while the most likely value is called the mode.
Assuming expected value must be a possible outcome
A fair die has expected value 3.5, even though 3.5 cannot appear on the die.
Forgetting to multiply values by probabilities
Expected value is calculated using ΣxP(X = x), not by simply adding the possible values.
Treating probability density as probability
For continuous random variables, probabilities are found from areas under a density curve.
Ignoring context
An expected value should always be interpreted using the appropriate units and real-world meaning.
Key Terms
-
Random Variable: A variable that assigns a numerical value to each outcome of a random experiment.
-
Random Experiment: A process whose outcome cannot be predicted with certainty.
-
Sample Space: The set of all possible outcomes of a random experiment.
-
Outcome: A possible result of an experiment.
-
Discrete Random Variable: A random variable with a finite or countably infinite set of possible values.
-
Continuous Random Variable: A random variable that can take values across a continuous interval or collection of intervals.
-
Probability Distribution: A description of how probabilities are assigned to the possible values of a random variable.
-
Probability Mass Function: A function giving the probability of each possible value of a discrete random variable.
-
Probability Density Function: A function describing a continuous distribution, where probabilities are determined from areas under the curve.
-
Expected Value: The probability-weighted average of a random variable's possible values.
-
Mean: The average value of a distribution.
-
Mode: The most likely value of a discrete random variable, or a value where a density reaches a maximum in a continuous distribution.
-
Uniform Distribution: A distribution with equal probabilities for discrete outcomes or constant density over a continuous interval.
-
Binomial Distribution: A distribution describing the number of successes in a fixed number of independent trials with constant success probability.
-
Independent Trials: Trials in which the outcome of one does not affect the probability distribution of another.
-
Success Probability: The probability of the outcome designated as a success.
-
Complementary Probability: The probability of an event not occurring.
-
Probability Model: A mathematical representation of uncertainty in a situation.
-
Long-Run Average: The average outcome approached over many repeated experiments under consistent conditions.
-
Fair Game: A game with an expected net gain of zero for the player.
Key Takeaways
-
A random variable assigns numerical values to the outcomes of a random experiment.
-
Random variables allow uncertain situations to be analysed mathematically.
-
Discrete random variables have finite or countably infinite possible values.
-
Continuous random variables can take values across continuous intervals.
-
Discrete random variables are often associated with counting, while continuous random variables are often associated with measurement.
-
A probability distribution describes the probabilities associated with the values of a random variable.
-
In a valid discrete probability distribution, every probability lies between 0 and 1 and all probabilities sum to 1.
-
The expected value of a discrete random variable is calculated using E(X) = ΣxP(X = x).
-
Expected value represents a long-run average, not necessarily an outcome that can occur in one experiment.
-
A negative expected monetary value indicates an average loss over repeated trials.
-
Continuous random variables are described using probability density functions.
-
Probabilities for continuous random variables are represented by areas under density curves.
-
The binomial distribution models the number of successes in repeated independent trials with constant success probability.
-
Random variables are useful in education, business, science, engineering, finance, and everyday decision-making.
-
Probability models must be interpreted carefully and evaluated according to their assumptions.
Check Your Understanding
Recall and Understanding
-
Define a random variable and give an example.
-
Explain the difference between discrete and continuous random variables.
-
State the two conditions required for a valid discrete probability distribution.
-
Define expected value and explain what it represents.
-
Explain why the expected value of a random variable does not always correspond to a possible outcome.
Application
-
A fair six-sided die is rolled. Let X represent the number shown. Construct the probability distribution of X.
-
Two fair coins are tossed. Let X represent the number of heads. Construct the probability distribution.
-
A random variable has values 1, 2, and 3 with probabilities 0.2, 0.5, and 0.3. Calculate E(X).
-
A probability distribution contains probabilities 0.15, 0.25, k, and 0.20. Find k.
-
A game costs $2 to play. A player has a 25% chance of receiving a $10 prize and a 75% chance of receiving nothing. Calculate the expected net gain.
Analysis and Challenge
-
Explain why the number of students in a classroom is discrete while their heights are continuous.
-
A shop records the number of customers arriving in a five-minute period. The probabilities for 0, 1, 2, and 3 customers are 0.1, 0.3, 0.4, and 0.2. Calculate the expected number of customers.
-
A fair coin is tossed five times. Use the binomial distribution to calculate the probability of obtaining exactly three heads.
-
A continuous random variable is uniformly distributed between 2 and 12. Calculate the probability that X is greater than 8 and determine E(X).
-
A business is choosing between two projects with different possible profits and losses. Explain how expected value can help compare the projects and why it should not be the only consideration.
Final Summary
Random variables provide a mathematical way to describe uncertain outcomes using numerical values.
By distinguishing between discrete and continuous random variables, students can select appropriate probability models and interpret different types of data.
Probability distributions describe how likely different outcomes are, while expected values provide a measure of the long-run average result.
These concepts form an essential foundation for probability theory, statistics, mathematical modelling, risk assessment, and informed decision-making in real-world situations.
2. Expected Value and Variance
Learning outcomes
- I can calculate expected values.
- I can calculate variance.
- I can calculate standard deviation.
- I can interpret measures of spread.
- I can solve decision-making problems using expected value.
Expected Value and Variance
Introduction to Expected Value and Variance
When analysing uncertain situations, knowing the possible outcomes and their probabilities is only the beginning. We often want to know what result to expect on average and how much individual outcomes might differ from that average.
For example:
-
What is the average number of customers expected at a shop?
-
How much might the daily number of customers vary?
-
Which investment has the greatest expected return?
-
Which game offers the best chance of winning money?
-
How can two situations have the same average outcome but different levels of risk?
Three important statistical measures help answer these questions:
-
Expected value describes the probability-weighted average outcome.
-
Variance measures how widely outcomes are spread around the expected value.
-
Standard deviation expresses that spread in the same units as the original variable.
Together, these measures help us understand probability distributions, compare uncertain outcomes, and make informed decisions.


Reviewing Random Variables and Probability Distributions
A random variable assigns a numerical value to the outcome of a random experiment.
For example, suppose a fair six-sided die is rolled.
Let X represent the number shown.
The possible values are:
X = 1, 2, 3, 4, 5, 6
Each value has probability 1/6.
A probability distribution describes the probabilities associated with the possible values of a random variable.
For a discrete random variable, the distribution can be represented using a table.
|
X |
P(X = x) |
|---|---|
|
1 |
1/6 |
|
2 |
1/6 |
|
3 |
1/6 |
|
4 |
1/6 |
|
5 |
1/6 |
|
6 |
1/6 |
A valid discrete probability distribution must satisfy two conditions:
-
Every probability must be between 0 and 1.
-
The probabilities of all possible outcomes must add to 1.
These conditions are essential when calculating expected values and measures of spread.
Understanding Expected Value
The expected value of a random variable is the average result that would be approached over many repetitions of the same random experiment under consistent conditions.
It is also called the mean of the probability distribution.
Expected value is different from simply finding the average of the possible values when those values do not all have equal probabilities.
Instead, each value is weighted according to how likely it is to occur.
For a discrete random variable X:
E(X) = ΣxP(X = x)
where:
-
E(X) is the expected value of X.
-
x represents a possible value.
-
P(X = x) is the probability of that value.
-
Σ means to add all the terms.
Steps for Calculating Expected Value
-
List the possible values of the random variable.
-
Identify the probability of each value.
-
Multiply each value by its probability.
-
Add the products.
Worked Example: Expected Value of a Die
A fair six-sided die is rolled.
Let X represent the number shown.
Each outcome has probability 1/6.
E(X) = 1(1/6) + 2(1/6) + 3(1/6) + 4(1/6) + 5(1/6) + 6(1/6)
= (1 + 2 + 3 + 4 + 5 + 6)/6
= 21/6
E(X) = 3.5
Interpreting the Result
The expected value is 3.5, even though a die cannot show 3.5.
This is not a mistake.
Expected value represents the long-run average of many rolls, not necessarily a value that can occur in a single experiment.
Calculating Expected Value from a Probability Table
Worked Example: Number of Customers
A small shop records the number of customers arriving during a particular five-minute period.
Let X represent the number of customers.
|
X |
P(X = x) |
xP(X = x) |
|---|---|---|
|
0 |
0.10 |
0 |
|
1 |
0.20 |
0.20 |
|
2 |
0.40 |
0.80 |
|
3 |
0.20 |
0.60 |
|
4 |
0.10 |
0.40 |
Calculate the expected number of customers.
E(X) = 0 + 0.20 + 0.80 + 0.60 + 0.40
E(X) = 2
The expected number of customers is 2 per five-minute period.
This does not mean exactly two customers will arrive every five minutes. Some periods may have no customers, while others may have four.

Understanding Variance
Expected value tells us the centre of a probability distribution, but it does not describe how spread out the possible outcomes are.
Consider two games.
Game A: A player always receives $5.
Game B: A player has a 50% chance of receiving $0 and a 50% chance of receiving $10.
Both games have the same expected value:
E(A) = $5
E(B) = 0(0.5) + 10(0.5) = $5
However, the outcomes are very different.
Game A always produces the same result.
Game B produces either $0 or $10.
Game B therefore has greater variability.
Variance measures the average squared distance of the possible values from the expected value, weighted by their probabilities.
A larger variance indicates that outcomes tend to be more spread out.
A smaller variance indicates that outcomes tend to be closer to the expected value.
The Variance Formula
For a discrete random variable X:
Var(X) = Σ(x − μ)²P(X = x)
where:
-
Var(X) is the variance of X.
-
x is a possible value.
-
μ = E(X) is the expected value.
-
P(X = x) is the probability of that value.
The expression:
(x − μ)
represents the difference between a value and the mean.
Squaring the difference ensures that negative and positive deviations do not cancel each other.
Steps for Calculating Variance
-
Calculate the expected value, μ.
-
Subtract μ from each possible value.
-
Square each difference.
-
Multiply each squared difference by its probability.
-
Add the results.
Worked Example: Variance of a Simple Distribution
Suppose X has the following probability distribution:
|
X |
P(X = x) |
|---|---|
|
1 |
0.25 |
|
2 |
0.50 |
|
3 |
0.25 |
Step 1: Calculate the Expected Value
E(X) = 1(0.25) + 2(0.50) + 3(0.25)
= 0.25 + 1.00 + 0.75
μ = 2
Step 2: Calculate Squared Deviations
|
X |
P(X = x) |
x − μ |
(x − μ)² |
(x − μ)²P(X = x) |
|---|---|---|---|---|
|
1 |
0.25 |
−1 |
1 |
0.25 |
|
2 |
0.50 |
0 |
0 |
0 |
|
3 |
0.25 |
1 |
1 |
0.25 |
Step 3: Add the Weighted Squared Deviations
Var(X) = 0.25 + 0 + 0.25
Var(X) = 0.5
The variance is 0.5.
This indicates that the outcomes have some spread around the expected value of 2.
An Alternative Formula for Variance
Variance can also be calculated using a shorter formula:
Var(X) = E(X²) − [E(X)]²
where:
E(X²) = Σx²P(X = x)
This formula is often more efficient when working with probability tables.
Worked Example: Using the Alternative Formula
Use the distribution:
|
X |
P(X = x) |
|---|---|
|
1 |
0.25 |
|
2 |
0.50 |
|
3 |
0.25 |
We already know:
E(X) = 2
Calculate E(X²):
E(X²) = 1²(0.25) + 2²(0.50) + 3²(0.25)
= 0.25 + 2.00 + 2.25
= 4.5
Now calculate variance:
Var(X) = 4.5 − 2²
= 4.5 − 4
Var(X) = 0.5
Both formulas produce the same answer.
Comparing Two Probability Distributions
Two distributions may have the same expected value but different variances.
Consider:
Distribution A
|
X |
Probability |
|---|---|
|
4 |
0.5 |
|
6 |
0.5 |
Distribution B
|
X |
Probability |
|---|---|
|
0 |
0.5 |
|
10 |
0.5 |
Both have expected value 5.
However:
Var(A) = (4 − 5)²(0.5) + (6 − 5)²(0.5) = 1
Var(B) = (0 − 5)²(0.5) + (10 − 5)²(0.5) = 25
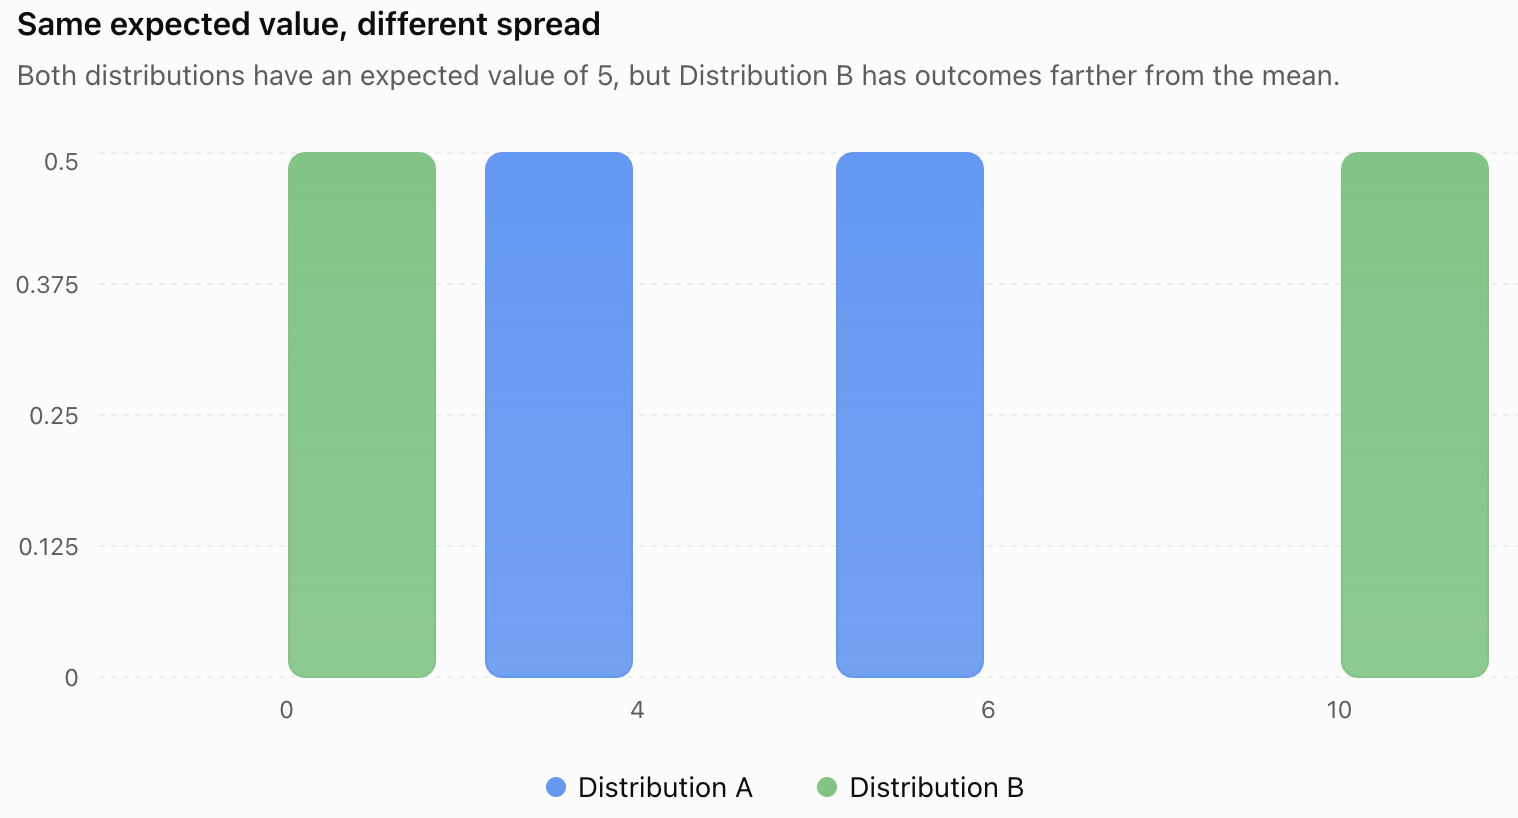
Distribution B has a much greater variance because its outcomes are farther from the mean.
This demonstrates why expected value alone does not fully describe a random variable.
Standard Deviation
The standard deviation is the positive square root of the variance.
For a random variable X:
σ = √Var(X)
where σ (sigma) represents the standard deviation.
Standard deviation measures the spread of outcomes around the mean.
Unlike variance, standard deviation is expressed in the same units as the original variable.
For example:
-
If X is measured in dollars, standard deviation is measured in dollars.
-
If X is measured in seconds, standard deviation is measured in seconds.
-
If X is measured in metres, standard deviation is measured in metres.
Variance, by contrast, is expressed in squared units.
Worked Example: Standard Deviation
Suppose:
Var(X) = 9
Then:
σ = √9
σ = 3
If X represents the number of customers, the standard deviation is 3 customers.
Calculating Standard Deviation from a Distribution
Consider the distribution:
|
X |
P(X = x) |
|---|---|
|
1 |
0.25 |
|
2 |
0.50 |
|
3 |
0.25 |
We previously calculated:
E(X) = 2
Var(X) = 0.5
Therefore:
σ = √0.5
σ ≈ 0.707
The standard deviation is approximately 0.71.
Interpreting the Result
The possible values are relatively close to the expected value of 2.
A standard deviation of approximately 0.71 indicates a modest spread around the mean.
Standard deviation should not be interpreted as a strict limit on how far outcomes can lie from the mean.
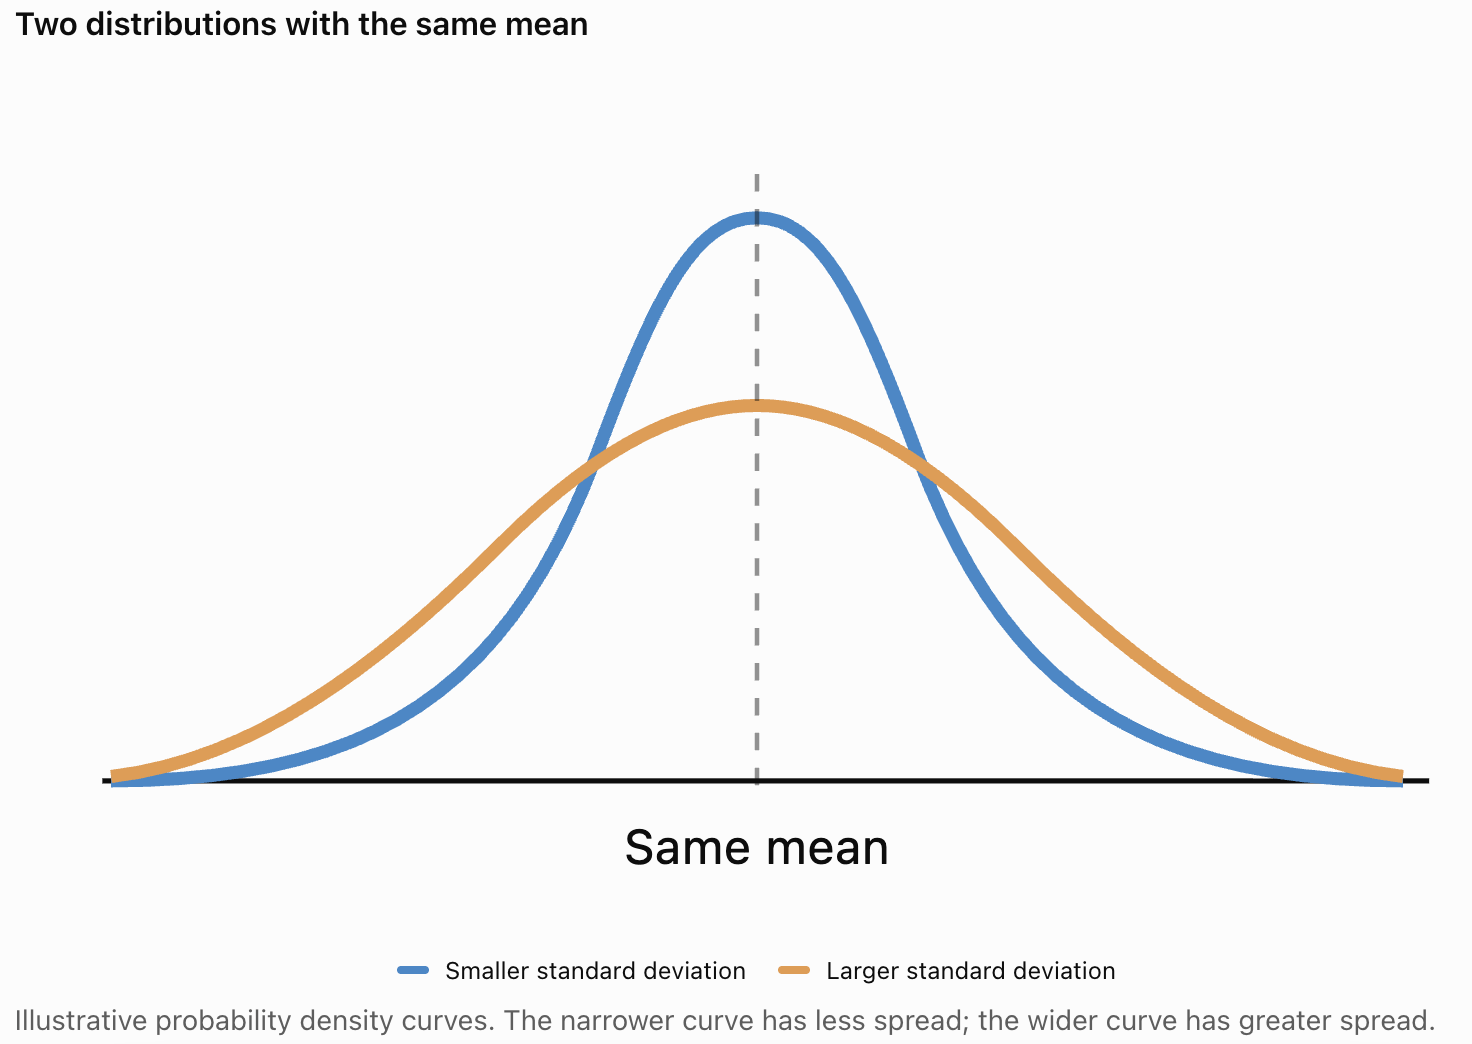
Comparing Standard Deviations
A smaller standard deviation means that values tend to cluster more closely around the mean.
A larger standard deviation means that values tend to be more widely spread.
Important Interpretation
Standard deviation describes variability, not whether an outcome is good or bad.
A high standard deviation may represent:
-
Greater uncertainty.
-
More variable results.
-
A wider range of possible outcomes.
Whether this is desirable depends on the situation.
For example, a company may prefer consistent production quality, while a researcher may be interested in naturally variable measurements.
Variance and Standard Deviation of a Fair Die
A fair six-sided die provides a useful example.
The expected value is:
E(X) = 3.5
Calculate E(X²):
E(X²) = [1² + 2² + 3² + 4² + 5² + 6²]/6
= (1 + 4 + 9 + 16 + 25 + 36)/6
= 91/6
≈ 15.1667
Calculate variance:
Var(X) = E(X²) − [E(X)]²
= 91/6 − 3.5²
= 91/6 − 12.25
Var(X) = 35/12 ≈ 2.917
Calculate standard deviation:
σ = √(35/12)
σ ≈ 1.708
Summary
For a fair six-sided die:
-
Expected value = 3.5
-
Variance ≈ 2.917
-
Standard deviation ≈ 1.708
These values describe both the centre and spread of the die's probability distribution.
Properties of Expected Value
Expected value follows several useful mathematical rules.
Adding a Constant
If a constant c is added to every possible value:
E(X + c) = E(X) + c
For example, if:
E(X) = 5
then:
E(X + 3) = 8
Multiplying by a Constant
If every possible value is multiplied by a constant a:
E(aX) = aE(X)
For example:
E(4X) = 4E(X)
Combining Both Operations
E(aX + b) = aE(X) + b
This rule is useful when converting units or transforming random variables.
Properties of Variance and Standard Deviation
Variance behaves differently from expected value.
Adding a Constant
Adding a constant to every outcome shifts the distribution but does not change its spread.
Var(X + c) = Var(X)
For example, if every employee receives a $100 increase in a particular payment, the variance of those payments remains unchanged.
Multiplying by a Constant
Multiplying every outcome by a constant changes the variance by the square of that constant.
Var(aX) = a²Var(X)
For example, if:
Var(X) = 4
then:
Var(3X) = 3² × 4
= 36
Standard Deviation
Standard deviation changes by the absolute value of the multiplier.
SD(aX + b) = |a|SD(X)
These properties are useful when changing measurement units or comparing transformed distributions.
Expected Value in Games and Gambling
Expected value can be used to determine whether a game is mathematically fair.
A fair game has an expected net gain of zero.
Worked Example: A Dice Game
A player pays $4 to roll a fair six-sided die.
If the player rolls a 6, they receive $18.
Otherwise, they receive nothing.
Let X represent the player's net gain.
If the player wins:
X = 18 − 4 = $14
If the player loses:
X = −$4
The probabilities are:
P(win) = 1/6
P(lose) = 5/6
Expected value:
E(X) = 14(1/6) + (−4)(5/6)
= 14/6 − 20/6
= −6/6
E(X) = −$1
Interpretation
The player loses an average of $1 per game over many repetitions.
The game is not mathematically fair to the player.

Using Expected Value for Decision-Making
Expected value is especially useful when comparing choices involving uncertain outcomes.
Worked Example: Comparing Two Projects
A business is considering two possible projects.
Project A
-
80% probability of earning $1,000
-
20% probability of losing $500
Expected value:
E(A) = 0.80(1000) + 0.20(−500)
= 800 − 100
E(A) = $700
Project B
-
50% probability of earning $1,800
-
50% probability of losing $200
Expected value:
E(B) = 0.50(1800) + 0.50(−200)
= 900 − 100
E(B) = $800
Project B has the higher expected profit.
However, we should also compare the variance and standard deviation.
Comparing Risk Using Variance
Project A
Expected value:
μ = 700
Variance:
Var(A) = (1000 − 700)²(0.80) + (−500 − 700)²(0.20)
= 300²(0.80) + (−1200)²(0.20)
= 90,000(0.80) + 1,440,000(0.20)
= 72,000 + 288,000
Var(A) = 360,000
Standard deviation:
SD(A) = √360,000
SD(A) = $600
Project B
Expected value:
μ = 800
Variance:
Var(B) = (1800 − 800)²(0.50) + (−200 − 800)²(0.50)
= 1000²(0.50) + (−1000)²(0.50)
= 500,000 + 500,000
Var(B) = 1,000,000
Standard deviation:
SD(B) = √1,000,000
SD(B) = $1,000
Comparing the Projects
|
Measure |
Project A |
Project B |
|---|---|---|
|
Expected profit |
$700 |
$800 |
|
Variance |
360,000 dollars² |
1,000,000 dollars² |
|
Standard deviation |
$600 |
$1,000 |
|
Maximum possible loss |
$500 |
$200 |
Interpretation
Project B has a higher expected profit, but also greater variability.
Project A has a lower expected profit and a smaller standard deviation.
Interestingly, Project A has a larger possible loss, despite its lower variance.
This illustrates an important point:
Standard deviation measures spread, but it does not fully describe every type of risk.
A decision-maker should consider:
-
Expected return.
-
Variability.
-
Maximum possible loss.
-
Available financial resources.
-
The consequences of an unfavourable outcome.
-
Personal or organizational risk tolerance.
Expected Value and Insurance
Insurance provides another practical application of expected value.
Suppose an insurance company estimates that a particular type of claim has:
-
A 2% probability of occurring.
-
An average payout of $5,000 if it occurs.
The expected payout per policy is:
E(X) = 0.02(5000) + 0.98(0)
E(X) = $100
The expected claim cost is $100 per policy.
An insurance company must consider this expected cost, along with administrative expenses, uncertainty, reserves, and other factors when setting premiums.

Expected Value and the Binomial Distribution
The binomial distribution describes the number of successes in a fixed number of independent trials when each trial has the same probability of success.
If:
X follows a binomial distribution with parameters n and p,
then:
E(X) = np
Var(X) = np(1 − p)
SD(X) = √[np(1 − p)]
where:
-
n is the number of trials.
-
p is the probability of success.
-
1 − p is the probability of failure.
Worked Example: Coin Tosses
A fair coin is tossed 20 times.
Let X represent the number of heads.
n = 20
p = 0.5
Expected value:
E(X) = 20 × 0.5
E(X) = 10
Variance:
Var(X) = 20 × 0.5 × 0.5
Var(X) = 5
Standard deviation:
SD(X) = √5
SD(X) ≈ 2.236
Interpretation
The expected number of heads is 10.
The standard deviation is approximately 2.24 heads, describing the typical scale of variation around the expected number.
The actual number of heads will not necessarily be 10 in every set of 20 tosses.
Understanding Measures of Spread
Expected value, variance, and standard deviation describe different aspects of a distribution.
|
Measure |
What it describes |
Units |
|---|---|---|
|
Expected value |
Centre or long-run average |
Original units |
|
Variance |
Average squared deviation from the mean |
Squared units |
|
Standard deviation |
Scale of spread around the mean |
Original units |
Small Variance and Standard Deviation
A small variance indicates that outcomes tend to be close to the expected value.
Examples include:
-
Consistent manufacturing measurements.
-
Predictable delivery times.
-
Stable daily demand.
Large Variance and Standard Deviation
A large variance indicates that outcomes tend to be more widely spread.
Examples include:
-
Highly variable sales.
-
Uncertain investment returns.
-
Inconsistent waiting times.
However, the meaning of "large" or "small" depends on the scale and context of the variable.
The Relationship Between Standard Deviation and Normal Distributions
Many naturally occurring measurements can be approximately modelled using a normal distribution.
A normal distribution has a symmetrical, bell-shaped curve.
For an exactly normal distribution:
-
Approximately 68% of values lie within one standard deviation of the mean.
-
Approximately 95% lie within two standard deviations.
-
Approximately 99.7% lie within three standard deviations.
This is known as the Empirical Rule.

Example: Test Scores
Suppose test scores are approximately normally distributed with:
Mean = 70
Standard deviation = 10
Then approximately:
-
68% of scores lie between 60 and 80.
-
95% lie between 50 and 90.
-
99.7% lie between 40 and 100.
These percentages are approximate and apply to distributions that are normal or closely resemble a normal distribution.
They should not automatically be applied to every probability distribution.
Common Mistakes
Confusing expected value with the most likely outcome
Expected value is a weighted average, while the most likely outcome is the mode.
Assuming expected value must be a possible outcome
The expected value of a die is 3.5, even though a die cannot show 3.5.
Forgetting to multiply each value by its probability
Expected value is calculated using weighted values.
Calculating variance without first finding the mean
Variance measures spread around the expected value.
Forgetting to square deviations
Negative and positive deviations would otherwise cancel.
Confusing variance and standard deviation
Standard deviation is the square root of variance.
Using the wrong units
Variance has squared units, while standard deviation has the original units.
Assuming a larger expected value always means a better decision
Risk, possible losses, and other factors may also be important.
Assuming a larger variance always means a worse outcome
Greater variability may be acceptable or desirable in some situations.
Applying normal-distribution rules to every distribution
The 68–95–99.7 rule applies specifically to normal distributions.
Key Terms
-
Expected Value: The probability-weighted average of the possible values of a random variable.
-
Mean: The average value of a probability distribution.
-
Random Variable: A variable that assigns numerical values to outcomes of a random experiment.
-
Probability Distribution: A description of the probabilities associated with possible values of a random variable.
-
Variance: The probability-weighted average of squared deviations from the expected value.
-
Standard Deviation: The positive square root of variance.
-
Deviation: The difference between an observed or possible value and the mean.
-
Squared Deviation: The square of the difference between a value and the mean.
-
Weighted Average: An average in which values contribute according to assigned weights.
-
Spread: The extent to which values differ from one another or from the centre of a distribution.
-
Variability: The degree to which outcomes differ across observations or trials.
-
Risk: The possibility of outcomes that differ from expectations, particularly unfavourable outcomes.
-
Fair Game: A game with an expected net gain of zero for the player.
-
Long-Run Average: The average outcome approached over many repeated experiments.
-
Binomial Distribution: A distribution describing the number of successes in repeated independent trials with constant success probability.
-
Normal Distribution: A symmetrical, bell-shaped continuous probability distribution.
-
Empirical Rule: The approximate 68–95–99.7 pattern for normal distributions.
-
Risk Tolerance: The amount of uncertainty or potential loss a decision-maker is willing or able to accept.
-
Probability Model: A mathematical representation of uncertain outcomes.
-
Decision-Making Under Uncertainty: Choosing between alternatives when their outcomes are not known with certainty.
Key Takeaways
-
Expected value describes the long-run average outcome of a random variable.
-
Expected value is calculated by multiplying each possible value by its probability and adding the products.
-
Variance measures the average squared distance of outcomes from the expected value.
-
Standard deviation is the positive square root of variance.
-
Variance is measured in squared units, while standard deviation uses the original units.
-
Two distributions can have the same expected value but different variances.
-
A smaller standard deviation indicates outcomes tend to cluster more closely around the mean.
-
A larger standard deviation indicates greater variability.
-
Expected value can be used to evaluate games, business projects, insurance, and financial decisions.
-
A fair game has an expected net gain of zero.
-
Expected value alone does not fully describe risk.
-
Variance and standard deviation help compare uncertainty between different choices.
-
For a binomial distribution, E(X) = np and Var(X) = np(1 − p).
-
Adding a constant changes expected value but not variance.
-
Multiplying a random variable by a constant changes variance by the square of that constant.
-
The Empirical Rule describes how values are distributed around the mean in a normal distribution.
-
Expected value, variance, and standard deviation are essential tools in probability, statistics, and decision-making.
Check Your Understanding
Recall and Understanding
-
Define expected value and explain what it represents.
-
State the formula for calculating the expected value of a discrete random variable.
-
Explain the difference between variance and standard deviation.
-
Why are deviations squared when calculating variance?
-
Explain why two distributions can have the same expected value but different standard deviations.
Application
-
A random variable X has values 1, 2, and 3 with probabilities 0.2, 0.5, and 0.3. Calculate E(X).
-
Using the distribution in Question 6, calculate Var(X).
-
Calculate the standard deviation of the distribution in Question 6.
-
A fair six-sided die is rolled. Calculate its expected value and variance.
-
A binomial random variable has n = 12 and p = 0.25. Calculate its expected value, variance, and standard deviation.
Analysis and Challenge
-
A game costs $5 to play. A player has a 20% chance of receiving $20 and an 80% chance of receiving nothing. Calculate the expected net gain and determine whether the game is fair.
-
Two investments have the same expected return but different standard deviations. Explain how this information could influence a decision.
-
A random variable has E(X) = 8 and Var(X) = 4. Find E(3X + 2), Var(3X + 2), and SD(3X + 2).
-
A business is considering two projects. Project A has a 70% chance of earning $1,000 and a 30% chance of losing $400. Project B has a 40% chance of earning $2,000 and a 60% chance of losing $100. Calculate the expected value of each project and discuss which might be preferable.
-
Explain why expected value and standard deviation should be considered together when making decisions under uncertainty.
Final Summary
Expected value, variance, and standard deviation are fundamental tools for analysing probability distributions.
Expected value describes the long-run average outcome, while variance and standard deviation measure how widely possible outcomes are spread around that average.
By calculating these measures, students can compare probability distributions, interpret uncertainty, and evaluate decisions involving risk.
Understanding both the expected outcome and the variability of possible results provides a more complete picture than considering the average alone.
These concepts are widely used in probability, statistics, business, finance, engineering, science, and real-world decision-making.
3. Binomial Distribution
Learning outcomes
- I can identify binomial experiments.
- I can calculate binomial probabilities.
- I can determine expected values and variance.
- I can interpret binomial models.
- I can solve practical probability problems.
Binomial Distribution
Introduction to the Binomial Distribution
Many situations involve repeating an experiment and counting how many times a particular outcome occurs.
For example:
-
How many heads will appear when a coin is tossed ten times?
-
How many students will answer a multiple-choice question correctly?
-
How many defective products will be found in a sample?
-
How many basketball free throws will a player successfully make?
-
How many seeds will germinate under controlled conditions?
These situations can often be modelled using the binomial distribution.
The binomial distribution is a discrete probability distribution that describes the number of successes in a fixed number of independent trials, where each trial has two possible outcomes and the probability of success remains constant.
It is one of the most widely used probability models in mathematics, science, statistics, and decision-making.


Understanding Binomial Experiments
A binomial experiment is a random experiment that satisfies four specific conditions.
A useful way to remember these conditions is BINS.
-
B — Binary outcomes: Each trial has two possible outcomes, usually called success and failure.
-
I — Independent trials: The outcome of one trial does not affect the probability of success in another.
-
N — Number of trials fixed: The experiment contains a predetermined number of trials.
-
S — Same probability: The probability of success remains constant for every trial.
All four conditions must be satisfied for the standard binomial model to apply.
Example: Tossing a Coin
Suppose a fair coin is tossed five times.
We define:
Success = obtaining heads
Failure = obtaining tails
Check the conditions:
|
Condition |
Explanation |
|---|---|
|
Binary outcomes |
Each toss gives heads or tails |
|
Independent trials |
One toss does not affect another |
|
Fixed number |
Exactly five tosses |
|
Same probability |
P(heads) = 0.5 on every toss |
Therefore, the experiment is binomial.
Example: Rolling a Die
Suppose a fair six-sided die is rolled eight times.
Let success mean rolling a 6.
Then:
p = 1/6
q = 5/6
Each roll is independent, and the probability of rolling a 6 remains constant.
This is also a binomial experiment.
A binomial trial does not require the two outcomes to be equally likely.
Identifying Experiments That Are Not Binomial
Not every experiment involving repeated observations is binomial.
Example: Rolling Until the First Six Appears
Suppose a die is rolled until the first 6 appears.
This is not a binomial experiment because the number of trials is not fixed.
Example: Drawing Cards Without Replacement
Suppose five cards are drawn from a standard deck without replacement.
Let success mean drawing a heart.
The probability of success changes after each card is drawn because the deck changes.
The trials are not independent, so the standard binomial model is not exact.
Example: Measuring Student Heights
Suppose the heights of ten students are recorded.
Height is a continuous measurement rather than a binary outcome.
This is not a binomial experiment as stated.
However, if each student is classified as either above or not above a particular height, the outcomes become binary. Independence and constant probability would still need to be justified.
Binomial Random Variables
A binomial random variable counts the number of successes in a binomial experiment.
It is commonly represented by X.
For example, if a fair coin is tossed four times:
X = number of heads
The possible values are:
X = 0, 1, 2, 3, 4
A binomial random variable is written as:
X ~ B(n, p)
where:
-
n is the number of trials.
-
p is the probability of success on each trial.
-
X is the number of successes.
For example:
X ~ B(4, 0.5)
means that X counts successes in four independent trials, each with a success probability of 0.5.
Important Terminology
The probability of failure is commonly represented by q.
q = 1 − p
Therefore:
p + q = 1
If the probability of success is 0.7, the probability of failure is:
q = 1 − 0.7 = 0.3
The Binomial Probability Formula
The probability of obtaining exactly r successes in n independent trials is:
P(X = r) = C(n, r)pʳ(1 − p)^(n−r)
where:
-
n = total number of trials
-
r = number of successes
-
p = probability of success
-
1 − p = probability of failure
-
C(n, r) = number of ways to choose r successes from n trials
The combination formula is:
C(n, r) = n!/[r!(n − r)!]
The binomial formula combines counting and probability.
Why Does the Formula Work?
Consider three coin tosses.
We want exactly two heads.
One possible sequence is:
HHT
Its probability is:
0.5 × 0.5 × 0.5 = 0.125
However, there are three sequences containing exactly two heads:
-
HHT
-
HTH
-
THH
The number of arrangements is:
C(3, 2) = 3
Therefore:
P(X = 2) = 3 × 0.125
P(X = 2) = 0.375
The combination term counts how many sequences contain the required number of successes.
The probability terms calculate the probability of each such sequence.
Calculating Binomial Probabilities
Worked Example: Exactly Three Heads
A fair coin is tossed five times.
Find the probability of obtaining exactly three heads.
Step 1: Identify the values.
n = 5
r = 3
p = 0.5
q = 0.5
Step 2: Substitute into the formula.
P(X = 3) = C(5, 3)(0.5)³(0.5)²
Step 3: Calculate the combination.
C(5, 3) = 10
Step 4: Calculate the probability.
P(X = 3) = 10 × 0.125 × 0.25
Final answer:
P(X = 3) = 0.3125
There is a 31.25% probability of obtaining exactly three heads.

Worked Example: Basketball Free Throws
A basketball player successfully makes 80% of free throws.
Assume each attempt is independent and the success probability remains constant.
The player takes five free throws.
What is the probability of making exactly four?
Step 1: Identify the values.
n = 5
r = 4
p = 0.8
q = 0.2
Step 2: Apply the formula.
P(X = 4) = C(5, 4)(0.8)⁴(0.2)¹
Step 3: Calculate.
C(5, 4) = 5
P(X = 4) = 5 × 0.4096 × 0.2
Final answer:
P(X = 4) = 0.4096
There is a 40.96% probability that the player makes exactly four of the five free throws.
Constructing a Binomial Probability Distribution
A binomial probability distribution shows the probability of every possible number of successes.
Consider three fair coin tosses.
Let:
X = number of heads
Then:
X ~ B(3, 0.5)
The possible values are:
0, 1, 2, 3
Calculate each probability.
P(X = 0) = C(3, 0)(0.5)⁰(0.5)³ = 0.125
P(X = 1) = C(3, 1)(0.5)¹(0.5)² = 0.375
P(X = 2) = C(3, 2)(0.5)²(0.5)¹ = 0.375
P(X = 3) = C(3, 3)(0.5)³(0.5)⁰ = 0.125
Probability Distribution Table
|
Number of heads, X |
Probability |
|---|---|
|
0 |
0.125 |
|
1 |
0.375 |
|
2 |
0.375 |
|
3 |
0.125 |
|
Total |
1.000 |
The probabilities add to 1, confirming that the distribution includes all possible outcomes.
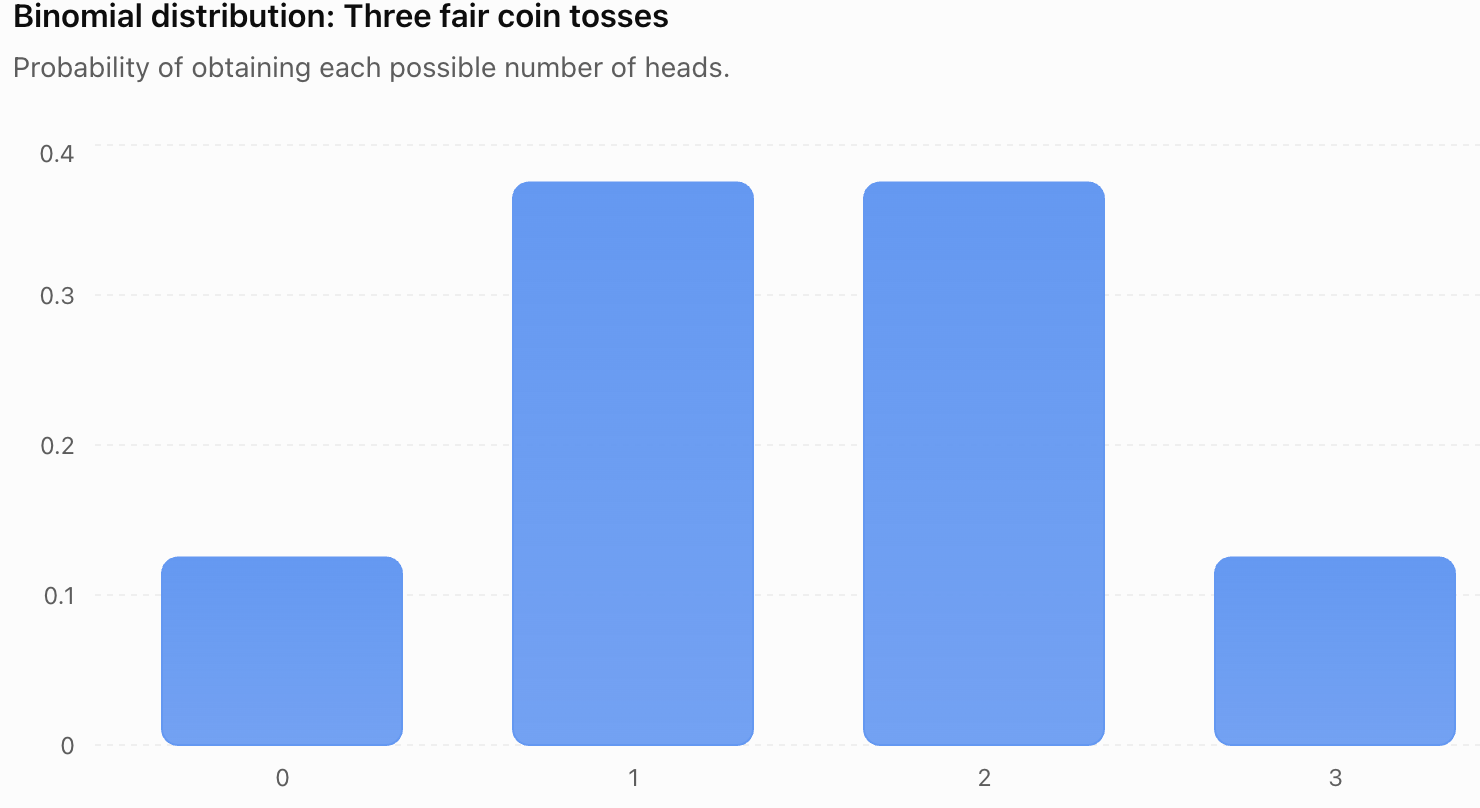
The distribution is symmetrical because p = 0.5.
Obtaining one or two heads is more likely than obtaining zero or three heads.
Exploring How Binomial Distributions Change
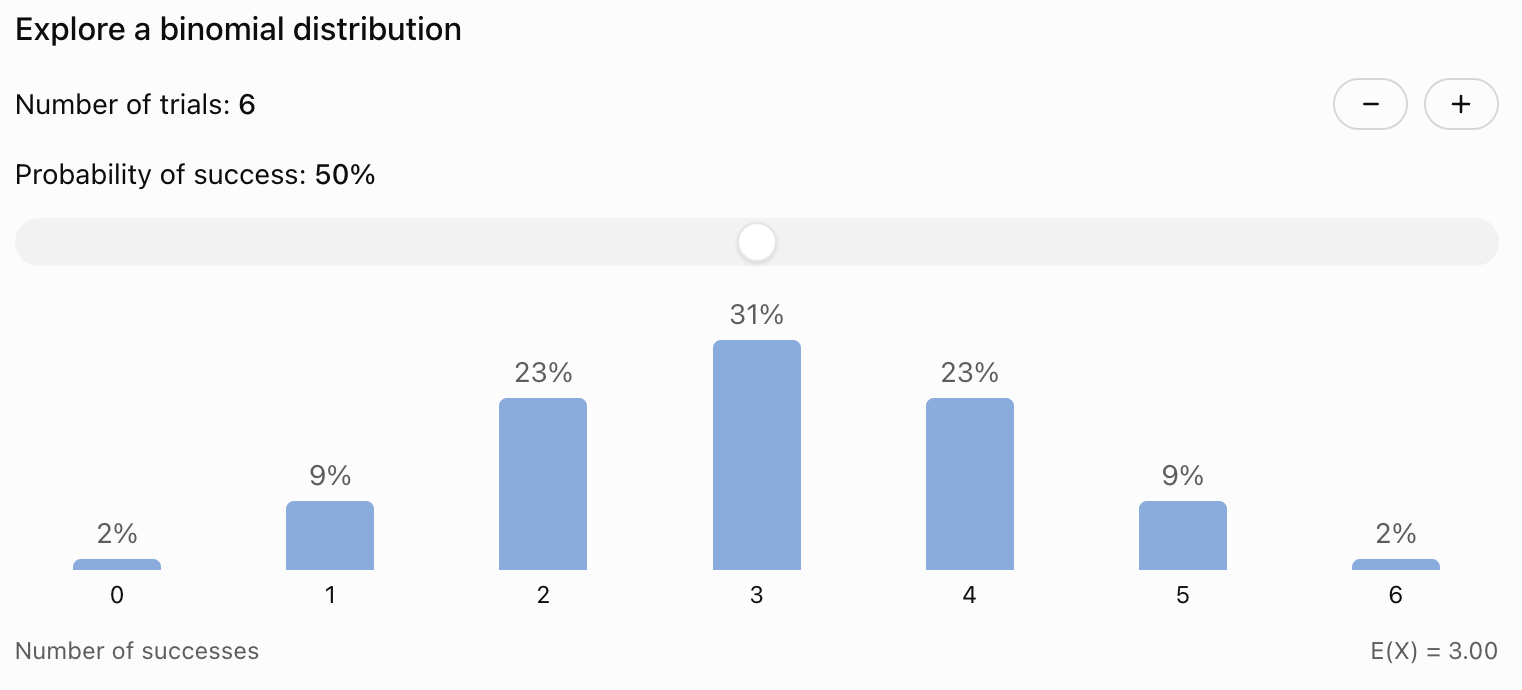
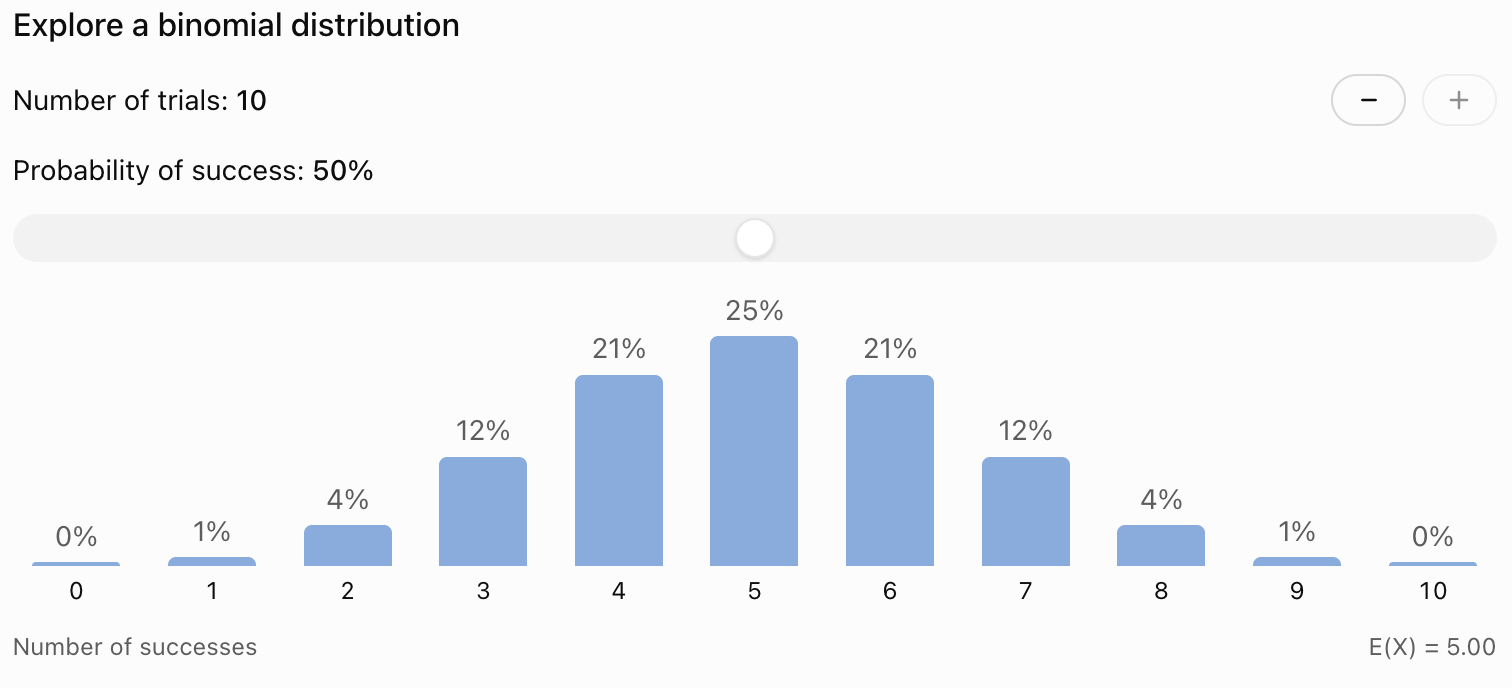
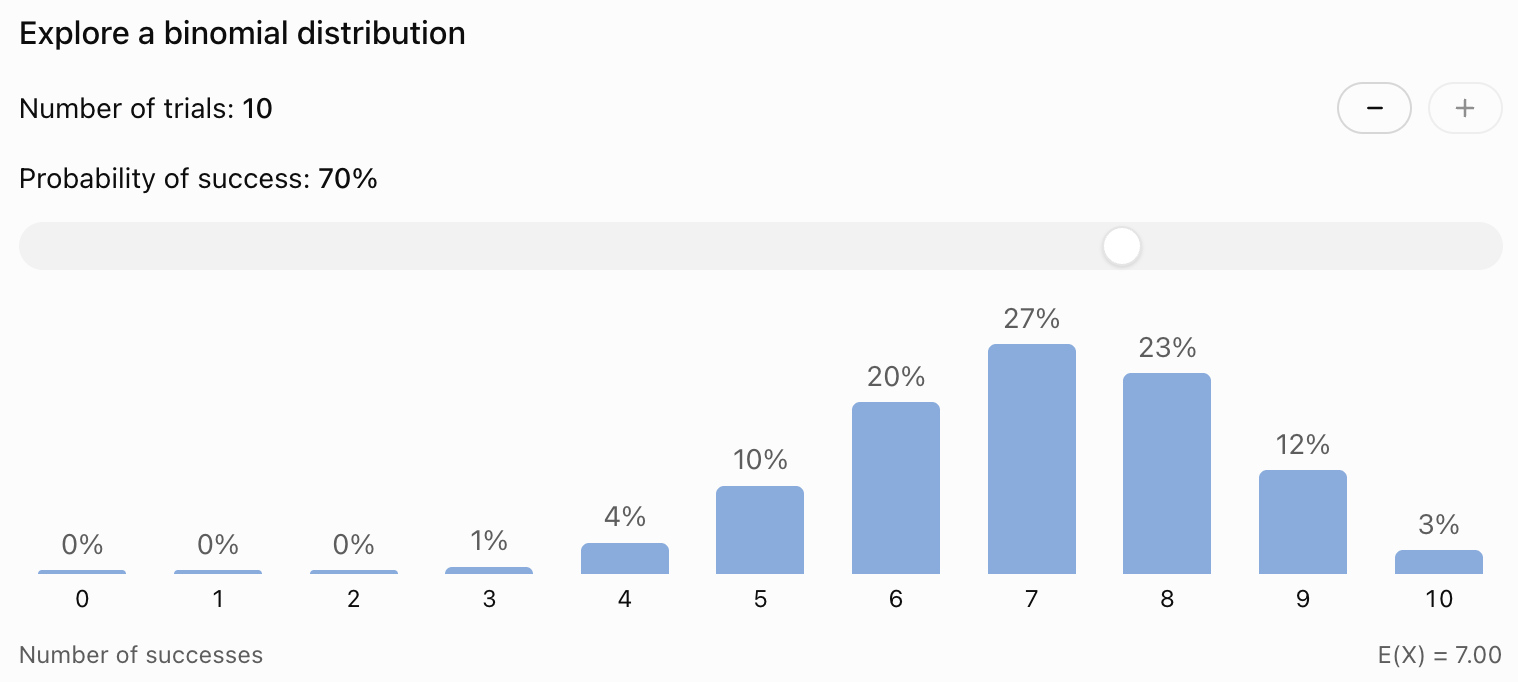
The shape of a binomial distribution depends on:
-
The number of trials, n.
-
The probability of success, p.
When p = 0.5, the distribution is symmetrical.
When p is small, most of the probability is concentrated toward lower numbers of successes.
When p is large, most of the probability is concentrated toward higher numbers of successes.
Calculating Probabilities for More Than One Outcome
Binomial problems often ask for probabilities involving several possible numbers of successes.
Common expressions include:
-
Exactly r successes: P(X = r)
-
At most r successes: P(X ≤ r)
-
Fewer than r successes: P(X < r)
-
At least r successes: P(X ≥ r)
-
More than r successes: P(X > r)
It is important to interpret these expressions correctly.
At Most
"At most three successes" means:
X ≤ 3
This includes:
0, 1, 2, or 3 successes.
At Least
"At least three successes" means:
X ≥ 3
This includes:
3, 4, 5, ... up to n successes.
More Than
"More than three successes" means:
X > 3
This begins at four successes.
Fewer Than
"Fewer than three successes" means:
X < 3
This includes zero, one, or two successes.
Worked Example: At Most Two Successes
A fair coin is tossed four times.
Find the probability of obtaining at most two heads.
Let:
X ~ B(4, 0.5)
We want:
P(X ≤ 2)
Therefore:
P(X ≤ 2) = P(X = 0) + P(X = 1) + P(X = 2)
Calculate:
P(X = 0) = 1/16
P(X = 1) = 4/16
P(X = 2) = 6/16
Add:
P(X ≤ 2) = 1/16 + 4/16 + 6/16
= 11/16
P(X ≤ 2) = 0.6875
There is a 68.75% probability of obtaining at most two heads.
Complementary Probability
Sometimes it is easier to calculate the probability of the opposite event and subtract it from 1.
The complementary probability rule is:
P(A) = 1 − P(not A)
This is particularly useful for binomial problems involving "at least one" or "at least r."
Worked Example: At Least One Success
A machine produces defective items with probability 0.05.
Assume defects occur independently.
Five items are selected.
What is the probability that at least one is defective?
Let:
X = number of defective items
n = 5
p = 0.05
We want:
P(X ≥ 1)
Instead of calculating five separate probabilities, use the complement.
P(X ≥ 1) = 1 − P(X = 0)
P(X = 0) = C(5, 0)(0.05)⁰(0.95)⁵
= 0.95⁵
≈ 0.7738
Therefore:
P(X ≥ 1) = 1 − 0.7738
P(X ≥ 1) ≈ 0.2262
There is approximately a 22.62% probability that at least one item is defective.

Worked Example: At Least Four Successes
A student answers five independent true-or-false questions by guessing.
Each question has a 50% probability of being answered correctly.
Find the probability of answering at least four correctly.
Let:
X ~ B(5, 0.5)
We want:
P(X ≥ 4)
This includes four or five correct answers.
P(X ≥ 4) = P(X = 4) + P(X = 5)
P(X = 4) = C(5, 4)(0.5)⁴(0.5)¹
= 5/32
P(X = 5) = C(5, 5)(0.5)⁵
= 1/32
Therefore:
P(X ≥ 4) = 6/32
P(X ≥ 4) = 0.1875
There is an 18.75% probability of answering at least four questions correctly by guessing.
Expected Value of a Binomial Distribution
The expected value represents the average number of successes that would be obtained over many repetitions of the experiment.
For a binomial random variable:
E(X) = np
where:
-
n is the number of trials.
-
p is the probability of success.
Worked Example: Basketball Shots
A player has a 70% probability of making each basketball shot.
The player attempts 20 shots.
Find the expected number of successful shots.
n = 20
p = 0.7
E(X) = np
= 20 × 0.7
E(X) = 14
The expected number of successful shots is 14.
This does not mean the player will make exactly 14 shots every time.
It means that over many sets of 20 attempts, the average number of successful shots would approach 14, assuming the model is accurate.
Variance of a Binomial Distribution
The variance measures how widely the number of successes tends to vary around the expected value.
For a binomial random variable:
Var(X) = np(1 − p)
or:
Var(X) = npq
where:
q = 1 − p
Worked Example: Variance of Basketball Shots
Using the previous example:
n = 20
p = 0.7
q = 0.3
Var(X) = 20 × 0.7 × 0.3
Var(X) = 4.2
The variance is 4.2 successes².
Standard Deviation of a Binomial Distribution
The standard deviation is the positive square root of the variance.
σ = √[np(1 − p)]
For the basketball example:
σ = √4.2
σ ≈ 2.05
Interpretation
The expected number of successful shots is 14.
The standard deviation is approximately 2.05 shots.
This describes the scale of variation around the expected number of successes.
A standard deviation is not a strict boundary. Results can be more than one standard deviation away from the mean.
Comparing Binomial Distributions
Consider two binomial experiments.
Experiment A
n = 20
p = 0.5
Expected value:
E(X) = 20 × 0.5 = 10
Variance:
Var(X) = 20 × 0.5 × 0.5 = 5
Standard deviation:
σ = √5 ≈ 2.24
Experiment B
n = 20
p = 0.9
Expected value:
E(X) = 20 × 0.9 = 18
Variance:
Var(X) = 20 × 0.9 × 0.1 = 1.8
Standard deviation:
σ = √1.8 ≈ 1.34
|
Measure |
Experiment A |
Experiment B |
|---|---|---|
|
Number of trials |
20 |
20 |
|
Success probability |
0.5 |
0.9 |
|
Expected successes |
10 |
18 |
|
Variance |
5 |
1.8 |
|
Standard deviation |
2.24 |
1.34 |
Experiment B has a higher expected number of successes but a smaller standard deviation.
When the probability of success is close to 0 or 1, the binomial distribution tends to be less spread out than when p is near 0.5, for the same n.
Shape of the Binomial Distribution
The shape of a binomial distribution depends on n and p.
When p = 0.5
The distribution is symmetrical.
Successes and failures are equally likely.
When p < 0.5
The distribution is generally right-skewed, with more probability concentrated toward smaller numbers of successes.
When p > 0.5
The distribution is generally left-skewed, with more probability concentrated toward larger numbers of successes.
When n Increases
As the number of trials increases, the number of possible success counts increases.
For sufficiently large n, when neither np nor n(1 − p) is too small, the binomial distribution can be approximated by a normal distribution.
This is useful for calculations involving large numbers of trials.

Using Technology to Calculate Binomial Probabilities
Scientific calculators, spreadsheets, and statistical software can calculate binomial probabilities efficiently.
Common calculator functions include:
-
binompdf(n, p, r): Calculates the probability of exactly r successes.
-
binomcdf(n, p, r): Calculates the probability of at most r successes.
Function names vary by calculator or software.
Example: Exactly Three Successes
Suppose:
n = 10
p = 0.4
r = 3
A calculator may use:
binompdf(10, 0.4, 3)
The result is approximately:
0.2150
Example: At Most Three Successes
Using the same distribution:
binomcdf(10, 0.4, 3)
The result is approximately:
0.3823
Technology is especially useful when the number of trials is large.
However, students should still understand the formula and the meaning of the results.
Practical Application: Quality Control
A factory produces electronic components.
The probability that a component is defective is 0.03.
Assume defects occur independently and the probability remains constant.
A quality-control inspector examines 20 components.
Let:
X = number of defective components
Then:
X ~ B(20, 0.03)
Expected Number of Defective Components
E(X) = np
= 20 × 0.03
E(X) = 0.6
The expected number of defective components is 0.6 per sample of 20.
Variance
Var(X) = 20 × 0.03 × 0.97
Var(X) = 0.582
Standard Deviation
σ = √0.582
σ ≈ 0.763
Probability of No Defective Components
P(X = 0) = C(20, 0)(0.03)⁰(0.97)²⁰
= 0.97²⁰
P(X = 0) ≈ 0.5438
There is approximately a 54.38% probability that all 20 components are non-defective.
Interpretation
Although the expected number of defects is less than one, some samples may contain several defects.
The binomial distribution allows the company to estimate the likelihood of different outcomes and make quality-control decisions.
Practical Application: Medical Testing
Suppose a screening test has a 90% probability of correctly identifying a particular condition in a person who has it.
Assume ten tests are conducted on different people who all have the condition, and that the test results are independent with the same sensitivity.
Let:
X = number of correctly identified cases
Then:
X ~ B(10, 0.9)
Expected Number of Correct Results
E(X) = 10 × 0.9
E(X) = 9
Probability of Exactly Nine Correct Results
P(X = 9) = C(10, 9)(0.9)⁹(0.1)¹
≈ 0.3874
P(X = 9) ≈ 0.3874
There is approximately a 38.74% probability that exactly nine of the ten cases are correctly identified.
Important Limitation
Real medical testing situations may involve different probabilities, dependent observations, or other complications.
A binomial model is appropriate only when its assumptions are reasonable.
Practical Application: Seed Germination
A scientist investigates the germination of seeds.
Under controlled conditions, each seed has an estimated 80% probability of germinating.
Assume the germination outcomes are independent.
The scientist plants 15 seeds.
Let:
X = number of seeds that germinate
Then:
X ~ B(15, 0.8)
Expected Value
E(X) = 15 × 0.8
E(X) = 12
Variance
Var(X) = 15 × 0.8 × 0.2
Var(X) = 2.4
Standard Deviation
σ = √2.4
σ ≈ 1.55
Interpretation
The scientist expects approximately 12 seeds to germinate.
However, the actual number may vary from one experiment to another.
The model helps predict likely outcomes and compare results from repeated investigations.

Evaluating Binomial Models
A mathematical model is useful only when its assumptions reasonably match the real situation.
Before applying a binomial distribution, consider the following questions.
Are There Exactly Two Outcomes?
Each trial must be classified as success or failure.
For example, a product may be classified as defective or non-defective.
Are the Trials Independent?
One trial must not affect the outcome probabilities of another.
This assumption may fail when sampling without replacement from a small population.
Is the Number of Trials Fixed?
The total number of trials must be determined before the experiment begins.
Is the Probability Constant?
The probability of success must remain the same across all trials.
For example, a basketball player's probability of making a shot may change because of fatigue, distance, or defensive pressure.
Is the Model Realistic?
Even if the conditions appear approximately satisfied, real-world factors may influence the results.
Mathematical models simplify reality, so their limitations should be considered when interpreting conclusions.
A Strategy for Solving Binomial Problems
When solving a binomial probability problem, use the following method.
Identify the experiment.
Determine what counts as one trial and what is considered a success.
Check the binomial conditions.
Confirm that the experiment satisfies BINS.
Define the random variable.
For example:
X = number of successful attempts
Identify n and p.
Determine the number of trials and the probability of success.
Interpret the question carefully.
Decide whether the question asks for exactly, at most, at least, more than, or fewer than a particular number of successes.
Choose the correct method.
Use the binomial probability formula, add relevant probabilities, or apply complementary counting.
Calculate and interpret the result.
Express the probability as a decimal, fraction, or percentage, and explain its meaning in context.
Common Mistakes
Using the binomial formula when the conditions are not satisfied
Always check that the trials are independent, the number of trials is fixed, and the success probability is constant.
Confusing n and r
n represents the total number of trials, while r represents the number of successes.
Using the wrong probability
The probability p must correspond to the event defined as success.
Forgetting the combination term
C(n, r) counts the number of different sequences containing r successes.
Confusing exactly, at least, and at most
These expressions represent different sets of outcomes.
Forgetting complementary probability
Problems involving "at least one" are often easier to solve using 1 − P(X = 0).
Assuming the expected value must be a possible outcome
An expected value of 0.6 defective components is mathematically valid.
Confusing variance with standard deviation
Standard deviation is the square root of variance.
Assuming every binomial distribution is symmetrical
Symmetry occurs when p = 0.5.
Ignoring real-world assumptions
A binomial model may not accurately describe situations involving dependence or changing probabilities.
Key Terms
-
Binomial Distribution: A discrete probability distribution describing the number of successes in a fixed number of independent trials with constant success probability.
-
Binomial Experiment: A random experiment satisfying the four binomial conditions.
-
Trial: One repetition of a random experiment.
-
Success: The outcome of interest in a binomial experiment.
-
Failure: The alternative outcome to success.
-
Independent Trials: Trials in which one outcome does not affect the probabilities of other outcomes.
-
Fixed Number of Trials: A predetermined number of repetitions.
-
Constant Probability: A success probability that remains unchanged between trials.
-
Binomial Random Variable: A variable counting the number of successes in a binomial experiment.
-
Probability Distribution: A description of the probabilities associated with possible values of a random variable.
-
Combination: A selection of objects where order does not matter.
-
Binomial Coefficient: The value C(n, r), representing the number of ways to choose r objects from n.
-
Complementary Probability: The probability that an event does not occur.
-
Cumulative Probability: The probability of obtaining a value at or below a specified value.
-
Expected Value: The long-run average number of successes.
-
Variance: A measure of how widely outcomes are spread around the expected value.
-
Standard Deviation: The positive square root of variance.
-
Symmetrical Distribution: A distribution whose probabilities mirror each other around its centre.
-
Skewed Distribution: A distribution with greater spread or a longer tail on one side.
-
Normal Approximation: A method of approximating a binomial distribution using a normal distribution when appropriate conditions are satisfied.
-
Mathematical Model: A mathematical representation of a real-world situation.
-
Probability of Success: The probability p that a trial produces the outcome of interest.
-
Probability of Failure: The probability q = 1 − p that a trial does not produce the outcome of interest.
Key Takeaways
-
The binomial distribution models the number of successes in repeated independent trials.
-
A binomial experiment must satisfy the BINS conditions: Binary outcomes, Independent trials, fixed Number of trials, and Same probability.
-
The binomial probability formula is P(X = r) = C(n, r)pʳ(1 − p)^(n−r).
-
The combination term counts the number of ways successes can be arranged among the trials.
-
The probability of failure is q = 1 − p.
-
Binomial probabilities can describe exactly, at most, at least, more than, or fewer than a specified number of successes.
-
Complementary probability is especially useful for questions involving at least one success.
-
The expected value of a binomial random variable is E(X) = np.
-
The variance is Var(X) = np(1 − p).
-
The standard deviation is σ = √[np(1 − p)].
-
The shape of a binomial distribution depends on the number of trials and the probability of success.
-
Binomial distributions are symmetrical when p = 0.5.
-
For a fixed n, the variance is greatest when p = 0.5.
-
Technology can simplify calculations involving large numbers of trials.
-
Binomial models are useful in sports, quality control, genetics, medical testing, education, and scientific experiments.
-
Binomial models should be evaluated carefully to ensure their assumptions are appropriate.
Check Your Understanding
Recall and Understanding
-
Define a binomial experiment and state its four required conditions.
-
Explain the difference between success and failure in a binomial experiment.
-
State the binomial probability formula and explain the meaning of n, r, and p.
-
Explain why combinations are used in binomial probability calculations.
-
Describe how changing p affects the shape of a binomial distribution.
Application
-
A fair coin is tossed five times. Calculate the probability of obtaining exactly three heads.
-
A basketball player makes 75% of free throws. Calculate the probability of making exactly four out of six attempts, assuming independent attempts.
-
A fair die is rolled eight times. Calculate the probability of obtaining exactly two sixes.
-
A machine produces defective items with probability 0.04. Find the probability that none of ten independently produced items is defective.
-
A binomial random variable has n = 20 and p = 0.3. Calculate its expected value, variance, and standard deviation.
Analysis and Challenge
-
A student guesses on six independent true-or-false questions. Calculate the probability of answering at least five correctly.
-
A factory produces components with a 2% defect probability. Calculate the probability that at least one of 15 independently produced components is defective.
-
A basketball player makes 80% of free throws. Compare the expected number of successful shots and standard deviation for 10 attempts and 20 attempts.
-
Explain why drawing five cards from a deck without replacement does not satisfy the standard binomial conditions. Suggest a modification that would make the experiment binomial.
-
A scientist estimates that each seed has a 70% probability of germinating independently. For 12 seeds, calculate the probability that at least ten germinate, and explain how the result could be used in planning an experiment.
Final Summary
The binomial distribution provides a systematic method for calculating probabilities involving repeated experiments with two possible outcomes.
By identifying the binomial conditions, defining the random variable, and applying the binomial probability formula, students can calculate the likelihood of different numbers of successes.
Expected value, variance, and standard deviation provide additional information about the centre and spread of the distribution.
The binomial distribution is especially useful in practical situations involving repeated independent events, such as coin tosses, sports performance, quality control, and scientific investigations.
Understanding the assumptions and limitations of binomial models is essential for interpreting results accurately and making informed decisions.
4. Geometric and Poisson Distributions
Learning outcomes
- I can identify geometric distributions.
- I can identify Poisson distributions.
- I can calculate probabilities using these models.
- I can compare different probability distributions.
- I can select appropriate probability models.
Geometric and Poisson Distributions
Introduction to Geometric and Poisson Distributions
Probability distributions allow us to describe uncertain events mathematically. Different distributions are appropriate for different types of experiments.
The binomial distribution describes the number of successes in a fixed number of independent trials. However, not every probability problem involves a fixed number of trials.
Consider two different situations:
-
A basketball player repeatedly attempts free throws until making the first successful shot.
-
A hospital records the number of emergency calls received during one hour.
The first situation involves waiting for the first success.
The second involves counting events within a fixed interval.
These situations can be modelled using two important discrete probability distributions:
-
The geometric distribution
-
The Poisson distribution
Understanding these distributions allows us to calculate probabilities, make predictions, and choose suitable mathematical models for real-world situations.


Reviewing Discrete Probability Distributions
A discrete random variable takes values from a finite or countably infinite set.
Examples include:
-
The number of successful attempts.
-
The number of customers arriving at a shop.
-
The number of defective products.
-
The number of telephone calls received.
-
The number of attempts needed to achieve a success.
A probability distribution assigns a probability to each possible value of a random variable.
For a valid discrete probability distribution:
-
Every probability must be between 0 and 1.
-
The probabilities of all possible values must add to 1.
Different probability distributions are used because different random experiments have different structures.
The Geometric Distribution
A geometric distribution describes the number of independent trials required to obtain the first success when the probability of success remains constant.
For example, suppose a student repeatedly attempts a basketball shot.
Each attempt has a 60% probability of success.
The student continues until the first successful shot.
Let X represent the number of attempts required.
The possible values are:
X = 1, 2, 3, 4, ...
The first success could occur on the first attempt, second attempt, third attempt, or any later attempt.
This is a geometric random variable.
Conditions for a Geometric Distribution
A geometric experiment must satisfy four conditions:
-
Each trial has two possible outcomes: success or failure.
-
Trials are independent.
-
The probability of success remains constant.
-
The experiment continues until the first success occurs.
Unlike the binomial distribution, the number of trials is not fixed in advance.
Geometric Distribution Notation
A geometric random variable can be written as:
X ~ Geometric(p)
where:
-
X is the number of trials until the first success.
-
p is the probability of success on each trial.
-
1 − p is the probability of failure.
For the standard geometric model, 0 < p ≤ 1.
For example:
X ~ Geometric(0.6)
means that each independent trial has a 60% probability of success.
The Geometric Probability Formula
The probability that the first success occurs on trial k is:
P(X = k) = (1 − p)^(k−1) × p
where:
-
k is the trial on which the first success occurs.
-
p is the probability of success.
-
1 − p is the probability of failure.
The formula works because the first k − 1 trials must be failures, followed by a success on trial k.
Example: First Success on the Third Attempt
Suppose a basketball player has a 60% probability of making each shot.
Find the probability that the first successful shot occurs on the third attempt.
For this to happen:
-
Attempt 1 must fail.
-
Attempt 2 must fail.
-
Attempt 3 must succeed.
The probability of failure is:
1 − 0.6 = 0.4
Therefore:
P(X = 3) = (0.4)² × 0.6
= 0.16 × 0.6
P(X = 3) = 0.096
There is a 9.6% probability that the first success occurs on the third attempt.

Constructing a Geometric Probability Distribution
Suppose the probability of success on each trial is:
p = 0.5
Let X represent the trial number of the first success.
Calculate the first five probabilities.
P(X = 1) = (0.5)⁰ × 0.5 = 0.5
P(X = 2) = (0.5)¹ × 0.5 = 0.25
P(X = 3) = (0.5)² × 0.5 = 0.125
P(X = 4) = (0.5)³ × 0.5 = 0.0625
P(X = 5) = (0.5)⁴ × 0.5 = 0.03125
|
Trial of first success, X |
Probability |
|---|---|
|
1 |
0.50000 |
|
2 |
0.25000 |
|
3 |
0.12500 |
|
4 |
0.06250 |
|
5 |
0.03125 |
The probability decreases as the number of trials increases.
The first success is most likely to occur on the first trial.
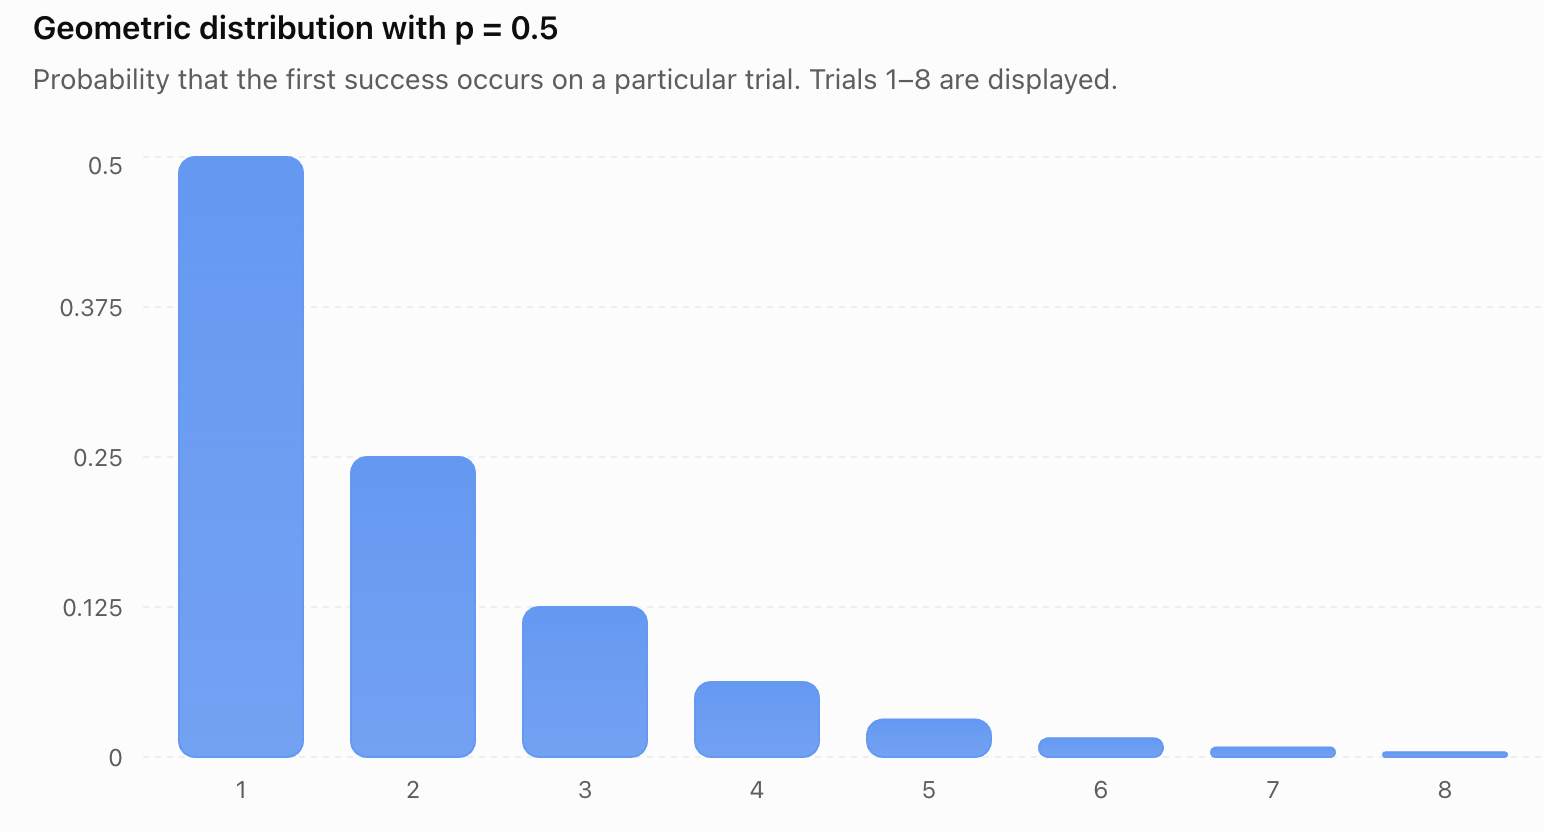
The graph shows a rapidly decreasing probability as the first success occurs later.
The probabilities continue beyond trial 8, and the sum over all possible trial numbers equals 1.
Geometric Cumulative Probabilities
Sometimes a problem asks for the probability that the first success occurs within a certain number of trials.
At Most k Trials
The probability that the first success occurs on or before trial k is:
P(X ≤ k) = 1 − (1 − p)ᵏ
This formula uses complementary probability.
The opposite event is failing on all k trials.
Worked Example: Success Within Four Attempts
A player has a 30% probability of success on each independent attempt.
Find the probability of achieving the first success within four attempts.
p = 0.3
k = 4
P(X ≤ 4) = 1 − (0.7)⁴
= 1 − 0.2401
P(X ≤ 4) = 0.7599
There is a 75.99% probability of achieving at least one success within four attempts.
More Than k Trials
The probability that more than k trials are required is:
P(X > k) = (1 − p)ᵏ
For example, if p = 0.3:
P(X > 4) = 0.7⁴
P(X > 4) = 0.2401
There is a 24.01% probability that the first four attempts all fail.
Expected Value of a Geometric Distribution
The expected value of a geometric distribution gives the average number of trials required to obtain the first success.
For the convention where X counts trials, including the successful trial:
E(X) = 1/p
Worked Example: Expected Number of Attempts
A student has a 25% probability of solving a particular type of problem correctly on each independent attempt.
Find the expected number of attempts required for the first correct answer.
p = 0.25
E(X) = 1/0.25
E(X) = 4
The expected number of attempts is four.
This does not mean the first success must occur on the fourth attempt.
It represents the long-run average number of attempts across many repetitions of the experiment.
Variance and Standard Deviation of a Geometric Distribution
For a geometric random variable counting trials until the first success:
Var(X) = (1 − p)/p²
The standard deviation is:
σ = √(1 − p)/p
Worked Example
Suppose:
p = 0.25
Expected value:
E(X) = 1/0.25 = 4
Variance:
Var(X) = 0.75/(0.25)²
= 0.75/0.0625
Var(X) = 12
Standard deviation:
σ = √12
σ ≈ 3.46
The expected number of trials is four, but the standard deviation is approximately 3.46 trials.
This indicates that the number of attempts required can vary considerably.
The Memoryless Property
One of the most interesting features of the geometric distribution is its memoryless property.
This means that previous failures do not change the probability of future success.
For a geometric random variable:
P(X > m + n | X > m) = P(X > n)
where the vertical bar means "given that."
Example: Repeated Attempts
Suppose the probability of success on each independent attempt is 0.2.
A student has already failed five times.
What is the probability of success on the next attempt?
The probability remains:
0.2
The previous failures do not change the probability of success on the next independent attempt.
The geometric distribution does not remember how many failures have already occurred.
Important Limitation
The memoryless property applies only when trials are independent and the success probability remains constant.
In real situations, learning, fatigue, equipment changes, or other factors may change the probability of success.
The Poisson Distribution
A Poisson distribution describes the number of events occurring within a fixed interval of time, space, distance, area, or another measurement.
Examples include:
-
The number of customers arriving at a shop each hour.
-
The number of telephone calls received per minute.
-
The number of typing errors on a page.
-
The number of defects in a length of material.
-
The number of meteor observations during a night.
The Poisson distribution is useful when events occur randomly at a constant average rate.


Conditions for a Poisson Distribution
A Poisson model is appropriate when:
-
Events are counted within a fixed interval or region.
-
Events occur independently.
-
The average rate of occurrence is constant across equal-sized intervals or regions.
-
Events occur singly in sufficiently small intervals, with the probability of multiple events in a tiny interval becoming negligible.
These assumptions describe an idealized random event process.
Example: Telephone Calls
Suppose a call centre receives an average of four calls per minute.
If calls arrive independently and at a constant average rate, the number of calls in a minute may be modelled using a Poisson distribution.
Let:
X = number of calls received in one minute
Then:
X ~ Poisson(4)
The parameter 4 represents the expected number of calls in the interval.
Poisson Distribution Notation
A Poisson random variable is written as:
X ~ Poisson(λ)
The symbol λ (lambda) represents the average number of events in the specified interval.
For example:
X ~ Poisson(3)
means that the expected number of events in the interval is three.
The possible values are:
X = 0, 1, 2, 3, ...
Unlike the binomial distribution, there is no fixed maximum number of events in the mathematical model.
The Poisson Probability Formula
The probability of observing exactly k events is:
P(X = k) = (e^(−λ) × λᵏ)/k!
where:
-
λ is the average number of events in the interval.
-
k is the number of events being counted.
-
e is a mathematical constant approximately equal to 2.71828.
-
k! represents factorial.
For a Poisson distribution, λ must be positive and k must be a non-negative integer.
Understanding the Formula
The formula combines:
-
The average event rate, λ.
-
The number of observed events, k.
-
The exponential factor e^(−λ).
-
The factorial k!, which accounts for the event count.
It calculates the probability of observing exactly k events in the specified interval.
Worked Example: Telephone Calls
A call centre receives an average of three calls per minute.
Assume calls follow a Poisson distribution.
Find the probability of receiving exactly two calls in one minute.
Step 1: Identify the values.
λ = 3
k = 2
Step 2: Substitute into the formula.
P(X = 2) = (e^(−3) × 3²)/2!
Step 3: Simplify.
= (e^(−3) × 9)/2
Using:
e^(−3) ≈ 0.04979
P(X = 2) ≈ (0.04979 × 9)/2
Final answer:
P(X = 2) ≈ 0.2240
There is approximately a 22.40% probability of receiving exactly two calls in one minute.
Constructing a Poisson Probability Distribution
Suppose events occur at an average rate of:
λ = 2 per interval
Then:
X ~ Poisson(2)
Calculate the probabilities for several possible values.
P(X = 0) = e^(−2) ≈ 0.1353
P(X = 1) = 2e^(−2) ≈ 0.2707
P(X = 2) = (2²e^(−2))/2! ≈ 0.2707
P(X = 3) = (2³e^(−2))/3! ≈ 0.1804
P(X = 4) = (2⁴e^(−2))/4! ≈ 0.0902
|
Number of events, X |
Probability |
|---|---|
|
0 |
0.1353 |
|
1 |
0.2707 |
|
2 |
0.2707 |
|
3 |
0.1804 |
|
4 |
0.0902 |
These probabilities do not add to 1 because outcomes greater than four have not been included.
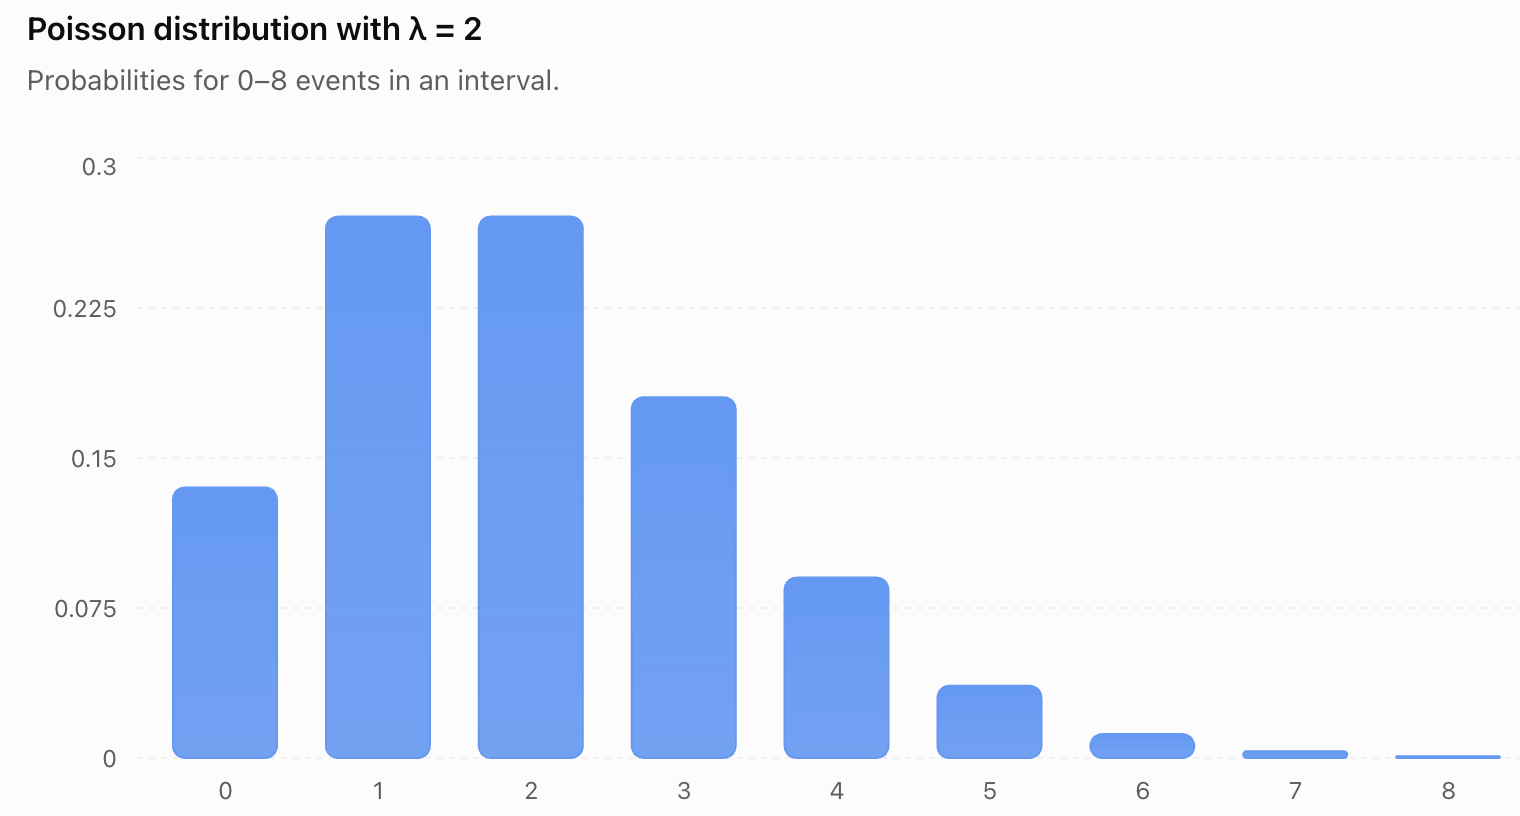
The distribution is concentrated around one and two events.
The probability decreases for larger event counts.
Expected Value and Variance of a Poisson Distribution
A useful property of the Poisson distribution is that its expected value and variance are equal.
E(X) = λ
Var(X) = λ
The standard deviation is:
σ = √λ
Worked Example
Suppose a shop receives an average of nine customers per hour, following a Poisson distribution.
λ = 9
Expected value:
E(X) = 9
Variance:
Var(X) = 9
Standard deviation:
σ = √9
σ = 3
Interpretation
The expected number of customers is nine per hour.
The standard deviation is three customers.
This describes the scale of variation in hourly customer counts under the Poisson model.
Changing the Time Interval
A Poisson model may describe events occurring at a constant average rate.
If the interval changes, the expected number of events changes proportionally.
For example, suppose a shop receives an average of six customers per hour.
Then:
-
In one hour: λ = 6
-
In 30 minutes: λ = 3
-
In two hours: λ = 12
-
In three hours: λ = 18
Worked Example: Calls in Ten Minutes
A call centre receives an average of 12 calls per hour.
Find the probability of receiving exactly three calls in ten minutes.
Step 1: Adjust λ.
Ten minutes is one-sixth of an hour.
λ = 12 × (10/60)
λ = 2
Step 2: Apply the Poisson formula.
P(X = 3) = (e^(−2) × 2³)/3!
= (e^(−2) × 8)/6
P(X = 3) ≈ 0.1804
There is approximately an 18.04% probability of receiving exactly three calls in ten minutes.
Important Reminder
Always ensure that λ corresponds to the interval stated in the question.
Using an hourly rate in a ten-minute calculation without adjustment will produce an incorrect answer.
Cumulative Poisson Probabilities
Poisson questions often ask for probabilities involving more than one possible event count.
Worked Example: At Most Two Events
Suppose:
X ~ Poisson(2)
Find:
P(X ≤ 2)
This means:
P(X = 0) + P(X = 1) + P(X = 2)
Using the values calculated earlier:
P(X ≤ 2) ≈ 0.1353 + 0.2707 + 0.2707
P(X ≤ 2) ≈ 0.6767
There is approximately a 67.67% probability of observing at most two events.
Worked Example: At Least One Event
Suppose the average number of events is:
λ = 3
Find the probability of at least one event.
Use complementary probability:
P(X ≥ 1) = 1 − P(X = 0)
P(X = 0) = e^(−3)
≈ 0.0498
Therefore:
P(X ≥ 1) = 1 − 0.0498
P(X ≥ 1) ≈ 0.9502
There is approximately a 95.02% probability of observing at least one event.
Comparing Geometric and Poisson Distributions
Although both distributions are discrete, they model different situations.
|
Feature |
Geometric |
Poisson |
|---|---|---|
|
What is counted? |
Trials until first success |
Events in a fixed interval |
|
Main parameter |
p |
λ |
|
Possible values |
1, 2, 3, ... |
0, 1, 2, 3, ... |
|
Expected value |
1/p |
λ |
|
Variance |
(1 − p)/p² |
λ |
|
Standard deviation |
√(1 − p)/p |
√λ |
|
Typical example |
Attempts until first successful shot |
Calls received per hour |
|
Main assumption |
Independent trials with constant p |
Independent events at constant average rate |
The key distinction is:
Geometric distributions count how long it takes to achieve the first success, while Poisson distributions count how many events occur in a fixed interval.
Comparing Binomial, Geometric, and Poisson Distributions
These three distributions are closely related but answer different questions.
|
Distribution |
Main question |
Parameters |
|---|---|---|
|
Binomial |
How many successes occur in a fixed number of trials? |
n, p |
|
Geometric |
How many trials are needed for the first success? |
p |
|
Poisson |
How many events occur in a fixed interval? |
λ |
Example: Basketball
A player makes each free throw with probability 0.7.
Binomial question:
How many successful shots occur in ten attempts?
Geometric question:
How many attempts are needed to make the first successful shot?
Example: Customer Arrivals
A shop receives customers randomly at an average rate of five per hour.
Poisson question:
How many customers arrive during the next hour?
The distribution depends on what is being counted.
The Poisson Approximation to the Binomial Distribution
The Poisson distribution can sometimes approximate a binomial distribution when:
-
The number of trials n is large.
-
The probability of success p is small.
-
The product np is of a manageable size.
In this situation:
λ = np
Example: Rare Defects
A factory produces 1,000 components.
Each component has a 0.002 probability of being defective.
Let X represent the number of defective components.
The exact model is:
X ~ B(1000, 0.002)
Since:
n = 1000
p = 0.002
λ = np = 2
A Poisson approximation is:
X ≈ Poisson(2)
Probability of Exactly Three Defects
P(X = 3) ≈ (e^(−2) × 2³)/3!
P(X = 3) ≈ 0.1804
This approximation is useful because the Poisson formula can be easier to calculate than a binomial formula involving a very large n.
However, the approximation is not exact, and its accuracy depends on the values of n and p.
Practical Application: Manufacturing Defects
A company produces long rolls of fabric.
On average, there are two defects per 100 metres.
Assume defects occur independently at a constant average rate.
Let X represent the number of defects in 100 metres.
Then:
X ~ Poisson(2)
Probability of No Defects
P(X = 0) = e^(−2)
P(X = 0) ≈ 0.1353
There is approximately a 13.53% probability that a 100-metre roll contains no defects.
Expected Number of Defects in 250 Metres
The expected number of defects increases proportionally with length.
λ = 2 × (250/100)
λ = 5
The expected number of defects in 250 metres is five.

Practical Application: Customer Service
A customer-service centre receives an average of eight calls per hour.
Assume calls follow a Poisson process.
Probability of No Calls in 15 Minutes
First adjust the rate.
15 minutes = 0.25 hours
λ = 8 × 0.25
λ = 2
Then:
P(X = 0) = e^(−2)
P(X = 0) ≈ 0.1353
There is approximately a 13.53% probability of receiving no calls during a 15-minute period.
This information may help the centre plan staffing and workloads.
Practical Application: Repeated Testing
A student completes independent practice questions.
Each question has a 40% probability of being answered correctly.
Let X represent the number of attempts required to obtain the first correct answer.
Then:
X ~ Geometric(0.4)
Expected Number of Attempts
E(X) = 1/0.4
E(X) = 2.5
Probability of First Success on the Fourth Attempt
P(X = 4) = (0.6)³ × 0.4
= 0.216 × 0.4
P(X = 4) = 0.0864
There is an 8.64% probability that the first correct answer occurs on the fourth attempt.
This model assumes that the student's probability of answering correctly remains constant. In a real learning situation, practice may improve performance, making the model less accurate.
Selecting an Appropriate Probability Model
When solving a probability problem, begin by identifying what the random variable counts.
Decision Guide
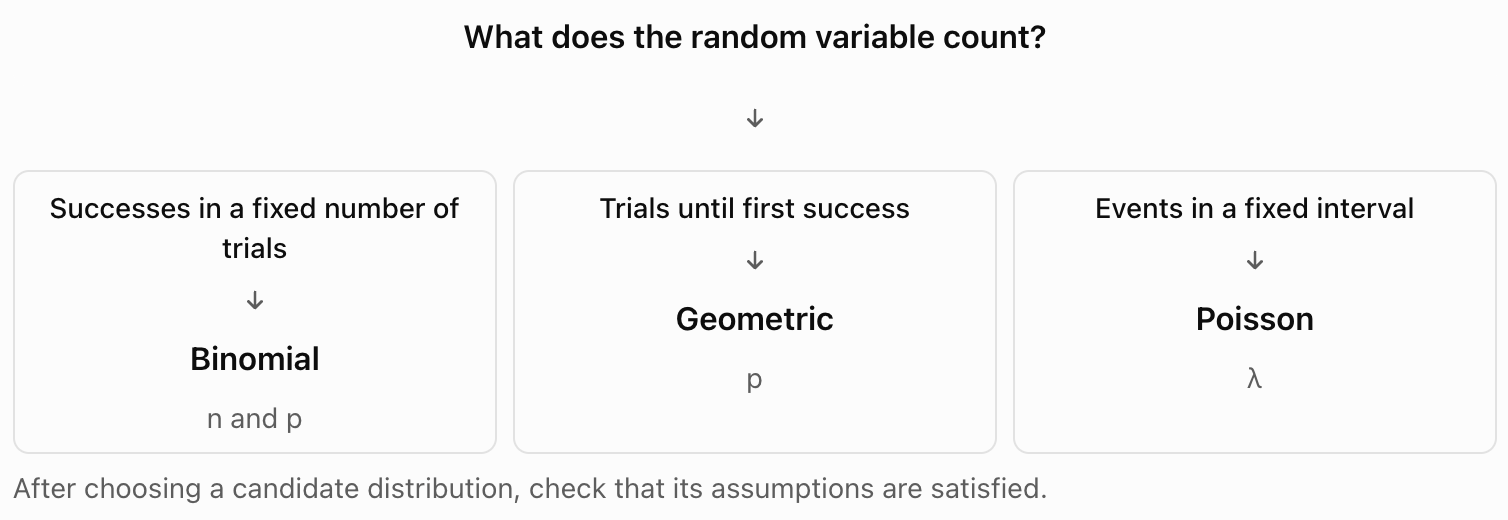
Questions to Ask
Before choosing a probability distribution, consider:
-
Is the number of trials fixed?
-
Are we counting successes or waiting for the first success?
-
Are we counting events in a time interval or region?
-
Are trials or events independent?
-
Is the success probability or average event rate constant?
The correct distribution depends on both the question and the assumptions.
Common Mistakes
Confusing geometric and binomial distributions
Binomial distributions count successes in a fixed number of trials. Geometric distributions count trials until the first success.
Using the wrong geometric formula
The formula P(X = k) = (1 − p)^(k−1)p assumes that X counts the successful trial as well as preceding failures.
Forgetting that geometric variables begin at 1
Under the trials-until-first-success convention, X cannot equal zero.
Confusing probability with average event rate
The geometric parameter p is a probability, while the Poisson parameter λ is an expected event count.
Using the wrong interval for λ
Poisson rates must be adjusted to match the interval in the question.
Forgetting factorials in the Poisson formula
The denominator k! is essential.
Confusing exactly, at most, and at least
These expressions require different probability calculations.
Forgetting complementary probability
Questions involving at least one event are often easier to solve using 1 − P(X = 0).
Assuming every event-counting situation is Poisson
The Poisson model requires appropriate independence and constant-rate assumptions.
Assuming geometric trials are always equally likely to succeed and fail
The probability of success can be any value greater than zero and at most one.
Ignoring the limitations of mathematical models
Real-world events may involve dependence, changing probabilities, or varying event rates.
Key Terms
-
Geometric Distribution: A discrete probability distribution describing the number of independent trials required to obtain the first success.
-
Poisson Distribution: A discrete probability distribution describing the number of events occurring in a fixed interval or region at a constant average rate.
-
Binomial Distribution: A distribution describing the number of successes in a fixed number of independent trials.
-
Random Variable: A variable assigning numerical values to the outcomes of a random experiment.
-
Discrete Random Variable: A random variable with a finite or countably infinite set of possible values.
-
Trial: One repetition of a random experiment.
-
Success: The outcome of interest in a probability experiment.
-
Failure: The alternative outcome to success.
-
Independent Trials: Trials in which the outcome of one does not affect the probability of another.
-
Constant Probability: A success probability that remains unchanged across trials.
-
Probability Distribution: A description of the probabilities assigned to possible values of a random variable.
-
Probability Mass Function: A function giving the probability of each possible value of a discrete random variable.
-
Expected Value: The long-run average value of a random variable.
-
Variance: A measure of the spread of outcomes around the expected value.
-
Standard Deviation: The positive square root of variance.
-
Lambda (λ): The average number of events in a specified interval for a Poisson distribution.
-
Euler's Number (e): A mathematical constant approximately equal to 2.71828.
-
Factorial: The product of all positive integers up to a given positive integer.
-
Complementary Probability: The probability that an event does not occur.
-
Cumulative Probability: The probability that a random variable falls within a specified range of values.
-
Memoryless Property: The property that previous failures do not change the conditional distribution of future waiting time in a geometric model.
-
Poisson Process: A mathematical model of events occurring independently at a constant average rate over time or space.
-
Poisson Approximation: The use of a Poisson distribution to approximate a binomial distribution when n is large and p is small.
-
Mathematical Model: A simplified mathematical representation of a real-world situation.
-
Event Rate: The average number of events occurring per unit of time, distance, area, or another measurement.
Key Takeaways
-
Geometric distributions describe the number of trials required to obtain the first success.
-
Geometric experiments involve independent trials with a constant probability of success.
-
The geometric probability formula is P(X = k) = (1 − p)^(k−1)p.
-
The expected value of a geometric distribution is E(X) = 1/p.
-
The variance of a geometric distribution is Var(X) = (1 − p)/p².
-
Geometric distributions have the memoryless property.
-
Poisson distributions describe the number of events occurring in a fixed interval or region.
-
Poisson models assume events occur independently at a constant average rate.
-
The Poisson probability formula is P(X = k) = (e^(−λ) × λᵏ)/k!.
-
The parameter λ represents the expected number of events in the specified interval.
-
For a Poisson distribution, both the expected value and variance equal λ.
-
The standard deviation of a Poisson distribution is √λ.
-
Poisson rates must be adjusted when the interval changes.
-
Complementary probability is useful for calculating probabilities involving at least one event or success.
-
The Poisson distribution can approximate a binomial distribution when n is large and p is small.
-
Binomial, geometric, and Poisson distributions answer different types of probability questions.
-
Choosing the correct probability model requires identifying what is counted and checking the assumptions.
-
These distributions are useful in manufacturing, customer service, science, engineering, business, and everyday decision-making.
Check Your Understanding
Recall and Understanding
-
Define a geometric distribution and explain when it is appropriate.
-
State the formula for calculating geometric probabilities.
-
Define a Poisson distribution and explain the meaning of λ.
-
State the formula for calculating Poisson probabilities.
-
Explain the main differences between binomial, geometric, and Poisson distributions.
Application
-
A basketball player has a 70% probability of making each independent shot. Calculate the probability that the first successful shot occurs on the fourth attempt.
-
A student has a 20% probability of answering each independent question correctly. Calculate the expected number of attempts required for the first correct answer.
-
A call centre receives an average of four calls per minute. Assuming a Poisson model, calculate the probability of receiving exactly two calls in one minute.
-
A shop receives an average of six customers per hour. Calculate the probability of receiving no customers in a 30-minute period, assuming a Poisson process.
-
A geometric random variable has p = 0.4. Calculate its expected value, variance, and standard deviation.
Analysis and Challenge
-
A student has a 30% probability of success on each independent attempt. Calculate the probability of achieving the first success within five attempts.
-
A factory produces an average of three defects per 100 metres of material. Assuming a Poisson process, calculate the probability of finding at least one defect in 50 metres.
-
A call centre receives an average of eight calls per hour. Calculate the probability of receiving at most two calls in 15 minutes.
-
A factory produces 500 items, each with an independent defect probability of 0.004. Explain why a Poisson approximation may be appropriate and use it to estimate the probability of exactly three defective items.
-
For each of the following situations, identify the most appropriate distribution and justify your choice:
-
The number of successful free throws in ten attempts.
-
The number of attempts required to make the first successful free throw.
-
The number of customers arriving at a shop during one hour.
Final Summary
Geometric and Poisson distributions extend our ability to model uncertain events beyond experiments involving a fixed number of trials.
The geometric distribution describes the number of attempts required to achieve the first success, while the Poisson distribution describes the number of events occurring within a fixed interval or region.
By understanding their formulas, expected values, variances, and assumptions, students can calculate probabilities and interpret the results in practical situations.
Comparing geometric, Poisson, and binomial distributions is an important step toward selecting appropriate probability models.
These concepts provide a foundation for advanced probability, statistics, scientific modelling, risk analysis, and real-world decision-making.
5. Continuous Probability Distributions
Learning outcomes
- I can distinguish continuous probability models.
- I can interpret probability density functions.
- I can calculate probabilities over intervals.
- I can compare discrete and continuous models.
- I can solve practical probability problems.
Continuous Probability Distributions
Introduction to Continuous Probability Distributions
Many situations involve measurements that can take any value within a range.
For example:
-
The height of a student.
-
The time required to complete a race.
-
The mass of a manufactured product.
-
The temperature of a liquid.
-
The lifetime of a battery.
-
The amount of rainfall during a storm.
Unlike counting the number of customers or rolling a die, these situations involve quantities that can vary continuously.
A continuous probability distribution describes how probability is distributed across the possible values of a continuous random variable.
Instead of assigning probabilities to individual values, continuous distributions assign probabilities to intervals of values.
Understanding continuous probability distributions allows us to calculate the likelihood of measurements falling within particular ranges, compare different probability models, and make predictions about real-world situations.


Reviewing Random Variables
A random variable is a variable that assigns a numerical value to the outcome of a random experiment.
Random variables are generally classified as either discrete or continuous.
Discrete Random Variables
A discrete random variable takes values from a finite or countably infinite set.
Examples include:
-
Number of students absent.
-
Number of defective products.
-
Number of goals scored.
-
Number of heads in five coin tosses.
Discrete random variables usually arise from counting.
Continuous Random Variables
A continuous random variable can take any real value within an interval or collection of intervals.
Examples include:
-
Height.
-
Mass.
-
Time.
-
Distance.
-
Temperature.
Continuous random variables usually arise from measurement.
Comparing Discrete and Continuous Variables
|
Feature |
Discrete |
Continuous |
|---|---|---|
|
Typical source |
Counting |
Measuring |
|
Possible values |
Finite or countably infinite |
Values throughout intervals |
|
Example |
Number of customers |
Waiting time |
|
Probability at one value |
Can be greater than zero |
Zero |
|
Probability representation |
Probability mass function |
Probability density function |
|
Graph |
Individual bars or points |
Continuous density curve |
An important distinction is that continuous measurements are not limited to the number of decimal places shown by an instrument.
For example, a stopwatch may display 12.45 seconds, but the actual elapsed time can have greater precision.
Understanding Continuous Probability Models
A continuous probability model describes how likely different ranges of values are.
Suppose X represents the time required for a student to travel to school.
Possible values might include:
12.4 minutes
12.43 minutes
12.437 minutes
12.4372 minutes
Because infinitely many values are possible within an interval, it is not useful to assign a separate positive probability to every exact value.
Instead, probabilities are calculated over intervals.
For example:
-
P(10 ≤ X ≤ 15)
-
P(X > 20)
-
P(12 < X < 18)
These expressions describe the probability that the random variable falls within a particular range.
Probability Density Functions
A probability density function, or PDF, describes how probability is distributed across the values of a continuous random variable.
It is usually written as:
f(x)
The function f(x) represents probability density, not the probability of one exact value.
Two Essential Properties
A valid probability density function must satisfy two conditions.
The density cannot be negative.
f(x) ≥ 0
The total area under the density curve must equal 1.
Total area = 1
This represents 100% of all possible outcomes.
Understanding Density
A higher density indicates that probability is more concentrated near that region.
A lower density indicates that probability is less concentrated.
However, the height of the curve is not itself a probability.
Probability is represented by area under the curve.
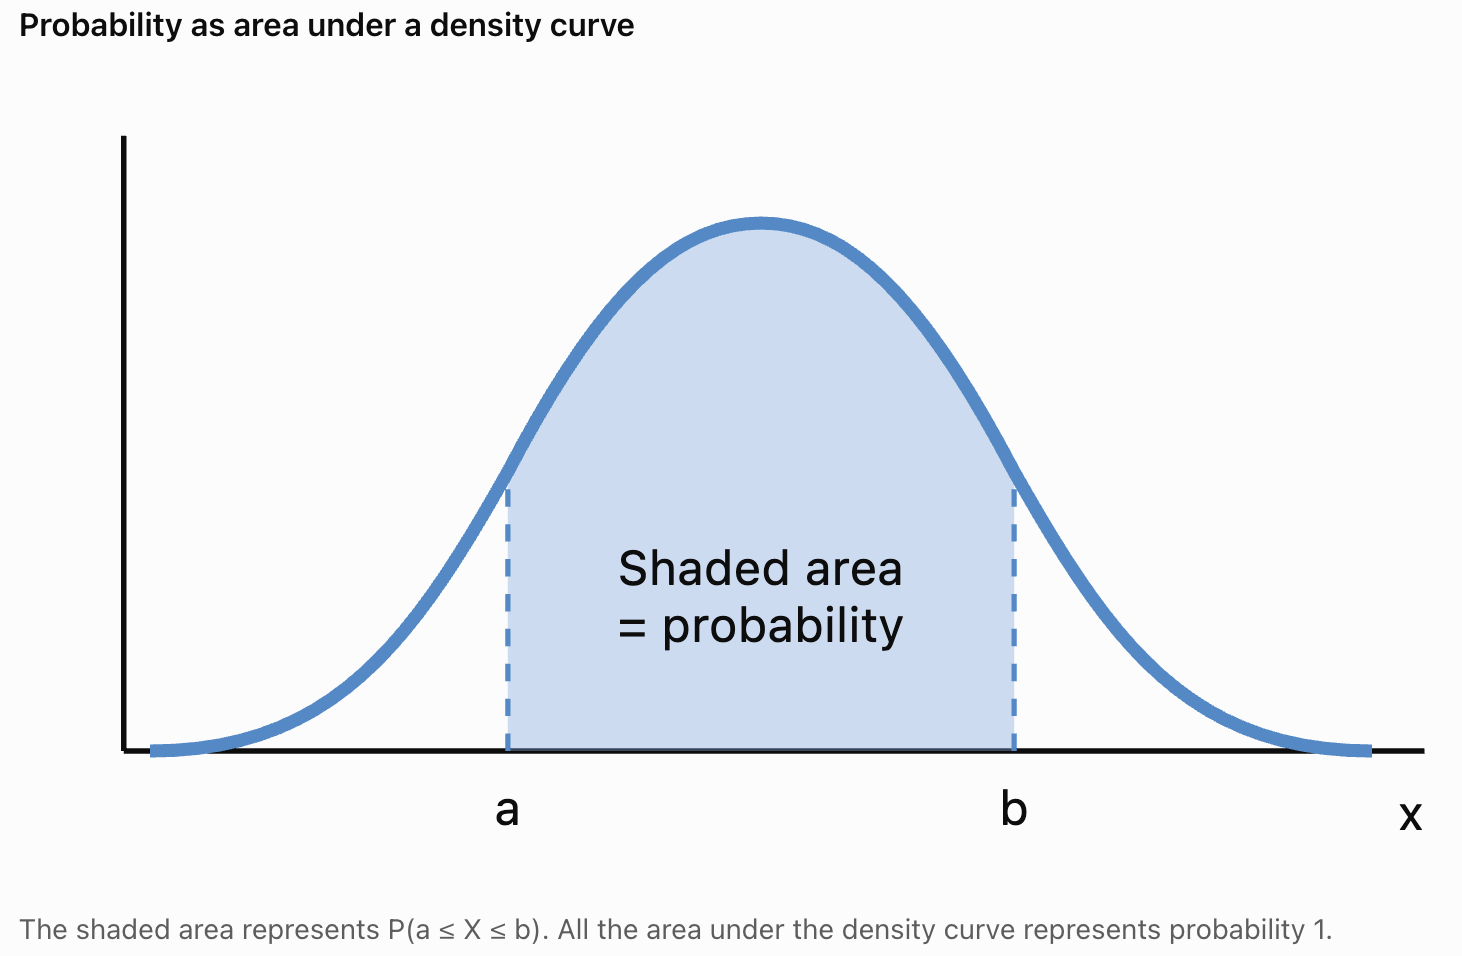
Why Exact Values Have Zero Probability
For a continuous random variable:
P(X = a) = 0
for any individual value a.
This may seem surprising.
For example, suppose X represents the height of a randomly selected student.
The probability that the student's height is exactly 170.000000... cm is zero in a continuous model.
However, the probability that the height lies between 169 cm and 171 cm can be positive.
Why?
Probability is represented by area.
A single exact value has no width, so the area associated with that value is zero.
This does not mean the value is impossible.
It means that probability must be considered over intervals.
Important Consequence
For continuous random variables:
P(a ≤ X ≤ b) = P(a < X < b)
Including or excluding the endpoints does not change the probability.
This is different from discrete probability distributions, where endpoints may contain positive probability.
Calculating Probabilities Using Area
The probability that a continuous random variable lies between a and b is the area under the density curve between those values.
In calculus notation:
P(a ≤ X ≤ b) = ∫ₐᵇ f(x) dx
The integral symbol represents the accumulation of area under the curve.
Students who have not yet studied integration can calculate probabilities using geometric areas when the density graph has a simple shape.
Common shapes include:
-
Rectangles.
-
Triangles.
-
Trapezoids.
The Continuous Uniform Distribution
A continuous uniform distribution describes a random variable whose probability density is constant across a specified interval.
This means equal-length intervals within the range have equal probabilities.
For example, suppose a bus arrives at a randomly selected time between 0 and 10 minutes.
If every arrival time in that interval is equally likely in the continuous sense, the waiting time can be modelled using a uniform distribution.
Uniform Distribution Notation
X ~ U(a, b)
where:
-
a is the minimum possible value.
-
b is the maximum possible value.
The probability density function is:
f(x) = 1/(b − a) for a ≤ x ≤ b
and:
f(x) = 0 outside this interval.
Why Does This Formula Work?
The density graph forms a rectangle.
Its width is:
b − a
Its height is:
1/(b − a)
Therefore:
Area = width × height
= (b − a) × 1/(b − a)
= 1
The total probability is exactly 1.
Worked Example: Uniform Waiting Times
A bus arrives at a uniformly random time between 0 and 10 minutes after a passenger begins waiting.
Let X represent the waiting time.
X ~ U(0, 10)
Find the probability that the passenger waits between 2 and 6 minutes.
Step 1: Determine the Total Interval
Total interval length:
10 − 0 = 10 minutes
Step 2: Determine the Favourable Interval
Favourable interval length:
6 − 2 = 4 minutes
Step 3: Calculate the Probability
For a uniform distribution:
Probability = Favourable interval length / Total interval length
P(2 ≤ X ≤ 6) = 4/10
P(2 ≤ X ≤ 6) = 0.40
There is a 40% probability that the waiting time is between two and six minutes.
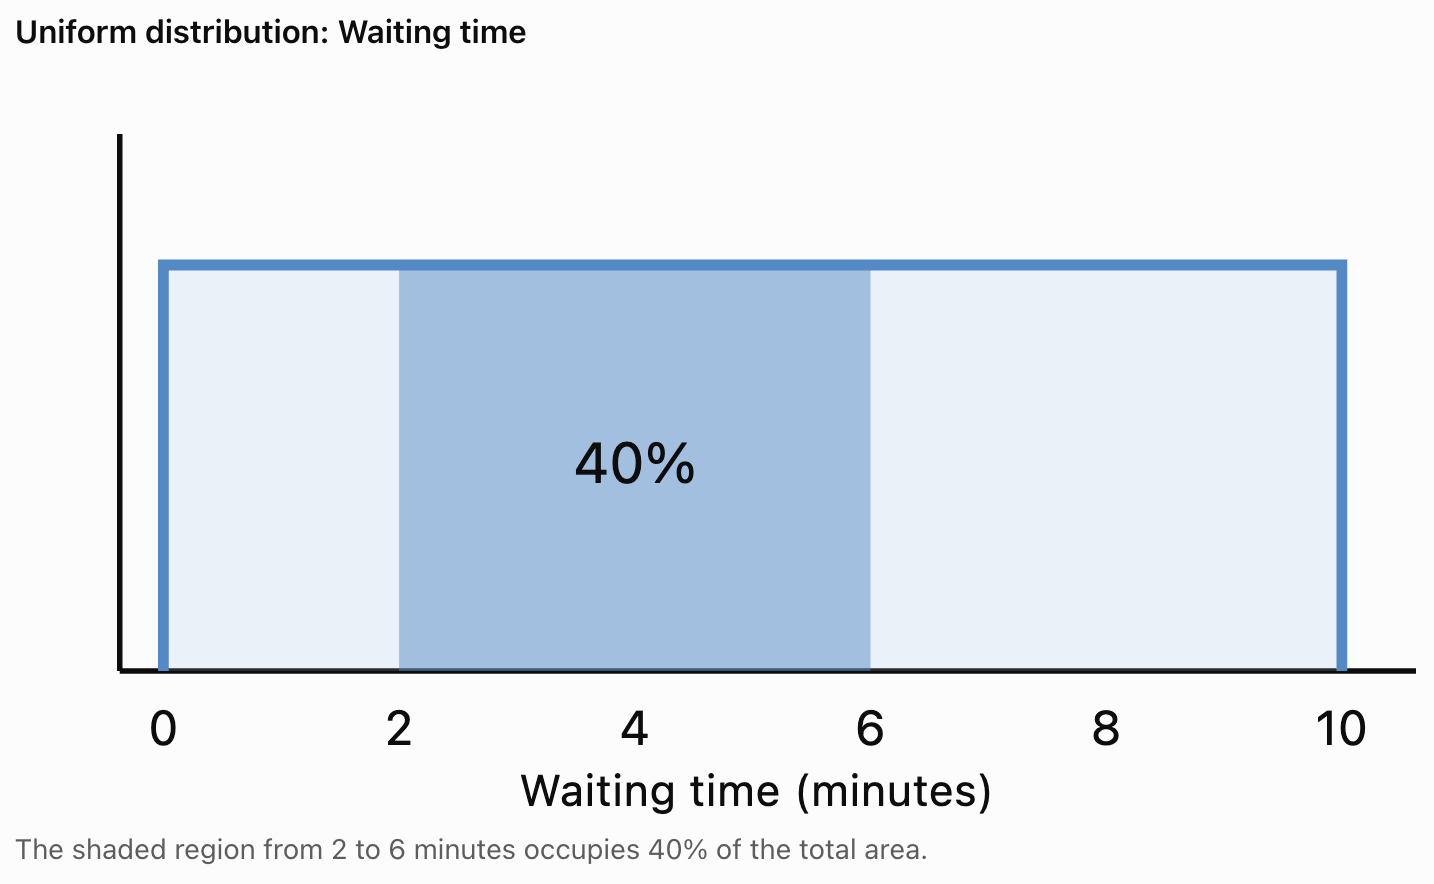
More Uniform Distribution Problems
Worked Example: Waiting Less Than Three Minutes
Suppose:
X ~ U(0, 12)
Find:
P(X < 3)
The favourable interval is from 0 to 3.
Its length is:
3 − 0 = 3
The total interval length is:
12 − 0 = 12
Therefore:
P(X < 3) = 3/12
P(X < 3) = 0.25
There is a 25% probability of waiting less than three minutes.
Worked Example: Waiting More Than Eight Minutes
Using the same distribution:
X ~ U(0, 12)
Find:
P(X > 8)
The favourable interval is from 8 to 12.
Its length is:
12 − 8 = 4
Therefore:
P(X > 8) = 4/12
P(X > 8) = 1/3 ≈ 0.3333
There is approximately a 33.33% probability of waiting more than eight minutes.
Expected Value and Variance of a Uniform Distribution
For a continuous uniform distribution:
X ~ U(a, b)
The expected value is:
E(X) = (a + b)/2
The variance is:
Var(X) = (b − a)²/12
The standard deviation is:
σ = (b − a)/√12
Worked Example
Suppose:
X ~ U(4, 16)
Expected value:
E(X) = (4 + 16)/2
E(X) = 10
Variance:
Var(X) = (16 − 4)²/12
= 144/12
Var(X) = 12
Standard deviation:
σ = √12
σ ≈ 3.46
The distribution has a mean of 10 and a standard deviation of approximately 3.46.
Non-Uniform Continuous Distributions
Not all continuous distributions have constant density.
Some values may be more common than others.
For example:
-
Adult heights may cluster around a central value.
-
Manufacturing measurements may concentrate near a target.
-
Waiting times may be more common near shorter durations.
-
Certain natural measurements may have asymmetrical distributions.
These situations require different probability density functions.
A density curve may be:
-
Symmetrical.
-
Skewed to the left.
-
Skewed to the right.
-
Uniform.
-
Bell-shaped.


The Normal Distribution
One of the most important continuous probability distributions is the normal distribution.
A normal distribution has a symmetrical, bell-shaped curve.
Its shape is determined by two parameters:
-
Mean, μ.
-
Standard deviation, σ.
The mean determines the centre of the distribution.
The standard deviation determines how spread out the values are.
Properties of the Normal Distribution
-
The curve is symmetrical around the mean.
-
The mean, median, and mode are equal.
-
The total area under the curve equals 1.
-
The curve approaches the horizontal axis without touching it.
-
Values near the mean are more common than values far from the mean.
Examples of Approximately Normal Data
Some measurements may be approximately normally distributed, including:
-
Heights within certain populations.
-
Certain measurement errors.
-
Some manufacturing dimensions.
-
Some standardized assessment scores.
However, not every real-world dataset follows a normal distribution.
The Empirical Rule
For a normal distribution:
-
Approximately 68% of values lie within one standard deviation of the mean.
-
Approximately 95% lie within two standard deviations.
-
Approximately 99.7% lie within three standard deviations.
This is known as the Empirical Rule.
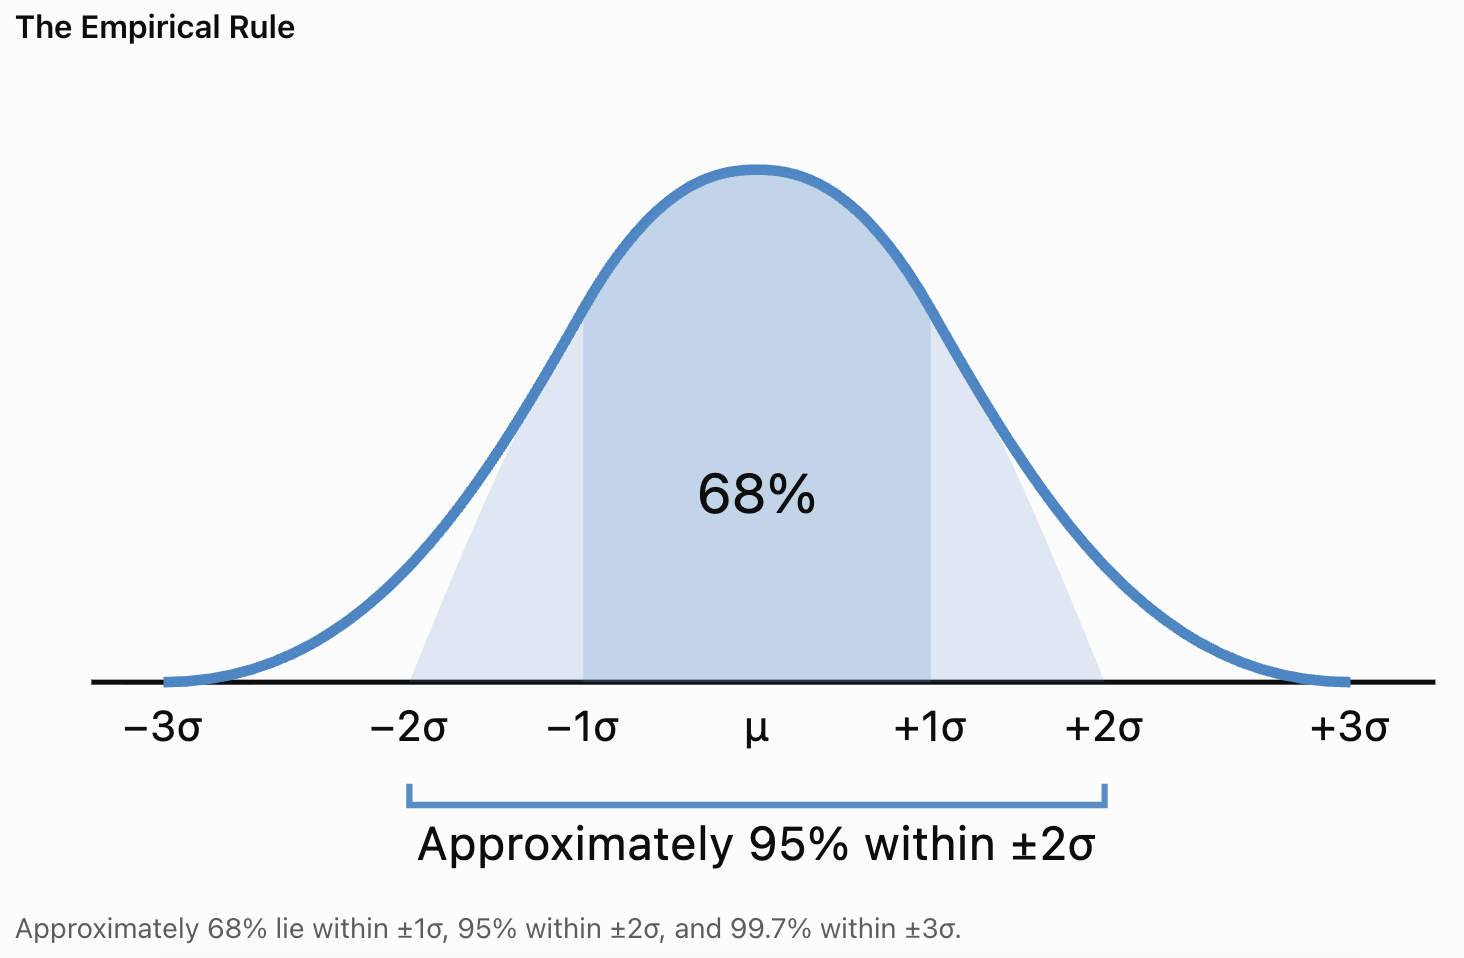
Worked Example: Normally Distributed Test Scores
Suppose examination scores are approximately normally distributed with:
Mean = 70
Standard deviation = 10
Within One Standard Deviation
Lower boundary:
70 − 10 = 60
Upper boundary:
70 + 10 = 80
Approximately 68% of students score between 60 and 80.
Within Two Standard Deviations
Lower boundary:
70 − 20 = 50
Upper boundary:
70 + 20 = 90
Approximately 95% of students score between 50 and 90.
Within Three Standard Deviations
Lower boundary:
70 − 30 = 40
Upper boundary:
70 + 30 = 100
Approximately 99.7% of students score between 40 and 100.
These are approximate results based on the normal model.
Standardizing Normal Distributions
Normal distributions can have different means and standard deviations.
To compare values from different normal distributions, we use a z-score.
The formula is:
z = (x − μ)/σ
where:
-
x is the observed value.
-
μ is the mean.
-
σ is the standard deviation.
A z-score describes how many standard deviations a value lies above or below the mean.
Interpreting z-Scores
-
z = 0 means the value equals the mean.
-
z = 1 means the value is one standard deviation above the mean.
-
z = −1 means the value is one standard deviation below the mean.
-
z = 2 means the value is two standard deviations above the mean.
Worked Example
A student scores 85 on a test.
The mean is 70, and the standard deviation is 10.
Calculate the z-score.
z = (85 − 70)/10
= 15/10
z = 1.5
The student's score is 1.5 standard deviations above the mean.
Calculating Normal Probabilities
Normal probabilities are calculated using areas under the normal curve.
Because the normal curve is not a simple geometric shape, exact probabilities usually require integration or numerical methods.
In practice, students often use:
-
Standard normal distribution tables.
-
Scientific calculators.
-
Spreadsheet software.
-
Statistical software.
Worked Example: Probability Below a Value
Suppose:
X is normally distributed with mean 100 and standard deviation 15.
Find the probability that X is less than 115.
Step 1: Calculate the z-Score
z = (115 − 100)/15
z = 1
Step 2: Use a Standard Normal Table
For z = 1:
P(Z < 1) ≈ 0.8413
Final answer:
P(X < 115) ≈ 0.8413
There is approximately an 84.13% probability that X is below 115.
Worked Example: Probability Above a Value
Using the same distribution, find:
P(X > 115)
Use complementary probability:
P(X > 115) = 1 − P(X ≤ 115)
= 1 − 0.8413
P(X > 115) ≈ 0.1587
There is approximately a 15.87% probability that X exceeds 115.
Calculating Probabilities Between Two Values
Suppose:
X is normally distributed with:
μ = 100
σ = 15
Find:
P(85 < X < 115)
Step 1: Calculate the Lower z-Score
z₁ = (85 − 100)/15
z₁ = −1
Step 2: Calculate the Upper z-Score
z₂ = (115 − 100)/15
z₂ = 1
Step 3: Use Standard Normal Probabilities
P(Z < 1) ≈ 0.8413
P(Z < −1) ≈ 0.1587
Subtract:
P(−1 < Z < 1) = 0.8413 − 0.1587
P(85 < X < 115) ≈ 0.6826
Approximately 68.26% of values lie within one standard deviation of the mean.
This agrees with the Empirical Rule.
Other Continuous Probability Models
Different continuous distributions describe different types of uncertainty.
Exponential Distribution
The exponential distribution is often used to model waiting times between events in a Poisson process.
Examples include:
-
Time between customer arrivals.
-
Time between telephone calls.
-
Waiting time until the next randomly occurring event.
For an exponential distribution with rate λ:
f(x) = λe^(−λx) for x ≥ 0
The expected waiting time is:
E(X) = 1/λ
If events occur at an average rate of four per hour, the expected waiting time between events is:
1/4 hour = 15 minutes
Triangular Distribution
A triangular distribution is sometimes used when a minimum, maximum, and most likely value can be estimated.
It can be useful for simplified modelling of project durations or uncertain measurements.
Uniform Distribution
A uniform distribution is appropriate when equal-length intervals within a range are equally likely.
Normal Distribution
A normal distribution is appropriate for certain measurements that cluster symmetrically around a mean.
The correct model depends on the characteristics of the data and the assumptions being made.

Comparing Discrete and Continuous Probability Models
Discrete and continuous distributions both describe uncertainty, but they assign probabilities differently.
Discrete Example: Rolling a Die
A fair die has six possible outcomes.
The probability of rolling exactly three is:
P(X = 3) = 1/6
This is a positive probability assigned to a single value.
Continuous Example: Measuring Height
Suppose X represents a student's height.
The probability of an exact height is:
P(X = 170 cm) = 0
However:
P(169 ≤ X ≤ 171)
may be positive.
Probability Mass Versus Probability Density
For a discrete distribution, individual outcomes can have probability mass.
For a continuous distribution, probabilities are obtained by accumulating density over intervals.
This is why discrete distributions are commonly displayed with separate bars, while continuous distributions are displayed using density curves.
Practical Application: Manufacturing
A factory manufactures metal rods with a target length of 50 cm.
Suppose rod lengths are approximately normally distributed with:
Mean = 50 cm
Standard deviation = 0.2 cm
The factory accepts rods with lengths between 49.6 cm and 50.4 cm.
Step 1: Calculate z-Scores
Lower boundary:
z₁ = (49.6 − 50)/0.2
z₁ = −2
Upper boundary:
z₂ = (50.4 − 50)/0.2
z₂ = 2
Step 2: Interpret the Interval
The accepted lengths are within two standard deviations of the mean.
Using the Empirical Rule:
Approximately 95% of rods fall within this range.
Using standard normal probabilities gives a more precise result of approximately 95.45%.
Interpretation
The company can estimate that approximately 95.45% of rods will meet the length requirement if the normal model is accurate.

Practical Application: Travel Times
Suppose a student's travel time to school is approximately normally distributed with:
Mean = 25 minutes
Standard deviation = 5 minutes
What is the probability that the journey takes longer than 30 minutes?
Step 1: Calculate the z-Score
z = (30 − 25)/5
z = 1
Step 2: Find the Probability
P(Z > 1) ≈ 0.1587
Final answer:
There is approximately a 15.87% probability that the journey takes longer than 30 minutes.
Practical Interpretation
This information can help the student decide how much extra travel time to allow.
However, actual travel times may not follow a normal distribution, particularly when traffic delays create a long right-hand tail.
The model should be checked against observed data.
Practical Application: Battery Lifetimes
Suppose battery lifetimes are approximately normally distributed with:
Mean = 100 hours
Standard deviation = 10 hours
Find the probability that a battery lasts less than 80 hours.
Step 1: Calculate the z-Score
z = (80 − 100)/10
z = −2
Step 2: Find the Probability
P(Z < −2) ≈ 0.0228
Final answer:
There is approximately a 2.28% probability that a battery lasts less than 80 hours.
This type of analysis can help manufacturers estimate reliability and warranty risks.

Selecting an Appropriate Continuous Probability Model
When choosing a continuous probability model, consider the nature of the variable.
Uniform Model
Use when values are equally likely across equal-length intervals within a fixed range.
Example:
A random arrival time uniformly distributed between 0 and 10 minutes.
Normal Model
Use when measurements are approximately symmetrical and cluster around a mean.
Example:
Certain manufacturing dimensions or measurement errors.
Exponential Model
Use when modelling waiting times between events in a constant-rate Poisson process.
Example:
Time until the next customer arrives, assuming Poisson arrivals.
Questions to Ask
-
Is the variable measured rather than counted?
-
What values are possible?
-
Is the distribution symmetrical or skewed?
-
Are there natural minimum or maximum values?
-
Does the model fit the observed data?
-
Are the model assumptions reasonable?
Selecting an appropriate distribution is an important part of mathematical modelling.
Common Mistakes
Confusing probability density with probability
The height of a density curve is not the probability of an exact outcome.
Assuming exact values have positive probability
For continuous random variables, the probability of any single exact value is zero.
Forgetting that total area equals 1
A valid probability density function must have total area 1.
Using the wrong interval length
Uniform probabilities depend on the length of the favourable interval relative to the total interval.
Confusing discrete and continuous variables
Counting usually produces discrete variables, while measurement often produces continuous variables.
Using normal-distribution rules for every dataset
Not all continuous data follow a normal distribution.
Forgetting to standardize values
Normal probability calculations often require converting values into z-scores.
Using variance instead of standard deviation
The z-score formula uses standard deviation, not variance.
Forgetting complementary probability
Probabilities above a threshold can often be calculated using 1 minus the probability below that threshold.
Ignoring model assumptions
Real-world measurements may not follow the assumed distribution.
Key Terms
-
Continuous Random Variable: A random variable that can take any real value within an interval or collection of intervals.
-
Discrete Random Variable: A random variable with a finite or countably infinite set of possible values.
-
Continuous Probability Distribution: A probability model describing how probability is distributed across continuous values.
-
Probability Density Function: A non-negative function whose area over an interval gives the probability of values falling in that interval.
-
Probability Density: The concentration of probability around a region of values.
-
Probability Mass Function: A function assigning probabilities to individual values of a discrete random variable.
-
Interval: A range of values between specified boundaries.
-
Uniform Distribution: A distribution with constant probability density across a specified interval.
-
Normal Distribution: A symmetrical, bell-shaped continuous probability distribution.
-
Exponential Distribution: A continuous distribution often used to model waiting times between events in a Poisson process.
-
Triangular Distribution: A continuous distribution with a triangular density shape.
-
Mean: The average or central value of a distribution.
-
Expected Value: The long-run average value of a random variable.
-
Variance: A measure of the average squared deviation from the mean.
-
Standard Deviation: The positive square root of variance.
-
Z-Score: The number of standard deviations a value lies above or below the mean.
-
Standard Normal Distribution: A normal distribution with mean 0 and standard deviation 1.
-
Empirical Rule: The approximate 68–95–99.7 pattern for normal distributions.
-
Cumulative Probability: The probability that a random variable is less than or equal to a specified value.
-
Complementary Probability: The probability that an event does not occur.
-
Area Under the Curve: The geometric representation of probability in a continuous distribution.
-
Probability Model: A mathematical representation of uncertain outcomes.
-
Mathematical Modelling: The process of representing real-world situations using mathematical relationships and assumptions.
Key Takeaways
-
Continuous probability distributions describe random variables that can take values across continuous intervals.
-
Continuous random variables often represent measurements such as time, height, mass, and temperature.
-
Probabilities for continuous variables are calculated over intervals rather than at individual exact values.
-
A probability density function describes how probability is distributed across possible values.
-
The total area under a probability density curve equals 1.
-
The probability of any exact value in a continuous distribution is zero.
-
Probability over an interval is represented by the area under the density curve across that interval.
-
Uniform distributions have constant density across a specified range.
-
For a uniform distribution, probabilities can be calculated using interval lengths.
-
Normal distributions are symmetrical and bell-shaped.
-
The mean determines the centre of a normal distribution, while standard deviation determines its spread.
-
The Empirical Rule describes approximate probabilities within one, two, and three standard deviations of the mean.
-
Z-scores allow values from different normal distributions to be compared.
-
Exponential distributions are useful for modelling certain waiting times.
-
Discrete distributions assign probability mass to individual values, while continuous distributions assign probability through density over intervals.
-
Continuous probability models are useful in manufacturing, transportation, science, engineering, and reliability analysis.
-
Choosing an appropriate probability model requires understanding the variable, distribution shape, and model assumptions.
Check Your Understanding
Recall and Understanding
-
Define a continuous random variable and give three examples.
-
Explain the difference between a probability mass function and a probability density function.
-
State the two conditions required for a valid probability density function.
-
Explain why the probability of an exact value is zero for a continuous random variable.
-
Describe the main characteristics of a normal distribution.
Application
-
A random variable is uniformly distributed between 0 and 20. Calculate the probability that X lies between 5 and 12.
-
A waiting time is uniformly distributed between 2 and 14 minutes. Calculate the probability that the waiting time exceeds 10 minutes.
-
For X ~ U(4, 16), calculate the expected value, variance, and standard deviation.
-
Test scores are normally distributed with mean 70 and standard deviation 10. Calculate the z-score for a score of 85.
-
A normally distributed variable has mean 100 and standard deviation 15. Find the probability that X is less than 115.
Analysis and Challenge
-
Explain why the number of students in a classroom is discrete while their heights are continuous.
-
A factory produces metal rods with lengths normally distributed around 50 cm with standard deviation 0.2 cm. Estimate the percentage of rods with lengths between 49.6 cm and 50.4 cm.
-
Travel times are normally distributed with mean 30 minutes and standard deviation 5 minutes. Calculate the probability that a journey takes longer than 40 minutes.
-
A continuous random variable has constant density between 3 and 11. Determine the density function and calculate P(5 ≤ X ≤ 9).
-
A scientist is modelling the time between radioactive decay events, the height of adult plants, and the number of defects in a manufactured product. Identify an appropriate probability distribution for each situation and justify your choices.
Final Summary
Continuous probability distributions provide a mathematical framework for analysing measurements that can take any value within a range.
Unlike discrete distributions, which assign probabilities to individual outcomes, continuous distributions use probability density functions to describe probability across intervals.
By interpreting areas under density curves, students can calculate probabilities and make predictions about uncertain measurements.
Uniform, normal, and exponential distributions are important examples of continuous probability models, each suited to different situations.
Understanding these distributions allows students to compare discrete and continuous models, select appropriate probability methods, and solve practical problems involving uncertainty in science, engineering, business, and everyday life.