Regression, Correlation, and Statistical Modelling
5. Communicating Statistical Results
Learning outcomes
- I can present statistical findings clearly.
- I can justify conclusions using evidence.
- I can create effective statistical reports.
- I can evaluate the quality of statistical investigations.
- I can apply statistical thinking to solve authentic problems.
Introduction
Imagine that a school conducts a survey to investigate whether students who sleep longer achieve higher examination scores. After collecting data from 200 students, the researchers discover a positive relationship between sleep duration and academic performance.
But how should they communicate this discovery?
Should they simply announce that students who sleep longer achieve better grades? Should they present a table containing all 200 observations? Or should they use graphs, statistical summaries, and carefully explained conclusions?
Collecting and analysing data are only part of a statistical investigation. The results must also be communicated in ways that are clear, accurate, meaningful, and supported by evidence.
Statistical communication involves selecting appropriate graphs and numerical summaries, explaining patterns, justifying conclusions, acknowledging uncertainty, and making recommendations based on reliable evidence.
These skills are essential in science, business, education, medicine, economics, environmental research, and public policy.
A well-communicated statistical investigation allows readers to understand not only what the data suggest, but also how the conclusions were reached and how much confidence should be placed in them.
The Purpose of Statistical Communication
Statistical communication is the process of presenting data, analyses, interpretations, and conclusions so that an audience can understand and evaluate them.
Effective statistical communication answers five important questions:
-
What was investigated? State the research question and purpose.
-
How was the investigation conducted? Explain the data collection and analysis methods.
-
What did the data show? Present important numerical results and visualisations.
-
What do the results mean? Interpret the findings in context.
-
How reliable are the conclusions? Discuss uncertainty, limitations, and possible sources of error.
Statistical communication should be understandable without oversimplifying or misrepresenting the evidence.
Description, interpretation, and conclusion
These three elements serve different purposes.
Consider a hypothetical investigation of study time and examination performance.
|
Element |
Example |
|---|---|
|
Description |
The correlation between study hours and examination scores was r = 0.78. |
|
Interpretation |
Students who studied longer tended to achieve higher examination scores. |
|
Conclusion |
Study time was strongly associated with examination performance, although the investigation does not establish causation. |
A statistical report should distinguish clearly between what was observed and what can reasonably be concluded.
Presenting Statistical Findings Clearly
The most effective way to present statistical information depends on the type of data, the purpose of the analysis, and the intended audience.
Choosing appropriate graphs
|
Graph type |
Best used for |
|---|---|
|
Bar chart |
Comparing frequencies or values across categories |
|
Histogram |
Showing the distribution of continuous numerical data |
|
Box plot |
Comparing medians, quartiles, and spread |
|
Scatter plot |
Investigating relationships between two numerical variables |
|
Line graph |
Showing changes over time |
|
Dot plot |
Displaying individual numerical observations |
|
Error-bar graph |
Showing estimates together with variability or uncertainty |
Graphs should make important relationships easier to understand, not simply make a report more colourful.
Example: Comparing examination results
Suppose two classes complete the same examination.
|
Statistic |
Class A |
Class B |
|---|---|---|
|
Number of students |
30 |
30 |
|
Mean score |
72 |
78 |
|
Median score |
73 |
79 |
|
Standard deviation |
10 |
7 |
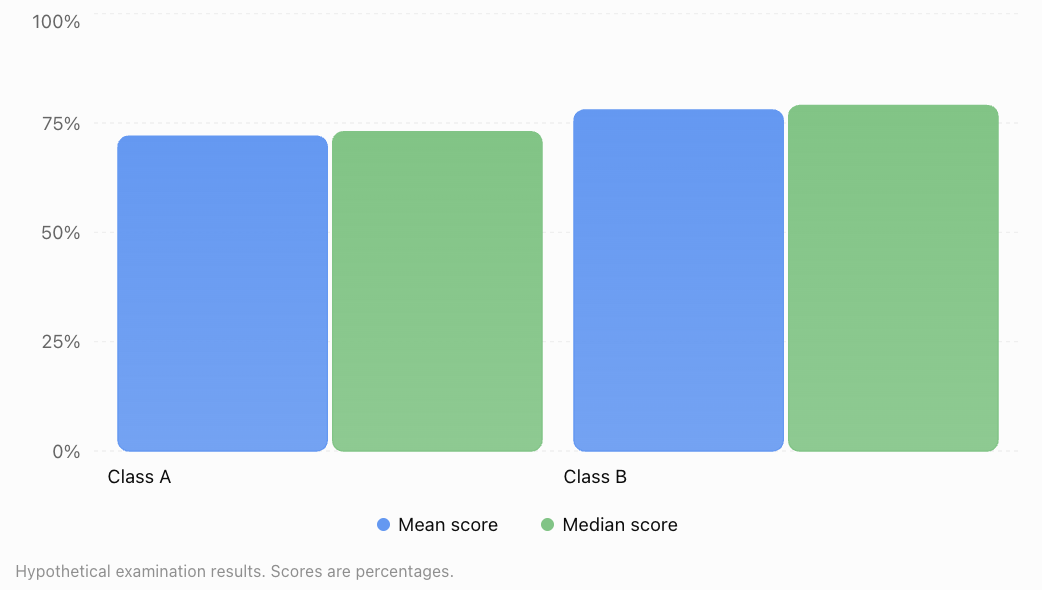
A suitable description is:
"Class B achieved a higher mean examination score (78%) than Class A (72%). Class B also had a lower standard deviation (7 compared with 10 percentage points), indicating less variation in scores as measured by standard deviation."
This statement identifies both the difference in average performance and the difference in variability.
It does not claim that Class B's teacher or teaching method caused the difference.
Principles of effective graphs
A well-designed statistical graph should:
-
Have a clear, informative title.
-
Label axes and include measurement units.
-
Use an appropriate scale.
-
Distinguish groups clearly.
-
Avoid unnecessary decoration.
-
Include sample sizes when relevant.
-
Explain uncertainty where appropriate.
-
Accurately represent the underlying data.
For bar charts, a zero baseline is generally important because bar length represents magnitude. Scatter plots and line graphs may use narrower scales when clearly labelled and appropriate.
Avoiding Misleading Statistical Visualisations
Graphs can influence how an audience interprets results.
Poor graph design may exaggerate differences, hide variation, or suggest relationships that are not supported by the data.
Example: Misleading axis scales
Suppose a company's sales increase from $100,000 to $110,000.
The actual percentage increase is:
A bar chart beginning at $95,000 could make the difference appear enormous because the second bar would be three times the visible height of the first.
A bar chart beginning at zero represents the relative magnitudes more faithfully.
Same data, different visual impressions
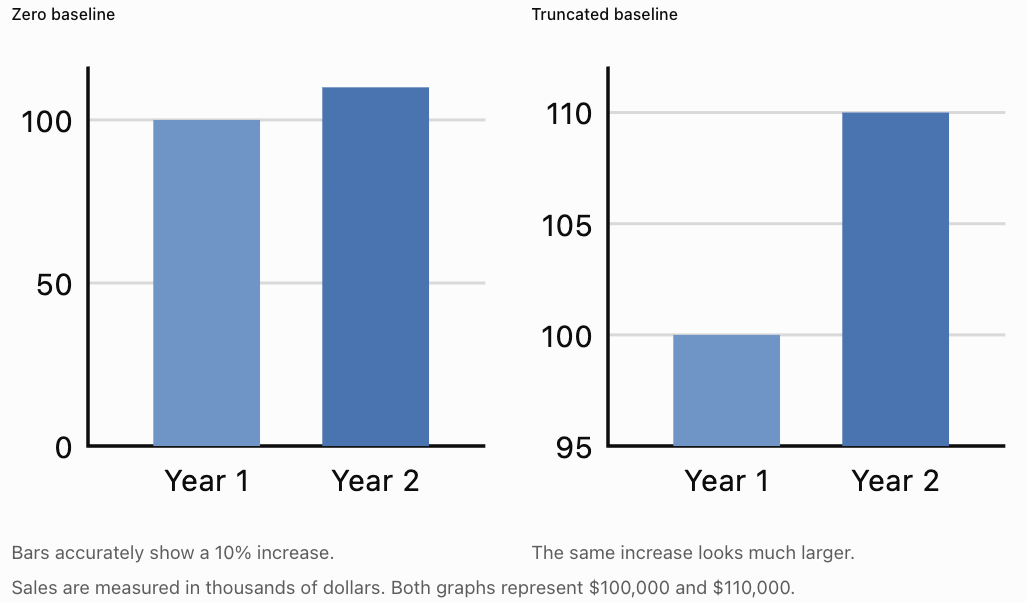
Other misleading practices include using unequal intervals on axes without explanation, presenting percentages without sample sizes, omitting relevant categories, and using three-dimensional effects that distort visual comparisons.
Justifying Conclusions Using Statistical Evidence
A statistical conclusion should follow logically from the evidence.
A strong conclusion combines:
Claim + Evidence + Statistical Reasoning + Qualification
Worked Example: Does Study Time Relate to Examination Performance?
A researcher collects data from 80 students and reports:
-
Mean study time: 4.2 hours per week.
-
Mean examination score: 74%.
-
Pearson correlation coefficient: r = 0.76.
-
Fitted regression equation: ŷ = 48 + 6.2x.
The correlation of 0.76 indicates a strong positive linear association.
The regression slope suggests that each additional study hour per week is associated with an increase of approximately 6.2 percentage points in the predicted examination score, within the model's relevant range.
A justified conclusion is:
"The investigation found a strong positive linear association between weekly study time and examination performance (r = 0.76). The fitted regression model predicted an increase of approximately 6.2 percentage points in examination score for each additional study hour per week. However, the observational study cannot establish that increasing study time causes higher scores."
This conclusion is stronger than simply stating that studying improves grades because it reports evidence and acknowledges limitations.
Statistical significance and practical significance
Statistical significance and practical importance are not the same.
A very small difference may be statistically significant in a large sample but have little real-world importance.
For example, a new teaching method might increase average examination scores by 0.4 percentage points.
Even if the difference is statistically significant, a school must consider whether such a small improvement justifies the additional cost or effort.
A good report therefore considers:
-
The estimated size of the effect.
-
The uncertainty surrounding the estimate.
-
Statistical significance where appropriate.
-
Practical importance.
-
The context in which decisions will be made.
Communicating Uncertainty
Statistical conclusions are rarely completely certain.
Data are affected by sampling variation, measurement error, missing information, and other sources of uncertainty.
Confidence intervals
A confidence interval provides a range of plausible values for an unknown population parameter using a procedure with a stated long-run coverage rate.
For example, suppose a survey estimates that 62% of students prefer online homework, with a 95% confidence interval from 57% to 67%.
A suitable interpretation is:
"The estimated proportion of students who prefer online homework is 62%, with a 95% confidence interval from 57% to 67%."
The 95% confidence level describes the long-run performance of the interval procedure, not a 95% probability assigned to the fixed population proportion after the interval has been calculated.
Margin of error
For a symmetric interval:
Using the example:
The margin of error is 5 percentage points.
The result can be presented as:
This uncertainty measure addresses sampling variability under the relevant assumptions. It does not automatically account for selection bias or inaccurate responses.
Creating Effective Statistical Reports
A statistical report should present an investigation in a logical sequence so that another person can understand and evaluate it.
Recommended report structure
|
Section |
Purpose |
|---|---|
|
Title |
Identifies the investigation |
|
Executive summary or abstract |
Summarises the purpose, methods, findings, and conclusions |
|
Introduction |
Explains the research question and context |
|
Methodology |
Describes sampling, data collection, and analysis |
|
Results |
Presents graphs, tables, and statistical calculations |
|
Discussion |
Interprets findings and compares possible explanations |
|
Limitations |
Identifies uncertainty, bias, and weaknesses |
|
Conclusion |
Answers the research question using evidence |
|
Recommendations |
Suggests justified actions or further research |
|
References and appendix |
Documents sources and supporting calculations |
Example: A short statistical report
Student Sleep and Academic Performance
Illustrative statistical investigation
Research Question
Is sleep duration associated with examination performance among secondary school students?
Methodology
A hypothetical sample of 120 students reported their average nightly sleep duration. Examination scores were obtained from a common assessment. The relationship was investigated using a scatter plot and Pearson correlation.
Results
The mean sleep duration was 7.1 hours, and the mean examination score was 73%. The correlation coefficient was r = 0.48, indicating a moderate positive linear association.
Discussion
Students reporting longer sleep duration tended to achieve higher examination scores. However, study habits, stress, health, and previous achievement may also influence academic performance.
Limitations
Sleep duration was self-reported, and the sample may not represent all secondary school students. The observational design does not establish causation.
Conclusion
The results suggest a positive association between sleep duration and examination performance in the sample. Further investigation would be needed before making causal claims.
This example illustrates how a report can communicate useful findings without overstating the evidence.
Writing Clear Statistical Explanations
Statistical language should be precise but accessible.
Compare these statements.
|
Less effective statement |
Improved statement |
|---|---|
|
Scores were better. |
The mean score increased from 68% to 75%. |
|
There was a big relationship. |
The variables showed a strong positive linear correlation (r = 0.84). |
|
The new method worked. |
Students using the new method achieved a higher mean score, although other explanations remain possible. |
|
The model was very accurate. |
The model achieved a test-set RMSE of 4.2 percentage points. |
|
The result proves the hypothesis. |
The findings provide evidence consistent with the hypothesis. |
Adapting communication to the audience
Different audiences require different levels of detail.
A school principal may want a brief explanation of examination trends and recommendations.
A statistics teacher may want the sampling method, calculations, graphs, and assumptions.
A scientific researcher may require confidence intervals, model diagnostics, and detailed methodology.
The underlying results should remain consistent, even when the level of explanation changes.
Evaluating the Quality of Statistical Investigations
A statistical investigation must be evaluated before its conclusions are accepted.
Several factors determine its quality.
Sampling quality
A representative sample should reflect the population being studied.
For example, a survey about all students at a school should not rely exclusively on members of one sports team.
Sample size
Larger samples often reduce random sampling uncertainty, but a large biased sample can still produce misleading conclusions.
Sample size alone does not guarantee quality.
Measurement reliability
Measurements should be consistent and sufficiently accurate.
A survey asking students to estimate their sleep duration from memory may contain reporting errors.
Confounding variables
A third variable may influence both the explanatory variable and the outcome.
For example, family resources might be related to both access to tutoring and examination performance.
Appropriate statistical methods
Researchers should use methods suited to the variables, sampling design, and research question.
For example, Pearson correlation measures linear association between numerical variables. It is not automatically appropriate for every type of dataset.
Transparency and reproducibility
A good investigation explains how data were collected, cleaned, analysed, and interpreted.
Another researcher should be able to understand and, where practical, reproduce the analysis.
Worked Example: Evaluating a Survey
A company claims:
"Nine out of ten customers prefer our new product."
The claim is based on an online survey completed by 20 customers who voluntarily responded after receiving a promotional email.
Evaluate the investigation.
Step 1: Examine the sample size.
Only 20 people responded. This is a small sample for making broad claims about all customers.
Step 2: Consider sampling bias.
Customers who chose to respond may have stronger opinions than those who did not.
Step 3: Examine representativeness.
The respondents may not represent the company's entire customer base.
Step 4: Consider the wording of the question.
A leading question could influence responses.
Step 5: Form a justified conclusion.
The survey shows that 18 of the 20 respondents preferred the new product.
It does not provide strong evidence that 90% of all customers prefer it.
A better statement would be:
"Of the 20 customers who responded to our voluntary survey, 18 preferred the new product. A larger, more representative survey is needed to estimate preferences across the full customer population."
Applying Statistical Thinking to Authentic Problems
Statistical thinking involves using evidence and uncertainty to investigate problems and make informed decisions.
Application 1: Reducing electricity consumption
A school wants to reduce electricity use.
Researchers collect data on daily electricity consumption, outdoor temperature, classroom occupancy, and air-conditioning hours.
They may use multiple regression to investigate which variables are associated with higher electricity consumption.
A useful recommendation might be to test adjusted air-conditioning schedules, but the school should evaluate the effects of the changes rather than assume that observed associations establish causation.
Application 2: Improving transport efficiency
A city wants to reduce traffic congestion.
Researchers examine traffic volume, travel time, weather, road capacity, and public transport use.
Statistical models can identify recurring congestion patterns and support comparisons of transport strategies.
However, predictions should be evaluated against observed traffic conditions, particularly after major road or policy changes.
Application 3: Improving crop production
An agricultural researcher investigates how rainfall, fertiliser, temperature, and soil quality relate to crop yield.
A statistical model may reveal that fertiliser is positively associated with crop yield up to a certain point, after which the benefits become smaller.
This could support further experiments to identify an effective fertiliser application rate.
A Complete Statistical Investigation: Worked Case Study
A school wants to determine whether a new revision programme is associated with improved mathematics results.
Two groups of 40 students take the same final assessment.
|
Statistic |
Revision programme |
Standard revision |
|---|---|---|
|
Sample size |
40 |
40 |
|
Mean score |
78 |
72 |
|
Standard deviation |
8 |
10 |
Assume the students were independently sampled and that the groups are independent.
Step 1: Identify the research question
Is there evidence that average mathematics performance differs between students using the new revision programme and those using standard revision?
Step 2: Calculate the difference in sample means
The revision-programme group achieved a mean score 6 percentage points higher.
Step 3: Estimate the standard error
For independent groups, the estimated standard error of the difference in means is:
Substitute:
Step 4: Calculate an approximate 95% confidence interval
Using a Welch two-sample t approach, the degrees of freedom are approximately 74 and the 95% critical value is approximately 1.99.
The estimated difference in population mean scores is approximately 2.0 to 10.0 percentage points, with a 95% confidence interval under the stated sampling assumptions.
Step 5: Interpret the evidence
The confidence interval does not contain zero, suggesting evidence of a difference in population mean examination scores under the model assumptions.
However, the investigation has not stated whether students were randomly assigned to the revision methods.
If the groups differed in prior achievement, motivation, or other factors, these differences could partly explain the result.
Step 6: Communicate the conclusion
"The revision-programme group achieved a mean examination score of 78%, compared with 72% for the standard-revision group. The estimated mean difference was 6 percentage points, with an approximate 95% confidence interval of 2.0 to 10.0 percentage points. The results provide evidence of higher average performance in the revision-programme group, although further information about group assignment and possible confounding variables is needed before attributing the difference to the programme itself."
This is an evidence-based conclusion because it includes the effect size, uncertainty, and limitations.
Common Mistakes
Mistake 1: Presenting results without context
A statistic such as "r = 0.72" is not meaningful to every reader.
Correction: Explain what the statistic measures and what it suggests in the investigation.
Mistake 2: Using inappropriate or misleading graphs
Truncated bar charts, missing labels, or unsuitable graph types may distort interpretation.
Correction: Choose visualisations that represent the data accurately.
Mistake 3: Confusing correlation with causation
An observed association does not automatically demonstrate that one variable causes another.
Correction: Consider confounding, reverse causation, and study design.
Mistake 4: Ignoring uncertainty
Reporting a sample estimate as though it were the exact population value can mislead readers.
Correction: Include confidence intervals, margins of error, or other appropriate uncertainty measures.
Mistake 5: Reporting statistical significance without effect size
A statistically significant result may have little practical importance.
Correction: Report the size and context of the effect.
Mistake 6: Overgeneralising from a biased sample
Results from a convenience sample may not represent the wider population.
Correction: Explain how the sample was selected and who the conclusions apply to.
Mistake 7: Making recommendations stronger than the evidence supports
A small observational study may identify a possible relationship without proving an intervention will work.
Correction: Match recommendations to the strength and limitations of the evidence.
Mistake 8: Omitting methodology
Readers cannot adequately evaluate an investigation if they do not know how the data were obtained.
Correction: Clearly describe sampling, measurements, analysis, and assumptions.
Key Terms
-
Statistical Communication: Presenting statistical information clearly, accurately, and meaningfully.
-
Statistical Report: A structured document explaining a statistical investigation and its findings.
-
Research Question: The question an investigation aims to answer.
-
Descriptive Statistics: Numerical summaries such as means, medians, and standard deviations.
-
Statistical Inference: Drawing conclusions about populations using sample data.
-
Evidence-Based Conclusion: A conclusion supported by relevant data and statistical reasoning.
-
Effect Size: A measure of the magnitude of a relationship or difference.
-
Statistical Significance: Evidence against a null hypothesis assessed using a statistical test and significance criterion.
-
Practical Significance: The real-world importance of a statistical result.
-
Confidence Interval: An interval estimate constructed using a procedure with a stated long-run coverage probability.
-
Margin of Error: A quantity describing the half-width of a symmetric interval estimate.
-
Sampling Bias: Systematic distortion caused by how observations are selected.
-
Response Bias: Systematic distortion caused by inaccurate or influenced responses.
-
Confounding Variable: A variable that can distort an apparent relationship between other variables.
-
Correlation: A measure of association between variables.
-
Causation: A relationship in which changing one factor produces a change in another.
-
Representativeness: The extent to which a sample reflects its intended population.
-
Reliability: The consistency of a measurement or procedure.
-
Validity: The extent to which a method measures or supports what it is intended to measure or infer.
-
Reproducibility: The ability to obtain consistent results by repeating an analysis using the same data and methods.
-
Data Visualisation: Graphical representation of information and statistical patterns.
Key Takeaways
-
Statistical findings must be communicated clearly and accurately.
-
Effective communication includes the research question, methods, results, interpretation, and limitations.
-
Graphs should be chosen according to the data and should avoid misleading scales or representations.
-
Statistical conclusions must be justified using numerical evidence and sound reasoning.
-
Description, interpretation, and causal conclusions are different.
-
Confidence intervals and other uncertainty measures help communicate the precision of estimates.
-
Statistical significance does not automatically imply practical importance.
-
Effective statistical reports are structured, transparent, and understandable to their intended audience.
-
Investigations should be evaluated for sampling quality, measurement reliability, appropriate analysis, and potential bias.
-
Statistical thinking supports authentic decision-making by combining evidence with uncertainty and context.
Check Your Understanding
Questions
Question 1: Statistical Communication
Explain why presenting a statistical result without context can be misleading.
Question 2: Choosing a Graph
Choose the most appropriate graph for each situation.
a) Comparing the number of students in four school clubs.
b) Investigating the relationship between study hours and examination scores.
c) Showing monthly electricity consumption over two years.
d) Comparing the distribution of examination scores across three classes.
Question 3: Interpreting Evidence
A study finds a correlation of r = −0.82 between the number of absences and examination scores.
Describe the relationship and explain what cannot be concluded from this result alone.
Question 4: Percentage Change
A school increases its recycling rate from 40% to 50%.
Calculate:
a) The increase in percentage points.
b) The percentage increase relative to the original recycling rate.
Question 5: Confidence Intervals
A survey estimates that 64% of students support a new school timetable, with a 95% confidence interval from 59% to 69%.
State the estimated proportion, calculate the margin of error, and explain the interval appropriately.
Question 6: Evaluating a Survey
A school surveys 25 students from its mathematics club to estimate how many students across the school enjoy mathematics.
Identify two weaknesses in this investigation.
Question 7: Justifying a Conclusion
Two classes complete the same examination.
Class A has a mean score of 75%, while Class B has a mean score of 69%.
Write a justified conclusion and explain what additional information would help evaluate the difference.
Question 8: Statistical Significance
A new teaching method increases the average examination score by 0.3 percentage points in a very large study, and the difference is statistically significant.
Explain why the school should still consider practical significance.
Question 9: Evaluating a Claim
A company reports that its product is preferred by 90% of customers, based on 18 positive responses from 20 volunteers.
Explain why this claim may be misleading.
Question 10: Authentic Problem Solving
A school wants to reduce food waste in its cafeteria.
Describe a statistical investigation that could help the school make an evidence-based decision. Include the research question, data collection, analysis, and communication of findings.
Fully Worked Answers
Answer 1: Statistical Communication
A statistical result without context may be difficult to interpret or may create a misleading impression.
For example, saying "Scores increased by 10%" does not explain the original score, the final score, the sample size, or how the data were collected.
A clearer statement would be:
"The mean examination score increased from 60% to 66%, representing a relative increase of 10%, or 6 percentage points."
Context allows readers to understand the magnitude and meaning of the result.
Answer 2: Choosing a Graph
a) Bar chart, because the data involve categories of school clubs.
b) Scatter plot, because the investigation examines a relationship between two numerical variables.
c) Line graph, because electricity consumption is measured sequentially over time.
d) Side-by-side box plots, because these allow comparison of medians, quartiles, spread, and possible outliers across classes.
Answer 3: Interpreting Evidence
The correlation coefficient is r = −0.82.
This indicates a strong negative linear association.
Students with more absences tend to have lower examination scores.
However, the result does not establish that absences cause lower scores.
Other factors, such as illness, family circumstances, or learning difficulties, may influence both attendance and performance.
Answer 4: Percentage Change
Part a: Percentage-point increase
Part b: Relative percentage increase
The recycling rate increased by 10 percentage points, representing a 25% relative increase.
These two measures describe different aspects of the same change.
Answer 5: Confidence Intervals
The estimated proportion is 64%.
The confidence interval is 59% to 69%.
Calculate the margin of error:
The margin of error is 5 percentage points.
The result can be expressed as:
The 95% confidence level means that, under the statistical assumptions, the interval-building procedure would contain the true population proportion in approximately 95% of repeated samples.
It does not guarantee that the particular interval is correct, nor does it account for all possible sampling biases.
Answer 6: Evaluating a Survey
Two weaknesses are:
Selection bias: Students in the mathematics club are likely to have a greater interest in mathematics than the average student.
Small and potentially unrepresentative sample: Only 25 students were surveyed, and they were all selected from one particular group.
A better investigation would use a larger, appropriately selected sample from across the school.
Answer 7: Justifying a Conclusion
A suitable conclusion is:
"Class A achieved a mean examination score of 75%, compared with 69% for Class B. The observed difference was 6 percentage points."
To evaluate the difference more fully, we would need information about sample sizes, variation in scores, previous achievement, and whether the classes were comparable.
The difference in sample means alone does not establish statistical significance or explain why the groups performed differently.
Answer 8: Statistical Significance
Statistical significance indicates that the observed result is inconsistent with the null hypothesis to a degree specified by the statistical test and significance level.
However, an increase of only 0.3 percentage points may have little educational importance.
The school should consider whether the improvement justifies the time, cost, and resources required by the new teaching method.
Therefore, statistical significance and practical significance must be evaluated separately.
Answer 9: Evaluating a Claim
The calculation is:
The numerical statement is correct for the 20 respondents.
However, the sample is small and consists of volunteers, who may not represent the wider customer population.
Therefore, the company should not confidently generalise the 90% figure to all customers.
A more accurate statement would be:
"Of the 20 volunteers surveyed, 18 preferred the product."
Answer 10: Authentic Problem Solving
Research question
"How much food is wasted in the school cafeteria, and which factors are associated with higher waste levels?"
Data collection
Measure the mass of food waste each day over several weeks. Record the menu, number of meals served, portion sizes, and relevant student feedback.
Analysis
Calculate average food waste per meal, compare waste across different menu types, and investigate relationships between portion size and waste.
Graphs could show daily waste trends and comparisons between meal categories.
Communication
Prepare a report including the research question, methodology, numerical summaries, graphs, conclusions, and limitations.
Recommendation
If larger portions are consistently associated with more waste, the school could trial optional smaller portions.
The school should then collect new data to evaluate whether the change actually reduces food waste.
This is an example of using statistical thinking to investigate a practical problem, develop a possible solution, and evaluate its effectiveness.
Final Reflection
Communicating statistical results is more than presenting numbers or drawing graphs. It involves transforming data into evidence that people can understand, question, and use.
An effective statistical investigation should make it possible for readers to identify the research question, understand the methods, evaluate the results, and judge whether the conclusions are justified.
The most important principle is that the strength of a statistical conclusion must never exceed the strength of the evidence supporting it.
When statistical findings are communicated clearly, accurately, and responsibly, they become powerful tools for solving problems and making informed decisions.