Descriptive Statistics
3. Percentiles and Standard Scores
Learning outcomes
- I can calculate percentiles.
- I can interpret percentile rankings.
- I can calculate z-scores.
- I can compare observations using standard scores.
- I can interpret standardized data.
Understanding the Mean and Standard Deviation
Before calculating z-scores, we need to understand two statistical measures.
Mean
The mean is the arithmetic average of a dataset.
Mean = Sum of observations / Number of observations
Consider:
4, 6, 8, 10, 12
Mean = (4 + 6 + 8 + 10 + 12)/5
Mean = 40/5
Mean = 8
Standard Deviation
Standard deviation measures how spread out the observations are around the mean.
A small standard deviation indicates that values tend to be close to the mean.
A large standard deviation indicates that values are more widely spread.
For a population:
σ = √[Σ(x − μ)²/N]
where:
-
σ = population standard deviation
-
x = individual observation
-
μ = population mean
-
N = number of observations
For a sample, the corresponding formula uses the sample mean and divides by n − 1 rather than n.
Example
Two classes both have a mean examination score of 70.
Class A has a standard deviation of 5.
Class B has a standard deviation of 15.
Scores in Class A are more closely clustered around 70.
Scores in Class B are more widely spread.
A score of 85 is therefore much more unusual in Class A than in Class B.
Calculating z-Scores
The formula for a z-score is:
z = (x − μ)/σ
where:
-
z = standard score
-
x = observation
-
μ = population mean
-
σ = population standard deviation
If using a sample mean and sample standard deviation, the analogous calculation is:
z = (x − x̄)/s
The numerator measures how far the observation is from the mean.
The denominator expresses that distance in standard deviation units.
Worked Example: Examination Score
A mathematics examination has:
Mean = 70
Standard deviation = 10
A student scores 85.
Find the z-score.
Step 1: Identify the Values
x = 85
μ = 70
σ = 10
Step 2: Substitute
z = (85 − 70)/10
z = 15/10
z = 1.5
Interpretation
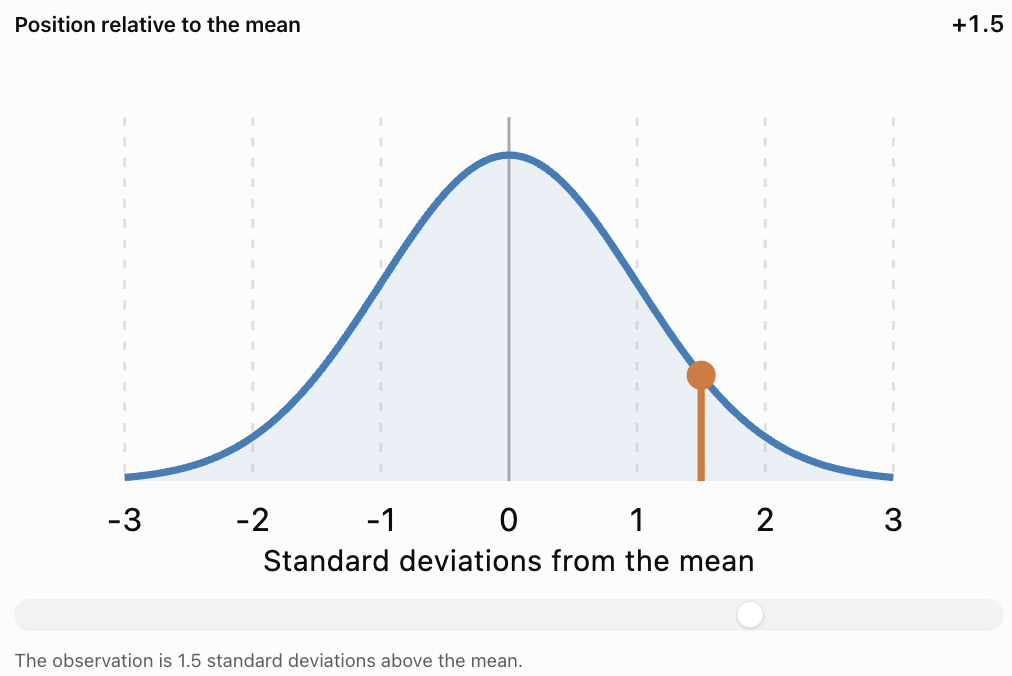
The student's score is 1.5 standard deviations above the mean.
This tells us more about the student's relative performance than the raw score alone.
Calculating a Negative z-Score
A negative z-score indicates an observation below the mean.
Worked Example
An examination has:
Mean = 65
Standard deviation = 8
A student scores 49.
Calculate the z-score.
Step 1: Substitute
z = (49 − 65)/8
z = −16/8
z = −2
Interpretation
The student's score is two standard deviations below the mean.
The negative sign describes the direction relative to the mean.
It does not mean the examination score itself is negative.
Interpreting z-Scores Visually
Important Observations
A positive z-score indicates an observation above the mean.
A negative z-score indicates an observation below the mean.
A z-score of zero indicates an observation equal to the mean.
The greater the absolute value of the z-score, the farther the observation is from the mean in standard deviation units.
A z-score has no units because the original units cancel during division.
Comparing Observations Using z-Scores
One of the most useful applications of standard scores is comparing observations from different distributions.
For example, a student may take two examinations with different means and standard deviations.
A raw score of 80 on one examination may represent better relative performance than a score of 90 on another.
Worked Example: Comparing Two Examinations
A student receives the following results:
|
Statistic |
Mathematics |
Science |
|---|---|---|
|
Student's score |
82 |
88 |
|
Class mean |
70 |
80 |
|
Standard deviation |
8 |
10 |
Which examination represents the student's stronger performance relative to the class?
Step 1: Calculate the Mathematics z-Score
z = (82 − 70)/8
z = 12/8
z = 1.5
Step 2: Calculate the Science z-Score
z = (88 − 80)/10
z = 8/10
z = 0.8
Step 3: Compare
Mathematics: z = 1.5
Science: z = 0.8
Interpretation
Although the student's raw Science score is higher, the Mathematics score is farther above its class mean.
Therefore, the student performed better relative to the Mathematics class distribution.
This does not necessarily mean the student understands Mathematics better than Science. It means the Mathematics result occupies a higher standardized position within its reference group.
Comparing Measurements with Different Units
Standard scores can also compare observations measured in different units.
Worked Example: Height and Mass
Suppose an athlete has:
|
Measurement |
Athlete |
Population mean |
Standard deviation |
|---|---|---|---|
|
Height |
190 cm |
175 cm |
10 cm |
|
Mass |
82 kg |
70 kg |
8 kg |
Height z-Score
z = (190 − 175)/10
z = 1.5
Mass z-Score
z = (82 − 70)/8
z = 1.5
Interpretation
The athlete's height and mass are each 1.5 standard deviations above their respective population means.
Even though centimetres and kilograms are different units, z-scores allow us to compare their relative positions.
This is possible because standard scores are dimensionless.
The Standard Normal Distribution
A normal distribution is a continuous, symmetric, bell-shaped probability distribution.
The standard normal distribution has:
-
Mean = 0
-
Standard deviation = 1
Its horizontal axis is measured in z-scores.

Important Properties
For a normal distribution:
-
Approximately 68% of observations lie within one standard deviation of the mean.
-
Approximately 95% lie within two standard deviations.
-
Approximately 99.7% lie within three standard deviations.
This is called the empirical rule or 68–95–99.7 rule.
The empirical rule
68%
Within ±1σ95%
Within ±2σ99.7%
Within ±3σInterpreting Unusual Observations
For a normal distribution:
-
z = 0 represents the mean.
-
z = 1 represents a moderately above-average observation.
-
z = 2 represents an observation relatively far above the mean.
-
z = 3 represents an observation very far above the mean.
Likewise, negative z-scores represent observations below the mean.
A common screening rule is to flag observations with |z| > 2 or |z| > 3 for further investigation.
However, a large absolute z-score does not automatically mean an observation is incorrect.
Connecting z-Scores to Percentiles
Percentiles and z-scores both describe relative position, but they use different scales.
For a normally distributed variable, a z-score can be converted into a percentile using the standard normal cumulative distribution.
Common z-Scores and Percentiles
|
z-score |
Approximate percentile |
|---|---|
|
−3.00 |
0.13th |
|
−2.00 |
2.28th |
|
−1.00 |
15.87th |
|
−0.67 |
25th |
|
0.00 |
50th |
|
+0.67 |
75th |
|
+1.00 |
84.13th |
|
+1.28 |
90th |
|
+1.645 |
95th |
|
+1.96 |
97.5th |
|
+2.00 |
97.72nd |
|
+3.00 |
99.87th |
Worked Example
A student receives a z-score of 1.00 on an examination whose scores are approximately normally distributed.
The corresponding percentile is approximately 84.13.
Interpretation
The student scored higher than approximately 84% of the reference distribution.
This does not mean the student answered 84% of the questions correctly.
It describes relative performance.
Important Limitation
A z-score does not automatically determine a percentile unless we know or assume an appropriate distribution.
For example, a z-score of 1.00 does not always correspond to the 84th percentile in a strongly skewed dataset.
The normal-distribution conversion is valid when the normal model is appropriate.
Calculating a Percentile from a z-Score
A standard normal table, statistical calculator, or spreadsheet can be used to convert z-scores into cumulative probabilities.
The cumulative probability is the area under the standard normal curve to the left of the specified z-score.
Worked Example
Find the approximate percentile corresponding to:
z = 1.25
Step 1: Identify the z-Score
z = 1.25
Step 2: Find the Cumulative Probability
Using a standard normal table:
P(Z ≤ 1.25) ≈ 0.8944
Step 3: Convert to a Percentage
0.8944 × 100% = 89.44%
Final Answer
Approximately the 89.44th percentile
Interpretation
An observation with z = 1.25 lies above approximately 89.44% of a normally distributed reference population.
Calculating a z-Score from a Percentile
We can also work backward.
Suppose a student is at the 90th percentile of a normally distributed examination.
The z-score corresponding to the 90th percentile is approximately:
z = 1.28
If the examination mean is 65 and the standard deviation is 12, estimate the student's score.
Step 1: Start with the z-Score Formula
z = (x − μ)/σ
Step 2: Rearrange
x = μ + zσ
Step 3: Substitute
x = 65 + 1.28(12)
x = 65 + 15.36
x ≈ 80.36
Interpretation
A score of approximately 80.4 corresponds to the 90th percentile under the assumed normal distribution.
The exact score may vary if the actual distribution differs from the normal model.
Standardizing an Entire Dataset
Standardization transforms each observation into a z-score.
For every observation:
z = (x − μ)/σ
Consider a population with:
Mean = 50
Standard deviation = 10
|
Original value |
Calculation |
z-score |
|---|---|---|
|
30 |
(30 − 50)/10 |
−2 |
|
40 |
(40 − 50)/10 |
−1 |
|
50 |
(50 − 50)/10 |
0 |
|
60 |
(60 − 50)/10 |
1 |
|
70 |
(70 − 50)/10 |
2 |
What Happens After Standardization?
For a dataset standardized using its own mean and standard deviation:
-
The standardized mean becomes 0.
-
The standardized standard deviation becomes 1.
-
The relative ordering of observations remains unchanged.
-
The values become unitless.
Standardization does not automatically make a dataset normally distributed.
If the original distribution is skewed, its standardized distribution remains skewed.
Applications in Education
Percentiles and standard scores are widely used to interpret examination results.

Example
Two students complete different standardized examinations.
Student A:
Score = 75
Mean = 60
Standard deviation = 10
Student B:
Score = 85
Mean = 80
Standard deviation = 5
Calculations
Student A:
z = (75 − 60)/10 = 1.5
Student B:
z = (85 − 80)/5 = 1.0
Interpretation
Student A performed better relative to the reference group for their examination.
Standard scores can help compare performance across different tests, provided the reference groups and testing conditions are appropriate.
Applications in Health and Growth
Percentile charts are commonly used to compare children's growth measurements with reference populations of the same age and sex.

For example, a height at the 75th percentile indicates that the measurement is greater than or equal to approximately 75% of measurements in the relevant reference distribution.
Important Considerations
A percentile is not a diagnosis.
A measurement at a high or low percentile is not automatically unhealthy.
Healthcare professionals consider patterns over time, medical history, age, development, and other relevant information.
The choice of reference population matters.
Applications in Sports
Standard scores can help compare athletic performances measured in different units.
For example:
-
Sprint times measured in seconds.
-
Jump heights measured in centimetres.
-
Throwing distances measured in metres.
-
Strength measurements recorded in kilograms.

Worked Example
An athlete runs 100 metres in 11.2 seconds.
The reference group has:
Mean time = 12.0 seconds
Standard deviation = 0.4 seconds
Calculate:
z = (11.2 − 12.0)/0.4
z = −0.8/0.4
z = −2
Interpretation
The athlete's time is two standard deviations below the mean.
Because a lower sprint time is better, this represents an unusually strong performance.
Important Observation
A positive z-score does not always represent a better result.
Its meaning depends on the variable.
For examination scores, higher is often better.
For race times, lower is often better.
Applications in Manufacturing
Manufacturers use standardized measurements to monitor product consistency.
Suppose a factory produces metal rods with:
Mean length = 100 cm
Standard deviation = 0.5 cm
A rod measures 101.2 cm.
Calculate the z-Score
z = (101.2 − 100)/0.5
z = 1.2/0.5
z = 2.4
Interpretation
The rod is 2.4 standard deviations longer than the mean.
This may justify checking the rod against manufacturing tolerances.
However, a z-score alone does not determine whether a product meets specifications.
The acceptable range must be defined separately.
Comparing Percentiles and z-Scores
|
Feature |
Percentile |
z-score |
|---|---|---|
|
Describes |
Relative rank |
Distance from mean |
|
Scale |
Usually 0–100 |
Can be negative or positive |
|
Uses standard deviation |
Not necessarily |
Yes |
|
Mean position |
Not always 50th percentile |
Always z = 0 |
|
Works with skewed data |
Yes |
Yes |
|
Directly gives normal percentile |
Not applicable |
Only with normal model |
|
Useful for |
Rankings and relative positions |
Standardized comparisons |
|
Example |
90th percentile |
z = 1.28 |
Choosing the Correct Measure
Use a percentile when you want to know how an observation ranks relative to other observations.
Use a z-score when you want to know how far an observation is from the mean in standard deviation units.
Both can be useful when comparing observations across groups, but the reference populations must be appropriate.
Common Mistakes
Confusing percentile with percentage
A percentile describes rank, not the proportion of questions answered correctly.
Forgetting to order the dataset
Percentile calculations require data arranged in ascending order.
Assuming all percentile methods give identical results
Different methods can produce slightly different sample percentile values.
Confusing percentile value with percentile rank
A percentile value is a measurement. A percentile rank is a relative position.
Subtracting the observation from the mean
The z-score formula uses x − μ, not μ − x.
Ignoring negative z-scores
Negative z-scores indicate values below the mean.
Assuming a positive z-score is always better
For variables such as race times or error counts, lower values may be preferable.
Confusing standard deviation with variance
Variance uses squared units; standard deviation uses the original units.
Assuming standardized data are normally distributed
Standardization changes location and scale, not the overall distribution shape.
Using normal-distribution percentiles for every dataset
The conversion between z-scores and normal percentiles requires a suitable normal model.
Rounding too early
Keep sufficient precision during calculations and round the final answer.
Ignoring the reference group
A percentile or z-score only has meaning relative to the distribution used to calculate it.
Key Terms
-
Percentile: Value associated with a specified cumulative position in an ordered distribution.
-
Percentile Rank: Relative position of an observation expressed as a percentage.
-
Percentage: Proportion expressed out of 100.
-
Median: Middle value of an ordered dataset; the 50th percentile.
-
Quartile: Value dividing ordered data into four approximately equal groups.
-
Interquartile Range: Difference between the third and first quartiles.
-
Interpolation: Estimation of a value between two known values.
-
Mean: Arithmetic average of a dataset.
-
Standard Deviation: Measure of the spread of observations around the mean.
-
Variance: Average squared deviation from the mean, using the appropriate population or sample formula.
-
Standard Score: Standardized measure of an observation's relative position.
-
z-Score: Number of standard deviations an observation lies above or below the mean.
-
Standardization: Transformation of observations into standardized values.
-
Normal Distribution: Symmetric, bell-shaped probability distribution.
-
Standard Normal Distribution: Normal distribution with mean 0 and standard deviation 1.
-
Cumulative Probability: Probability that a variable is at or below a specified value.
-
Empirical Rule: Approximate 68–95–99.7 pattern for normally distributed observations.
-
Outlier: Observation unusually far from the main body of a dataset.
-
Reference Population: Group used to interpret or compare an observation.
-
Skewed Distribution: Distribution that is asymmetric.
-
Raw Score: Original, unstandardized observation.
-
Relative Position: Location of an observation compared with others.
-
Dimensionless Quantity: Quantity without physical units.
Key Takeaways
-
Percentiles describe relative positions within distributions.
-
The 50th percentile is the median.
-
Quartiles correspond to the 25th, 50th, and 75th percentiles.
-
Percentiles and percentages are not the same.
-
Sample percentiles can be calculated using several accepted conventions.
-
A z-score measures distance from the mean in standard deviation units.
-
The population z-score formula is z = (x − μ)/σ.
-
Positive z-scores indicate observations above the mean.
-
Negative z-scores indicate observations below the mean.
-
A z-score of zero represents the mean.
-
Standard scores allow comparisons across different measurement scales.
-
Standardized observations are unitless.
-
A standard normal distribution has mean 0 and standard deviation 1.
-
Approximately 68%, 95%, and 99.7% of normally distributed observations lie within one, two, and three standard deviations of the mean.
-
Normal-distribution percentiles can be estimated from z-scores when a normal model is appropriate.
-
Percentiles and z-scores must always be interpreted in relation to their reference distributions.
Check Your Understanding
Percentiles
-
Define a percentile.
-
Explain the difference between a percentile and a percentage.
-
What percentile corresponds to the median?
-
Identify the percentiles represented by Q₁ and Q₃.
-
Using L = (k/100)(n + 1), find the position of the 30th percentile in a dataset containing 19 observations.
-
Using the same method, find the 25th percentile of 4, 8, 12, 16, 20, 24, 28.
-
Find the median of 10, 14, 18, 22, 26, 30.
-
If Q₁ = 18 and Q₃ = 42, calculate the IQR.
z-Scores
-
Write the population z-score formula.
-
Calculate the z-score for x = 85, μ = 70, σ = 10.
-
Calculate the z-score for x = 45, μ = 60, σ = 5.
-
What does z = 0 mean?
-
What does z = −1.5 mean?
-
An examination has mean 65 and standard deviation 8. Find the z-score for a score of 81.
-
A value has z = 2, mean 40, and standard deviation 6. Find the original value.
Comparing Observations
-
Student A has z = 1.2 and Student B has z = 0.8. Who performed better relative to their reference group, assuming higher scores are better?
-
Explain why a score of 80 may represent stronger relative performance than a score of 90.
-
Approximately what percentile corresponds to z = 1 in a normal distribution?
-
Does converting data to z-scores make the distribution normal?
-
Explain why a negative z-score may represent excellent performance in a running race.
Answer Key
|
Question |
Answer |
|---|---|
|
1 |
A value describing a specified relative position within a distribution |
|
2 |
Percentage describes a proportion; percentile describes relative position |
|
3 |
50th percentile |
|
4 |
Q₁ = 25th; Q₃ = 75th |
|
5 |
L = 0.30 × 20 = 6 |
|
6 |
L = 0.25 × 8 = 2; P₂₅ = 8 |
|
7 |
(18 + 22)/2 = 20 |
|
8 |
24 |
|
9 |
z = (x − μ)/σ |
|
10 |
1.5 |
|
11 |
−3 |
|
12 |
Observation equals the mean |
|
13 |
1.5 standard deviations below the mean |
|
14 |
2 |
|
15 |
52 |
|
16 |
Student A |
|
17 |
The examinations may have different means and standard deviations |
|
18 |
Approximately 84th percentile |
|
19 |
No |
|
20 |
Lower times are better, so a negative z-score may indicate a faster-than-average time |
Extended Challenge
Percentile Calculations
Use the (n + 1) position method with interpolation for Questions 1–5.
-
Find the 25th percentile of 5, 10, 15, 20, 25, 30, 35, 40, 45.
-
Find the 75th percentile of the same dataset.
-
Calculate the IQR of the dataset.
-
Find the 60th percentile of 12, 15, 18, 22, 25, 29, 34, 38, 42.
-
Explain why two statistical programs may report slightly different percentiles for the same dataset.
Standard Scores
-
Calculate the z-score for x = 92, μ = 75, σ = 10.
-
Calculate the z-score for x = 48, μ = 60, σ = 8.
-
A value has z = −1.25, mean 100, and standard deviation 16. Find the original value.
-
A dataset has mean 50 and standard deviation 12. Determine the values corresponding to z = −2 and z = 2.
-
Explain why z-scores are dimensionless.
Comparing Data
-
A student scores 78 on a test with mean 65 and standard deviation 10. On another test, the student scores 84 with mean 75 and standard deviation 6. Compare the performances.
-
Two athletes complete different events. Athlete A has z = −1.8 for race time. Athlete B has z = 1.5 for jump height. Explain how both results may represent strong performances.
-
A manufacturing process has mean 250 g and standard deviation 4 g. Calculate the z-score of a 261 g product.
-
Explain why the same raw score can have different z-scores in different distributions.
-
Describe a situation in which percentiles would be more useful than raw scores.
Normal Distribution Applications
-
Approximately what percentage of a normal distribution lies within one standard deviation of the mean?
-
Approximately what percentage lies outside two standard deviations?
-
A normal distribution has mean 100 and standard deviation 15. Find the values corresponding to z = −1 and z = 1.
-
Estimate the 90th-percentile value for a normal distribution with mean 50 and standard deviation 8, using z ≈ 1.28.
-
Explain why the normal model should not automatically be used for highly skewed data.
Final Investigation: Comparing Examination Results
Three classes complete different examinations.
|
Statistic |
Class A |
Class B |
Class C |
|---|---|---|---|
|
Mean |
65 |
72 |
58 |
|
Standard deviation |
10 |
8 |
12 |
|
Selected student's score |
80 |
84 |
76 |
Complete the investigation.
-
Calculate the z-score for the student in Class A.
-
Calculate the z-score for the student in Class B.
-
Calculate the z-score for the student in Class C.
-
Rank the students according to raw examination scores.
-
Rank the students according to standardized scores.
-
Explain why the two rankings may differ.
-
Identify which student performed best relative to their class.
-
Identify which student achieved the highest raw score.
-
Explain the role of the mean in standardization.
-
Explain the role of standard deviation.
-
Estimate the normal-distribution percentile for each student, assuming the scores are approximately normally distributed.
-
Explain why the percentile estimates depend on the normality assumption.
-
Determine the raw score corresponding to z = 2 in each class.
-
Determine the raw score corresponding to z = −1 in each class.
-
Explain why a student with z = 0 is not necessarily performing poorly.
-
Describe how a highly skewed distribution could affect interpretation.
-
Explain how standard scores could help compare results from different examinations.
-
Discuss one limitation of using only z-scores to evaluate students.
-
Suggest another statistic that would help describe each class.
-
Write a conclusion explaining why percentiles and standard scores are valuable tools for interpreting educational data.