Descriptive Statistics
1. Measures of Centre
Learning outcomes
- I can calculate the mean.
- I can calculate the median.
- I can calculate the mode.
- I can compare measures of centre.
- I can select appropriate measures for different datasets.
Measures of Centre
Introduction
When we collect data, we often want to describe the information using a single number that represents a typical or central value.
For example, imagine that a teacher records the scores of students on a mathematics quiz. Rather than examining every individual score, the teacher might calculate an average to understand how the class performed.
Similarly, a business might want to know the typical amount customers spend, or a scientist might want to determine the typical height of plants in an experiment.
These situations involve measures of centre, also called measures of central tendency.
The three most common measures of centre are:
-
Mean: The sum of all values divided by the number of values.
-
Median: The middle value when data is arranged in order.
-
Mode: The value that occurs most frequently.
Each measure describes the centre of a dataset differently. Understanding these differences helps us select the most appropriate measure for a particular situation.


What Is a Dataset?
A dataset is a collection of values or observations gathered for analysis.
For example, consider the number of books read by eight students during a month:
2, 4, 3, 5, 4, 6, 3, 5
Each number represents one observation.
The dataset contains eight values.
We can use measures of centre to describe a typical number of books read.
Before calculating a measure of centre, it is important to understand the data.
Questions to consider include:
-
How many values are there?
-
Are the values numerical or categorical?
-
Are any values unusually large or small?
-
Are some values repeated?
-
What does each value represent?
The answers help determine which measure of centre is most useful.
The Mean
The mean is calculated by adding all the values in a dataset and dividing by the number of values.
It is often called the arithmetic average.
Formula
Mean = Sum of all values ÷ Number of values
Using mathematical notation:
x̄ = Σx/n
Where:
-
x̄ represents the sample mean.
-
Σx represents the sum of all values.
-
n represents the number of values.
The symbol Σ (sigma) means sum.
Worked Example: Quiz Scores
Five students receive the following quiz scores:
6, 8, 7, 9, 10
Find the mean.
Step 1: Add the values.
6 + 8 + 7 + 9 + 10 = 40
Step 2: Count the values.
There are 5 scores.
Step 3: Divide.
Mean = 40 ÷ 5
Mean = 8
The mean quiz score is 8.
Interpretation
The mean represents an equal-sharing value.
If the total of 40 points were distributed equally among the five students, each would have 8 points.
This does not mean every student actually scored 8.
Understanding the Mean Visually
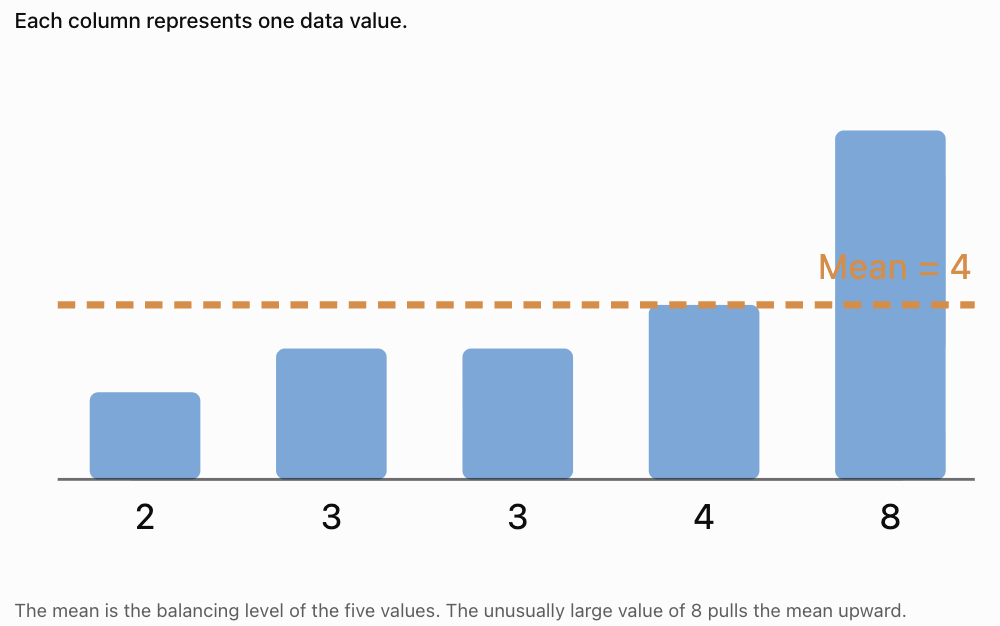
Consider the dataset:
2, 3, 3, 4, 8
Calculate:
Mean = (2 + 3 + 3 + 4 + 8)/5
= 20/5
Mean = 4
Notice that only one value is greater than 4, but that value is much larger than the others.
This demonstrates how an unusually high value can affect the mean.
Finding the Mean with Decimal Values
The mean can be calculated using whole numbers, decimals, or negative numbers.
Worked Example: Temperatures
A scientist records these temperatures in degrees Celsius:
21.5, 22.0, 23.5, 21.0, 22.5
Calculate the mean.
Add:
21.5 + 22.0 + 23.5 + 21.0 + 22.5 = 110.5
Divide by 5:
Mean = 110.5/5
Mean = 22.1°C
Important Point
The mean does not have to be one of the values in the dataset.
For example, the mean of 3 and 4 is 3.5.
Finding the Mean from a Frequency Table
Sometimes a dataset contains many repeated values.
A frequency table makes it easier to calculate the mean.
Worked Example
The following table shows the number of siblings students have.
|
Number of siblings (x) |
Frequency (f) |
f × x |
|---|---|---|
|
0 |
3 |
0 |
|
1 |
5 |
5 |
|
2 |
4 |
8 |
|
3 |
2 |
6 |
|
Total |
14 |
19 |
The mean is:
Mean = Σ(f × x)/Σf
Substitute:
Mean = 19/14
Mean ≈ 1.36 siblings
Interpretation
The average number of siblings is approximately 1.36.
Although no student can have 1.36 siblings, the mean is still useful for comparing groups.
The Median
The median is the middle value of a dataset when the values are arranged in numerical order.
Unlike the mean, the median depends on the position of values rather than their total.
Finding the Median
-
Arrange the values from smallest to largest.
-
Count the number of values.
-
Find the middle position.
-
If there are two middle values, calculate their mean.
Median with an Odd Number of Values
Worked Example
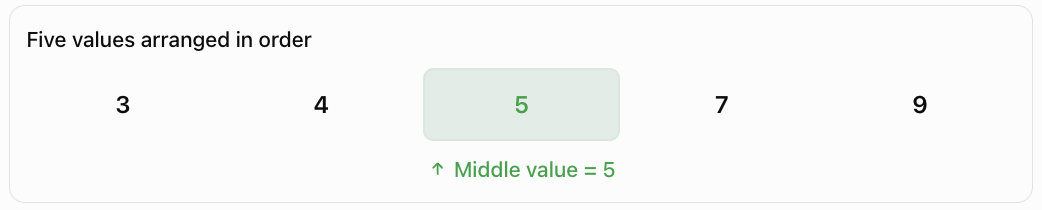
Consider:
7, 3, 9, 5, 4
Arrange in ascending order:
3, 4, 5, 7, 9
There are five values.
The middle value is the third value.
Median = 5
Median Position Formula
For an odd number of values:
Median position = (n + 1)/2
For n = 5:
Median position = (5 + 1)/2 = 3
Therefore, the median is the third value.
Median with an Even Number of Values
When a dataset contains an even number of values, there are two middle values.
The median is the mean of these two values.
Worked Example
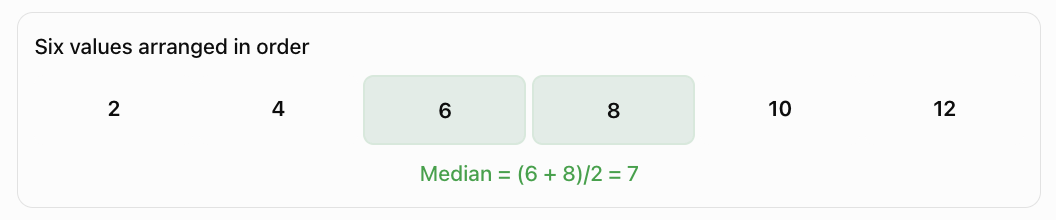
Consider:
4, 8, 2, 10, 6, 12
Arrange in ascending order:
2, 4, 6, 8, 10, 12
There are six values.
The middle values are 6 and 8.
Median = (6 + 8)/2
Median = 7
Important Observation
The median does not have to appear in the original dataset.
In this example, 7 is the median even though no value equals 7.
Why Ordering Matters
Consider:
12, 4, 8, 2, 10
A student might incorrectly select 8 because it appears in the middle of the written list.
However, the values must first be arranged in order:
2, 4, 8, 10, 12
In this particular case, the median is still 8, but this is a coincidence.
Consider instead:
12, 4, 2, 10, 8
The middle value in the original list is 2.
After sorting:
2, 4, 8, 10, 12
the median is 8.
Always arrange numerical data in order before finding the median.
The Mode
The mode is the value that occurs most frequently in a dataset.
The mode is determined by counting how many times each value appears.
Worked Example
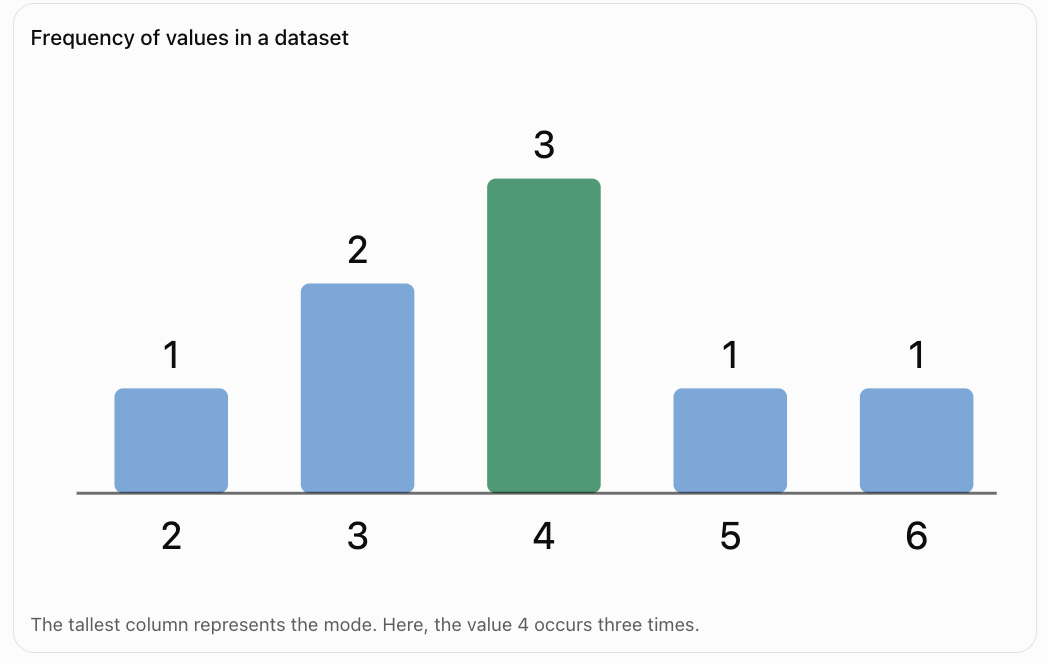
Consider:
2, 4, 3, 4, 5, 4, 6, 3
Count the frequencies:
|
Value |
Frequency |
|---|---|
|
2 |
1 |
|
3 |
2 |
|
4 |
3 |
|
5 |
1 |
|
6 |
1 |
The value 4 appears most often.
Mode = 4
Interpretation
The most common value is 4.
The mode is particularly useful when we want to identify the most frequently occurring result.
Understanding the Mode Visually
Datasets with More Than One Mode
Some datasets contain two or more values that share the highest frequency.
Bimodal Dataset
Consider:
2, 2, 3, 4, 4, 5
Both 2 and 4 appear twice.
All other values appear once.
The dataset has two modes:
Modes = 2 and 4
This is called a bimodal dataset.
Multimodal Dataset
Consider:
1, 1, 2, 2, 3, 3, 4
The values 1, 2, and 3 each appear twice.
Therefore, the dataset has three modes.
A dataset with several modes is called multimodal.
No Mode
Consider:
3, 5, 7, 9, 11
Each value appears once.
Under the usual school convention, this dataset has no mode because no value occurs more frequently than the others.
Mode with Categorical Data
Unlike the mean and median, the mode can be used with non-numerical categories.
For example, students are asked to identify their favourite fruit.
Results:
Apple, Banana, Apple, Orange, Banana, Apple, Mango
The most frequent response is Apple.
Mode = Apple
It would not make sense to calculate the mean of these categories.
The median is also not meaningful because fruit categories do not have a natural numerical order.
The mode is therefore the most appropriate measure of centre for this dataset.

Comparing Mean, Median, and Mode
Although all three measures describe the centre of data, they do so differently.
|
Measure |
How it is calculated |
Main advantage |
Main limitation |
|---|---|---|---|
|
Mean |
Sum ÷ number of values |
Uses every numerical value |
Sensitive to extreme values |
|
Median |
Middle value of ordered data |
Resistant to extreme values |
Does not use the size of every value |
|
Mode |
Most frequent value |
Works with categories |
May be absent or have multiple values |
Worked Example
Consider:
3, 4, 4, 5, 9
Mean:
(3 + 4 + 4 + 5 + 9)/5 = 25/5
Mean = 5
Median:
The middle value is 4.
Median = 4
Mode:
The most frequent value is 4.
Mode = 4
Interpretation
The mean is larger than the median and mode because the high value of 9 increases the average.
The Effect of Outliers
An outlier is a value that is unusually high or low compared with the other values.
Outliers can have a significant effect on the mean.
Example: Household Incomes
Consider five annual household incomes:
$40,000, $45,000, $48,000, $50,000, $52,000
Mean:
= $235,000/5
Mean = $47,000
Median:
Median = $48,000
Now suppose a sixth household with an income of $500,000 is included.
New dataset:
$40,000, $45,000, $48,000, $50,000, $52,000, $500,000
New mean:
= $735,000/6
Mean = $122,500
New median:
= ($48,000 + $50,000)/2
Median = $49,000
Comparison
Mean before
$47,000
Mean after
$122,500
Large increase
Median before
$48,000
Median after
$49,000
Small increase
What Does This Show?
The mean increases dramatically because of the unusually high income.
The median changes only slightly.
For this dataset, the median provides a better description of a typical household income.
This is one reason median income is commonly used in economic and social statistics.
Measures of Centre and Data Distribution
The shape of a dataset can help us decide which measure of centre is most useful.
Symmetrical Distributions
A symmetrical distribution has approximately the same shape on both sides of its centre.
For a perfectly symmetric, unimodal distribution, the mean, median, and mode often coincide.

Right-Skewed Distributions
A right-skewed distribution has a longer tail toward larger values.
High values tend to pull the mean to the right.
In a typical unimodal right-skewed distribution:
Mode < Median < Mean
This ordering is common but not a universal mathematical rule.

Left-Skewed Distributions
A left-skewed distribution has a longer tail toward smaller values.
Low values tend to pull the mean to the left.
In a typical unimodal left-skewed distribution:
Mean < Median < Mode
Again, this is a common pattern rather than a guarantee for every dataset.

Choosing the Most Appropriate Measure
The best measure depends on the type of data and the purpose of the investigation.
When to Use the Mean
The mean is usually appropriate when:
-
Data is numerical.
-
All values should contribute to the calculation.
-
There are no unusually influential outliers.
-
The distribution is reasonably symmetrical.
-
Further calculations require an arithmetic average.
Example: Average temperature measured during an experiment.
When to Use the Median
The median is usually appropriate when:
-
The dataset contains extreme values.
-
The distribution is strongly skewed.
-
A typical middle value is needed.
-
Data can be placed in a meaningful order.
Example: Typical household income or house price.
When to Use the Mode
The mode is usually appropriate when:
-
The most common value is important.
-
Data is categorical.
-
We want to identify the most popular option.
-
Repeated values are meaningful.
Example: Most popular shoe size in a shop.
Practical Application: Choosing Shoe Sizes
A shoe shop records the sizes of shoes sold during one day.
|
Shoe size |
Number sold |
|---|---|
|
6 |
3 |
|
7 |
5 |
|
8 |
12 |
|
9 |
9 |
|
10 |
4 |
|
11 |
2 |
The shop wants to decide which size to stock most heavily.
The most appropriate measure is the mode.
Mode = Size 8
Size 8 was sold 12 times, more than any other size.
Although the mean shoe size could be calculated, it would not directly identify the most popular size.
Practical Application: Comparing Two Classes
Two classes complete the same assessment.
Assessment scores
Class A
6, 7, 7, 8, 8, 9, 10
Mean = 7.86
Median = 8
Modes = 7 and 8
Class B
3, 5, 7, 8, 9, 10, 10
Mean = 7.43
Median = 8
Mode = 10
Interpretation
Both classes have the same median score of 8.
Class A has a slightly higher mean.
Class B has the highest possible mode of 10, but it also has several low scores.
This demonstrates why relying on only one measure of centre can be misleading.
The mean, median, and mode provide different information about the same dataset.
Real-World Application: Scientific Measurements
A scientist measures the height of six plants after four weeks.
The heights are:
12, 14, 13, 15, 14, 16 cm
Mean
Sum = 12 + 14 + 13 + 15 + 14 + 16 = 84
Mean = 84/6
Mean = 14 cm
Median
Arrange the data:
12, 13, 14, 14, 15, 16
The middle values are 14 and 14.
Median = 14 cm
Mode
The value 14 appears twice.
Mode = 14 cm
Interpretation
All three measures are equal.
This suggests that 14 cm is a reasonable central value for the measurements.
However, measures of centre alone do not describe the variation in plant heights. Measures such as range and standard deviation would provide additional information.

Comparing Datasets with the Same Mean
Two datasets can have the same mean but very different distributions.
Consider:
Dataset A:
4, 5, 6, 7, 8
Dataset B:
0, 0, 5, 10, 15
Dataset A
Mean = 30/5 = 6
Median = 6
Mode = none
Dataset B
Mean = 30/5 = 6
Median = 5
Mode = 0
Both datasets have the same mean, but the values are distributed differently.
Dataset B contains much greater variation.
This demonstrates why a measure of centre should often be considered alongside a measure of spread.
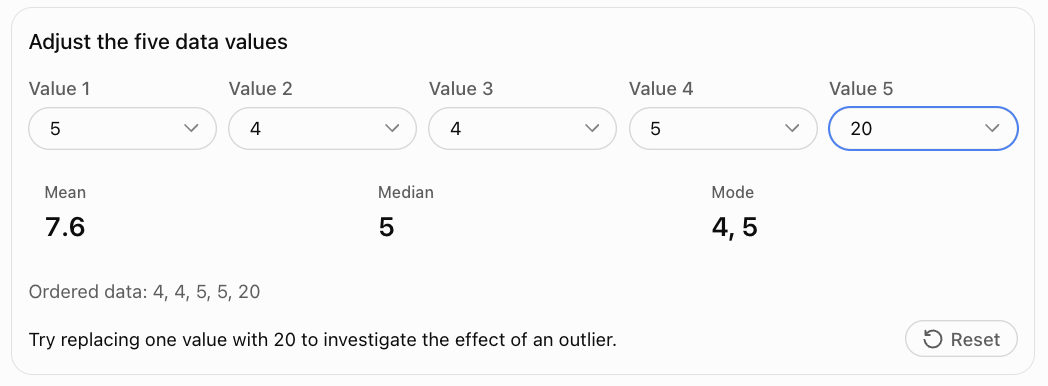
Interactive Practice: Calculate the Measures of Centre
Change the values in the dataset and observe how the mean, median, and mode respond.
Common Mistakes
Forgetting to divide when calculating the mean
The mean is the sum of the values divided by the number of values.
Dividing by the wrong number
Count every observation, including repeated values.
Failing to order the data before finding the median
The median depends on numerical order.
Selecting only one middle value for an even-sized dataset
When there are two middle values, calculate their mean.
Confusing the mode with the largest value
The mode is the most frequent value, not necessarily the greatest value.
Assuming every dataset has exactly one mode
A dataset can have no mode, one mode, or several modes.
Assuming the mean must appear in the dataset
The mean can be a decimal even when all values are whole numbers.
Ignoring outliers
Extreme values can substantially change the mean.
Using the mean for categorical data
Categories such as favourite colours cannot meaningfully be averaged.
Assuming the mean, median, and mode always agree
They often differ, especially in skewed distributions.
Reporting a measure without context
Always include appropriate units and explain what the value represents.
Key Terms
-
Data: Information collected for analysis.
-
Dataset: Collection of observations or values.
-
Observation: Individual value recorded in a dataset.
-
Measure of Centre: Statistic used to describe a typical or central value.
-
Central Tendency: Tendency of data to cluster around a central value.
-
Mean: Sum of numerical values divided by their number.
-
Arithmetic Mean: Another name for the ordinary mean.
-
Median: Middle value of an ordered dataset.
-
Mode: Most frequently occurring value.
-
Frequency: Number of times a value occurs.
-
Frequency Table: Table showing values and their frequencies.
-
Bimodal: Having two modes.
-
Multimodal: Having more than one mode.
-
Outlier: Value unusually far from the other observations.
-
Distribution: Pattern showing how data values are spread.
-
Symmetrical Distribution: Distribution with approximately matching sides.
-
Right-Skewed Distribution: Distribution with a longer tail toward larger values.
-
Left-Skewed Distribution: Distribution with a longer tail toward smaller values.
-
Categorical Data: Data describing categories or labels.
-
Numerical Data: Data represented by numbers with quantitative meaning.
-
Measure of Spread: Statistic describing variability in a dataset.
-
Representative Value: Value used to summarise a dataset.
Key Takeaways
-
Measures of centre describe typical or central values in a dataset.
-
The three main measures are mean, median, and mode.
-
The mean is calculated by dividing the sum of values by the number of values.
-
The median is the middle value after sorting the dataset.
-
For an even number of values, the median is the mean of the two middle values.
-
The mode is the most frequently occurring value.
-
A dataset may have multiple modes or no mode.
-
The mean is sensitive to unusually large or small values.
-
The median is resistant to outliers.
-
The mode can be used with categorical data.
-
Symmetrical datasets often have similar measures of centre.
-
Skewed datasets may have noticeably different means, medians, and modes.
-
The most appropriate measure depends on the data type and purpose.
-
Measures of centre should often be interpreted alongside measures of spread.
Check Your Understanding
Calculate the mean, median, and mode where appropriate.
-
2, 4, 6, 8, 10
-
3, 3, 5, 7, 7, 7
-
10, 15, 20, 25
-
4, 6, 6, 8, 10, 12
-
1, 2, 3, 4, 100
-
5, 5, 6, 6, 7, 8
-
12, 14, 16, 18, 20
-
2, 2, 3, 4, 4, 5, 5
-
7, 9, 11, 13, 15, 17
-
1.5, 2.0, 2.5, 3.0, 3.5
Answer the following questions.
-
Why must data be ordered before finding the median?
-
Which measure of centre is most affected by outliers?
-
Which measure is most appropriate for favourite colours?
-
Why is the median often preferred for household income?
-
Can a dataset have more than one mode?
Answers
|
Question |
Mean |
Median |
Mode |
|---|---|---|---|
|
1 |
6 |
6 |
None |
|
2 |
5.33 |
6 |
7 |
|
3 |
17.5 |
17.5 |
None |
|
4 |
7.67 |
7 |
6 |
|
5 |
22 |
3 |
None |
|
6 |
6.17 |
6 |
5 and 6 |
|
7 |
16 |
16 |
None |
|
8 |
3.57 |
4 |
2, 4 and 5 |
|
9 |
12 |
12 |
None |
|
10 |
2.5 |
2.5 |
None |
-
The median is determined by position in an ordered dataset.
-
The mean.
-
The mode.
-
It is less affected by extreme income values.
-
Yes. A dataset can be bimodal or multimodal.
Extended Challenge
Calculating Measures of Centre
-
Calculate the mean, median, and mode of: 12, 15, 15, 18, 20, 20, 20, 25.
-
Calculate the mean and median of: 3, 7, 8, 9, 12, 15.
-
Find the missing value if the mean of 4, 6, 8, x, 12 is 8.
-
Five numbers have a mean of 14. What is their total?
-
Six values have a total of 90. What is their mean?
Comparing Datasets
-
Dataset A: 5, 6, 7, 8, 9. Dataset B: 1, 3, 7, 11, 13. Compare their means and medians.
-
Create two different datasets with the same mean but different medians.
-
Create a dataset with exactly two modes.
-
Create a dataset with no mode.
-
Explain how adding a very large value changes the mean and median of a dataset.
Selecting Appropriate Measures
-
A school wants to identify the most common lunch choice. Which measure should be used?
-
A real estate company wants to describe typical house prices in an area containing several luxury homes. Which measure is likely most appropriate?
-
A scientist records 100 measurements from a stable instrument. Which measure might best represent the overall average?
-
A clothing store wants to determine which shirt size to order most frequently. Which measure should be used?
-
A researcher compares the incomes of two communities. Explain why reporting both mean and median may be useful.
Final Challenge: Statistical Investigation
A school records the time, in minutes, taken by 15 students to complete a mathematics activity.
The times are:
12, 15, 14, 18, 16, 15, 13, 17, 14, 15, 20, 16, 14, 19, 42
Complete the investigation.
-
Arrange the data in ascending order.
-
Calculate the mean completion time.
-
Determine the median completion time.
-
Identify the mode.
-
Construct a frequency table.
-
Identify any value that appears unusually high or low.
-
Explain how the unusually high value affects the mean.
-
Recalculate the mean after excluding the value 42, clearly stating that you have changed the dataset.
-
Compare the two means.
-
Determine whether the median changes when 42 is excluded.
-
Decide which measure of centre best represents a typical student's completion time.
-
Justify your choice using evidence.
-
Explain why reporting only the mean could be misleading.
-
Describe one possible reason for the unusually high completion time.
-
Write a short conclusion explaining what the dataset reveals about student performance.
Further Investigation
Collect a dataset of at least 20 values from a real situation, such as daily temperatures, travel times, test scores, or plant heights.
Calculate the mean, median, and mode. Construct an appropriate graph and investigate whether the distribution is symmetrical or skewed.
Explain which measure of centre provides the most meaningful summary and why.