Applications and Mathematical Modelling
1. Business and Economics
Learning outcomes
- I can model business situations using systems.
- I can solve profit and cost problems.
- I can interpret solutions in context.
- I can communicate mathematical conclusions.
- I can evaluate the reasonableness of answers.
Introduction
Businesses make decisions every day about prices, production, costs, sales, and profits. These decisions often involve several unknown quantities that are connected by mathematical relationships.
For example, a business owner may need to determine how many products must be sold to cover operating costs, compare two production methods, or calculate the quantities of different products sold from total revenue information.
Systems of equations provide a powerful way to represent and solve these problems.
By combining information about costs, revenue, and quantities, businesses can make informed decisions about pricing, production, and profitability.
Systems of equations are also used in economics to study supply and demand, market equilibrium, resource allocation, and financial planning.
In this topic, we will explore how to construct mathematical models of business situations, solve the resulting systems, and interpret the solutions in practical terms.
Why Are Systems of Equations Useful in Business?
A business rarely makes decisions using only one quantity.
For example, a company may need to consider:
-
The number of products manufactured.
-
The cost of producing each product.
-
The selling price of each product.
-
The fixed costs of operating the business.
-
The revenue earned from sales.
-
The profit or loss generated.
These quantities are often related.
If a company sells more products, its revenue generally increases. However, its production costs may also increase.
The business must understand how these relationships affect profitability.
Example: A Small Business
A company manufactures water bottles.
Each bottle sells for $15.
The variable production cost is $6 per bottle.
The company also pays $900 in fixed operating costs.
If x bottles are produced and sold, then:
Revenue:
R = 15x
Total cost:
C = 900 + 6x
Profit:
P = R − C
Therefore:
P = 15x − (900 + 6x)
P = 9x − 900
This equation shows how profit depends on the number of bottles sold.
If the company sells 100 bottles:
P = 9(100) − 900
P = 0
The business breaks even.
If the company sells 150 bottles:
P = 9(150) − 900
P = 450
The business earns a profit of $450.
If the company sells only 50 bottles:
P = 9(50) − 900
P = −450
The business makes a loss of $450.
These calculations illustrate how mathematical models can support business decisions.
Understanding Costs, Revenue, and Profit
Before solving business problems, we need to understand three important quantities.
Cost
Cost is the money a business spends to produce goods or provide services.
Costs are commonly divided into two categories.
Fixed costs do not change with the number of units produced within the relevant operating range.
Examples include:
-
Rent.
-
Insurance.
-
Salaried administrative staff.
-
Equipment leases.
-
Software subscriptions.
Variable costs change with production or sales volume.
Examples include:
-
Raw materials.
-
Packaging.
-
Production supplies.
-
Per-unit shipping costs.
-
Sales commissions.
Total Cost Formula
For a simple linear cost model:
C = F + vx
where:
-
C = total cost.
-
F = fixed cost.
-
v = variable cost per unit.
-
x = number of units produced.
For example, if fixed costs are $1,200 and variable costs are $8 per unit:
C = 1200 + 8x
Revenue
Revenue is the money received from selling goods or services.
For a constant selling price:
R = px
where:
-
R = total revenue.
-
p = selling price per unit.
-
x = number of units sold.
If a product sells for $20:
R = 20x
Profit
Profit is the amount remaining after costs are subtracted from revenue.
P = R − C
A positive profit indicates that revenue exceeds cost.
A negative profit indicates a loss.
A profit of zero indicates the business is breaking even.
Summary
|
Quantity |
Formula |
Meaning |
|---|---|---|
|
Total cost |
C = F + vx |
Money spent |
|
Revenue |
R = px |
Money received |
|
Profit |
P = R − C |
Revenue minus cost |
|
Break-even |
R = C |
Neither profit nor loss |
Understanding Break-Even Points
The break-even point is the production or sales level at which total revenue equals total cost.
At break-even:
R = C
This means:
Profit = 0
Businesses use break-even analysis to determine the minimum sales volume required to cover costs under a particular model.
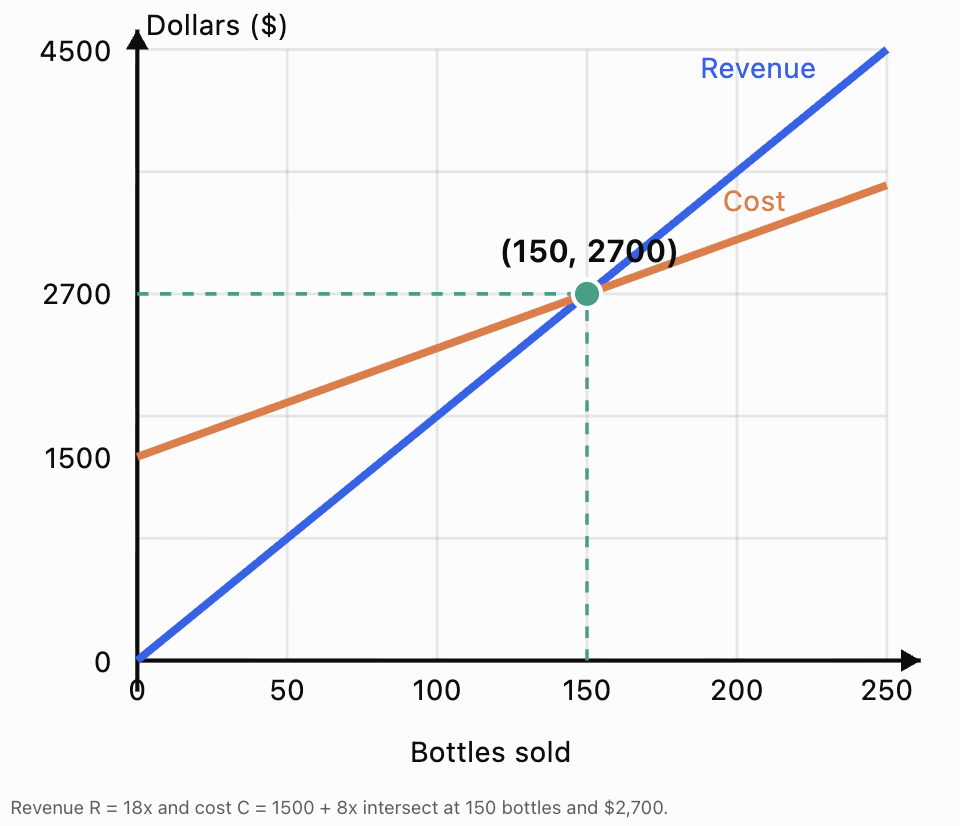
Worked Example: Break-Even Analysis
A company sells reusable bottles for $18 each.
The variable cost is $8 per bottle.
Fixed costs are $1,500.
Find the break-even quantity.
Step 1: Define the variable
x = number of bottles sold
Step 2: Write the revenue equation
R = 18x
Step 3: Write the cost equation
C = 1500 + 8x
Step 4: Set revenue equal to cost
18x = 1500 + 8x
Subtract 8x:
10x = 1500
x = 150
Step 5: Interpret
The company must sell 150 bottles to break even.
Step 6: Verify
Revenue:
R = 18(150) = $2700
Cost:
C = 1500 + 8(150)
C = 1500 + 1200
C = $2700
Revenue equals cost.
Answer: The break-even point is 150 bottles, with revenue and cost both equal to $2,700.
Graphing Break-Even Problems
Break-even analysis can be represented using two straight lines.
One line represents revenue.
The other represents total cost.
The point where the lines intersect is the break-even point.
Interpreting the graph
Before the intersection:
Cost is greater than revenue.
The business operates at a loss.
At the intersection:
Revenue equals cost.
The business breaks even.
After the intersection:
Revenue is greater than cost.
The business earns a profit.
Important assumptions
This linear model assumes that:
-
The selling price remains constant.
-
Variable cost per unit remains constant.
-
Fixed costs remain unchanged.
-
All produced units are sold.
-
The business has sufficient production capacity.
Real businesses may experience changing prices, discounts, additional costs, and production limits.
Therefore, the model is useful but simplified.
Application: Comparing Two Business Plans
A company is considering two ways to manufacture a product.
Plan A
Fixed costs: $2,000
Variable cost: $5 per unit
Plan B
Fixed costs: $800
Variable cost: $9 per unit
The company wants to know which plan is cheaper at different production levels.
Step 1: Define the variable
x = number of units manufactured
Step 2: Construct the cost equations
Plan A:
Cₐ = 2000 + 5x
Plan B:
Cᵦ = 800 + 9x
Step 3: Find the intersection
At the intersection, both plans have the same cost.
2000 + 5x = 800 + 9x
1200 = 4x
x = 300
Step 4: Calculate the cost
Plan A:
Cₐ = 2000 + 5(300)
Cₐ = $3500
Plan B:
Cᵦ = 800 + 9(300)
Cᵦ = $3500
The two plans cost the same when 300 units are manufactured.
Step 5: Compare different production levels
|
Units produced |
Plan A |
Plan B |
Cheaper plan |
|---|---|---|---|
|
100 |
$2,500 |
$1,700 |
B |
|
200 |
$3,000 |
$2,600 |
B |
|
300 |
$3,500 |
$3,500 |
Equal |
|
400 |
$4,000 |
$4,400 |
A |
|
500 |
$4,500 |
$5,300 |
A |
Business conclusion
Plan B is cheaper for fewer than 300 units because it has lower fixed costs.
Plan A is cheaper for more than 300 units because it has a lower variable cost per unit.
The decision depends on expected production volume.
This example demonstrates how solving a system can identify the point at which one business strategy becomes more economical than another.
Application: Finding Fixed and Variable Costs
A manufacturer records the following production costs:
-
Producing 100 units costs $1,400.
-
Producing 250 units costs $2,600.
Assuming a linear cost model, determine the fixed cost and variable cost per unit.
Step 1: Define variables
F = fixed cost, in dollars
v = variable cost per unit, in dollars
The model is:
C = F + vx
Step 2: Construct equations
For 100 units:
F + 100v = 1400
For 250 units:
F + 250v = 2600
Step 3: Eliminate F
Subtract the first equation from the second:
150v = 1200
v = 8
Step 4: Find F
F + 100(8) = 1400
F + 800 = 1400
F = 600
Step 5: Interpret
Fixed cost = $600
Variable cost = $8 per unit
Therefore:
C = 600 + 8x
Step 6: Verify
At 100 units:
C = 600 + 8(100) = $1400
At 250 units:
C = 600 + 8(250) = $2600
Both values match the original data.
Business conclusion
The company spends $600 regardless of production volume within the model's operating range, plus $8 for each unit manufactured.
This information can help the business forecast costs at other production levels.
Application: Determining Product Prices from Sales
A school shop sells notebooks and pens.
On Monday, it sells 30 notebooks and 20 pens for $190.
On Tuesday, it sells 20 notebooks and 40 pens for $200.
Find the selling price of each item.
Step 1: Define variables
n = selling price of one notebook
p = selling price of one pen
Step 2: Construct equations
Monday:
30n + 20p = 190
Tuesday:
20n + 40p = 200
Step 3: Simplify
Divide the first equation by 10:
3n + 2p = 19
Divide the second equation by 20:
n + 2p = 10
Step 4: Eliminate p
Subtract the second equation from the first:
2n = 9
n = 4.50
Step 5: Find p
4.50 + 2p = 10
2p = 5.50
p = 2.75
Step 6: Verify
Monday:
30(4.50) + 20(2.75)
= 135 + 55 = $190
Tuesday:
20(4.50) + 40(2.75)
= 90 + 110 = $200
Answer: Notebooks sell for $4.50 and pens sell for $2.75.
Economic interpretation
The system determines the prices that are consistent with both days' sales records, assuming the prices were unchanged and the recorded revenue came only from these items.
Application: Three Products and Total Revenue
A company sells three products: A, B, and C.
Their selling prices are:
-
Product A: $10
-
Product B: $15
-
Product C: $20
During one day, the company sells 100 products and earns $1,500.
It sells 20 more units of Product A than Product C.
Find the quantity of each product sold.
Step 1: Define variables
a = number of Product A units
b = number of Product B units
c = number of Product C units
Step 2: Construct equations
Total units:
a + b + c = 100
Revenue:
10a + 15b + 20c = 1500
Relationship:
a − c = 20
Step 3: Eliminate a
Multiply the total quantity equation by 10:
10a + 10b + 10c = 1000
Subtract from the revenue equation:
5b + 10c = 500
Divide by 5:
b + 2c = 100
Step 4: Use the third equation
a = c + 20
Substitute into the total quantity equation:
c + 20 + b + c = 100
b + 2c = 80
Step 5: Interpret the contradiction
The system requires both:
b + 2c = 100
and:
b + 2c = 80
These cannot both be true.
Therefore, the sales records are inconsistent.
Answer: No solution exists for the stated information.
What could this mean for the business?
Possible explanations include incorrect sales totals, inaccurate revenue records, or an incorrect statement about the relationship between products A and C.
A system of equations can therefore help identify problems in business data, not just calculate unknown quantities.
A consistent version
Suppose the revenue was $1,400 rather than $1,500.
The revenue equation becomes:
10a + 15b + 20c = 1400
Subtracting 10 times the quantity equation gives:
b + 2c = 80
This is the same relationship obtained from a = c + 20.
The revised system has infinitely many solutions, not one unique solution.
An additional independent piece of information would be required to determine the exact quantities.
This illustrates an important limitation: three equations do not guarantee a unique solution if some equations contain redundant information.
Application: Production Planning with Three Products
A factory produces three types of furniture: chairs, tables, and shelves.
Each product requires a different amount of assembly time.
|
Product |
Assembly time per unit |
|---|---|
|
Chair |
2 hours |
|
Table |
4 hours |
|
Shelf |
3 hours |
The factory manufactures 100 items using 290 assembly-hours.
It manufactures 10 more chairs than shelves.
Determine the number of each product.
Step 1: Define variables
c = chairs manufactured
t = tables manufactured
s = shelves manufactured
Step 2: Construct equations
Total items:
c + t + s = 100
Total assembly time:
2c + 4t + 3s = 290
Quantity relationship:
c − s = 10
Step 3: Eliminate c
Multiply the first equation by 2:
2c + 2t + 2s = 200
Subtract from the assembly-time equation:
2t + s = 90
Step 4: Use the relationship
c = s + 10
Substitute into the total quantity equation:
s + 10 + t + s = 100
t + 2s = 90
Step 5: Solve the reduced system
We have:
2t + s = 90
t + 2s = 90
Multiply the second equation by 2:
2t + 4s = 180
Subtract the first equation:
3s = 90
s = 30
Then:
t + 2(30) = 90
t = 30
And:
c = 30 + 10 = 40
Step 6: Verify
Total items:
40 + 30 + 30 = 100
Assembly time:
2(40) + 4(30) + 3(30)
= 80 + 120 + 90
= 290 hours
Quantity relationship:
40 − 30 = 10
Answer: 40 chairs, 30 tables, and 30 shelves.
Business conclusion
The factory's production records are consistent with manufacturing 40 chairs, 30 tables, and 30 shelves.
This information could be used to estimate material requirements, labour costs, and future production capacity.
Application: Profit Targets
A business sells handmade bags for $35 each.
The variable cost is $15 per bag.
Monthly fixed costs are $2,400.
The owner wants to earn a monthly profit of $1,600.
How many bags must be sold?
Step 1: Define the variable
x = number of bags sold
Step 2: Write the revenue equation
R = 35x
Step 3: Write the cost equation
C = 2400 + 15x
Step 4: Write the profit equation
P = R − C
P = 35x − (2400 + 15x)
P = 20x − 2400
Step 5: Set the target profit
1600 = 20x − 2400
4000 = 20x
x = 200
Step 6: Verify
Revenue:
35(200) = $7000
Total cost:
2400 + 15(200) = $5400
Profit:
7000 − 5400 = $1600
Answer: The business must sell 200 bags to achieve the target profit of $1,600.
Understanding Contribution Margin
The contribution margin per unit is the selling price minus the variable cost per unit.
Contribution margin = p − v
For this business:
35 − 15 = $20 per bag
Each bag sold contributes $20 toward covering fixed costs and generating profit.
This allows us to write:
P = (p − v)x − F
For a target profit T:
x = (F + T)/(p − v)
provided p − v is positive.
In this example:
x = (2400 + 1600)/(35 − 15)
x = 4000/20
x = 200 bags
When the answer is not a whole number
Suppose the calculation gives:
x = 152.4
If x represents complete products, the business generally needs to sell at least 153 products to reach or exceed its target, assuming the contribution margin is positive.
Rounding down would not achieve the required profit.
Application: Comparing Profit Between Two Businesses
Two businesses sell the same type of product.
Business A has:
-
Selling price: $25 per unit
-
Variable cost: $10 per unit
-
Fixed cost: $1,500
Business B has:
-
Selling price: $25 per unit
-
Variable cost: $7 per unit
-
Fixed cost: $2,400
At what sales volume do the businesses earn the same profit?
Step 1: Construct the profit equations
Business A:
Pₐ = 25x − (1500 + 10x)
Pₐ = 15x − 1500
Business B:
Pᵦ = 25x − (2400 + 7x)
Pᵦ = 18x − 2400
Step 2: Set the profits equal
15x − 1500 = 18x − 2400
900 = 3x
x = 300
Step 3: Calculate the profit
Business A:
Pₐ = 15(300) − 1500 = $3000
Business B:
Pᵦ = 18(300) − 2400 = $3000
Both businesses earn $3,000 profit at 300 units sold.
Step 4: Interpret
Below 300 units, Business A earns more profit because it has lower fixed costs.
Above 300 units, Business B earns more profit because its variable cost per unit is lower.
Comparison table
|
Units sold |
Business A profit |
Business B profit |
|---|---|---|
|
100 |
$0 |
−$600 |
|
200 |
$1,500 |
$1,200 |
|
300 |
$3,000 |
$3,000 |
|
400 |
$4,500 |
$4,800 |
|
500 |
$6,000 |
$6,600 |
Business conclusion
The better business model depends on expected sales volume.
A business expecting relatively low sales may prefer lower fixed costs, while one expecting higher sales may benefit from lower variable costs.
Applications in Economics: Supply and Demand
Systems of equations are also used to model markets.
Two important economic concepts are supply and demand.
Demand
Demand describes how much of a product consumers are willing and able to purchase at different prices.
In a simple linear model, quantity demanded decreases as price increases.
For example:
Qd = 100 − 2p
where:
Qd = quantity demanded
p = price
Supply
Supply describes how much producers are willing and able to sell at different prices.
In a simple linear model, quantity supplied increases as price increases.
For example:
Qs = 20 + 2p
Market Equilibrium
Market equilibrium occurs when:
Qd = Qs
This is the price at which quantity demanded equals quantity supplied in the model.
Worked Example: Finding Equilibrium Price
Demand equation:
Qd = 100 − 2p
Supply equation:
Qs = 20 + 2p
At equilibrium:
100 − 2p = 20 + 2p
80 = 4p
p = 20
Substitute into demand:
Qd = 100 − 2(20)
Qd = 60
Substitute into supply:
Qs = 20 + 2(20)
Qs = 60
Equilibrium price = $20
Equilibrium quantity = 60 units
Interpreting the result
At a price of $20, consumers demand 60 units and producers supply 60 units.
At prices below equilibrium, the model predicts that quantity demanded exceeds quantity supplied.
At prices above equilibrium, the model predicts that quantity supplied exceeds quantity demanded.
Important limitation
Real markets are influenced by many factors, including consumer preferences, competition, income, taxes, and changes in production costs.
Linear supply-and-demand equations are simplified models, not exact predictions of every market.
Application: Comparing Subscription Plans
A business is choosing between two software subscriptions.
Plan A charges:
$50 per month plus $4 per user.
Plan B charges:
$110 per month plus $2 per user.
Find the number of users at which the plans cost the same.
Step 1: Define the variable
x = number of users
Step 2: Construct equations
Plan A:
Cₐ = 50 + 4x
Plan B:
Cᵦ = 110 + 2x
Step 3: Set costs equal
50 + 4x = 110 + 2x
2x = 60
x = 30
Step 4: Verify
Plan A:
50 + 4(30) = $170
Plan B:
110 + 2(30) = $170
Answer: Both plans cost $170 per month for 30 users.
Business interpretation
For fewer than 30 users, Plan A is cheaper.
For more than 30 users, Plan B is cheaper.
At exactly 30 users, both plans have the same monthly cost.
This type of comparison is useful when choosing subscriptions, equipment leases, service providers, or production arrangements.
Using Technology in Business Modelling
Spreadsheets and graphing software are useful for business analysis.
For example, a spreadsheet can calculate revenue, cost, and profit for many different sales volumes.
Consider:
R = 18x
C = 1500 + 8x
P = 10x − 1500
A spreadsheet could generate the following table.
|
Units sold |
Revenue |
Total cost |
Profit |
|---|---|---|---|
|
0 |
$0 |
$1,500 |
−$1,500 |
|
50 |
$900 |
$1,900 |
−$1,000 |
|
100 |
$1,800 |
$2,300 |
−$500 |
|
150 |
$2,700 |
$2,700 |
$0 |
|
200 |
$3,600 |
$3,100 |
$500 |
|
250 |
$4,500 |
$3,500 |
$1,000 |
The table makes the break-even point easy to identify.
Using graphing software
You can enter:
y = 18x
y = 1500 + 8x
into Desmos Graphing Calculator or GeoGebra Graphing Calculator.
The intersection represents the break-even point.
Technology is particularly useful when businesses need to compare several scenarios or change assumptions.
Evaluating the Reasonableness of Business Solutions
A mathematical answer must make sense in the business context.
Check 1: Units
If x represents the number of products sold, the answer should be expressed in units, not dollars.
If P represents profit, the answer should be expressed in money.
Check 2: Whole numbers
If a calculation gives:
x = 125.6 products
the business cannot normally sell 0.6 of a complete product.
If the goal is to meet or exceed a minimum profit, round up to 126 products when the model supports doing so.
Check 3: Negative values
A negative profit represents a loss.
However, a negative number of products sold is usually invalid in a simple sales model.
Check 4: Capacity
A company may calculate that it needs to sell 5,000 units to achieve its target.
But if it can only produce 3,000 units, the target cannot be reached under the current model.
Check 5: Model assumptions
A linear model assumes constant rates.
Real businesses may experience:
-
Bulk discounts.
-
Changes in labour costs.
-
Limited production capacity.
-
Seasonal demand.
-
Changing selling prices.
-
Additional fixed costs at higher output levels.
These factors can make a simple linear model less accurate.
Check 6: Verification
Always substitute calculated values into the original equations.
For example, if a system predicts that 40 units of A and 30 units of B generate $1,100:
20(40) + 10(30) = 1100
800 + 300 = 1100
The revenue equation is satisfied.
But other conditions must also be checked.
Communicating Mathematical Conclusions
In business and economics, a numerical answer is often not enough.
A complete conclusion should explain what the result means and how it can support a decision.
Example: Weak conclusion
x = 300
Improved conclusion
The two production plans have equal costs when 300 units are manufactured.
Strong conclusion
The two production plans each cost $3,500 at a production level of 300 units. Plan B is cheaper below 300 units because it has lower fixed costs, while Plan A is cheaper above 300 units because it has lower variable costs. Therefore, the company should consider its expected production volume before choosing a plan.
The final conclusion connects the mathematical result to a practical business decision.
A useful structure
When communicating a business solution, include:
-
Result: State the numerical answer with units.
-
Meaning: Explain what the value represents.
-
Verification: Show that it satisfies the original conditions.
-
Recommendation: Explain what the result suggests.
-
Limitation: Identify any assumptions that could affect the decision.
Common Mistakes
Confusing revenue with profit
Revenue is money received from sales. Profit is revenue minus total costs.
Forgetting fixed costs
A business may lose money even when each product sells for more than its variable production cost.
Using the wrong break-even equation
Break-even occurs when total revenue equals total cost, not when revenue equals variable cost alone.
Mixing prices and quantities
The selling price of a product and the number of products sold are different variables.
Constructing incorrect revenue equations
Revenue is calculated by multiplying price by quantity.
Forgetting to include all products
When several products are sold, total revenue must include the revenue from every product.
Rounding sales quantities incorrectly
When calculating the minimum number of complete units required to reach a profit target, round up when appropriate.
Assuming every system has a unique solution
Some business systems contain redundant or contradictory information.
Ignoring production capacity
A mathematically possible sales target may be impossible with existing resources.
Accepting unrealistic negative quantities
Negative profit may be meaningful, but negative quantities of physical products are generally not.
Failing to explain the result
Business conclusions should describe the meaning of the answer, not just provide a number.
Ignoring assumptions
Constant selling prices and costs may not remain realistic over large production ranges.
Key Terms
-
Fixed cost: A cost that remains constant over the relevant production range.
-
Variable cost: A cost that changes with production volume.
-
Total cost: The combined fixed and variable costs.
-
Revenue: Money received from sales.
-
Profit: Revenue minus total cost.
-
Loss: A negative profit.
-
Break-even point: The sales volume at which revenue equals total cost.
-
Contribution margin: Selling price minus variable cost per unit.
-
Selling price: The amount charged for a product or service.
-
Unit cost: The cost associated with one unit.
-
Production volume: The number of units manufactured.
-
Sales volume: The number of units sold.
-
Profit target: A desired amount of profit.
-
Cost model: An equation representing how costs depend on production or activity.
-
Revenue model: An equation representing income from sales.
-
Supply: The quantity producers are willing and able to sell at different prices.
-
Demand: The quantity consumers are willing and able to buy at different prices.
-
Market equilibrium: The point where quantity supplied equals quantity demanded.
-
Constraint: A restriction on possible values or decisions.
-
Mathematical model: A representation of a real-world situation using equations.
-
Verification: Checking that a solution satisfies the original equations.
-
Reasonableness: Evaluating whether a mathematical result makes sense in context.
Key Takeaways
-
Systems of equations can model costs, revenue, profit, and production.
-
Total cost can be represented by C = F + vx.
-
Revenue can be represented by R = px when selling price is constant.
-
Profit is calculated using P = R − C.
-
Break-even occurs when revenue equals total cost.
-
Systems can compare two business plans and identify when their costs or profits are equal.
-
Two or more sales records can help determine unknown prices or quantities.
-
Three-variable systems can model production involving several products.
-
Supply-and-demand systems can determine market equilibrium in simplified economic models.
-
Mathematical solutions should be interpreted using appropriate units.
-
Business decisions should consider capacity, realistic quantities, and model assumptions.
-
Strong conclusions explain what a solution means and how it supports a decision.
Check Your Understanding
Recall and Understanding
1. Explain the difference between fixed costs and variable costs. Give one example of each.
2. Define revenue, cost, and profit.
3. What does the break-even point represent?
4. Explain why a business might prefer a production method with higher fixed costs but lower variable costs.
5. Why should a business evaluate the assumptions of a mathematical model before using it to make decisions?
Cost and Profit Problems
6. A company sells water bottles for $20 each. Variable costs are $8 per bottle, and fixed costs are $1,200.
a. Write the revenue equation.
b. Write the total cost equation.
c. Write the profit equation.
d. Find the break-even quantity.
7. A business sells products for $30 each. Variable costs are $12 per unit, and fixed costs are $1,800.
How many products must be sold to earn a profit of $1,800?
8. A manufacturer has fixed costs of $750 and variable costs of $6 per unit.
Calculate the total cost of producing 200 units.
9. A company records total costs of $1,500 when producing 100 units and $2,700 when producing 300 units.
Assuming a linear cost model, determine the fixed cost and variable cost per unit.
10. A company sells 250 products at $24 each. Total costs are $4,200.
Calculate revenue and profit.
Systems and Business Applications
11. Two companies offer production services.
Plan A: $1,000 fixed cost plus $8 per unit.
Plan B: $400 fixed cost plus $12 per unit.
Find the production quantity at which the plans cost the same.
12. A school sells adult tickets for $15 and student tickets for $10.
A total of 120 tickets are sold, generating $1,500.
Determine the number of each ticket type.
13. A shop sells notebooks and pens.
Three notebooks and two pens cost $23.
Two notebooks and four pens cost $26.
Find the price of each item.
14. A factory manufactures chairs, tables, and shelves.
It produces 100 items using 290 assembly-hours.
Each chair requires 2 hours, each table 4 hours, and each shelf 3 hours.
The factory produces 10 more chairs than shelves.
Determine the number of each product.
15. The demand and supply equations for a product are:
Qd = 120 − 3p
Qs = 20 + 2p
Find the equilibrium price and quantity.
Challenge
16. A company sells a product for $25 per unit. Its fixed costs are $2,000, and its variable costs are $10 per unit.
The company can produce at most 180 units.
Can it achieve a profit of $1,000? Explain using calculations.
17. A business compares two profit models:
Pₐ = 12x − 900
Pᵦ = 15x − 1500
Determine when the profits are equal and which model is better for higher sales volumes.
18. A company sells two products.
Product A sells for $20 and Product B for $30.
The company sells 100 units and earns $2,400.
Find the quantity of each product.
19. A manufacturer calculates that it must sell 175.4 units to reach a profit target.
Explain how the answer should be interpreted if only complete units can be sold.
20. A business reports:
x + y + z = 100
2x + 3y + 4z = 290
x − z = 10
Solve the system and explain what the solution could represent in a production context.
Answers to Check Your Understanding
1. Fixed and variable costs
Fixed costs remain unchanged over the relevant production range, such as monthly rent.
Variable costs change with the number of units produced, such as raw materials or packaging.
2. Revenue, cost, and profit
Revenue is money received from sales.
Cost is money spent to operate the business or produce goods.
Profit is the difference:
P = R − C
3. Break-even point
The break-even point is where total revenue equals total cost.
At this point, profit is zero.
4. Higher fixed costs and lower variable costs
A company with higher fixed costs but lower variable costs may become cheaper at high production volumes.
The lower variable cost can eventually offset the higher fixed cost.
5. Evaluating assumptions
Mathematical models simplify real situations.
For example, a linear model may assume constant selling prices, fixed costs, and variable costs.
If these assumptions do not hold, the model's predictions may become inaccurate.
6. Water bottle business
Given:
Selling price = $20
Variable cost = $8
Fixed cost = $1,200
a. Revenue:
R = 20x
b. Total cost:
C = 1200 + 8x
c. Profit:
P = 20x − (1200 + 8x)
P = 12x − 1200
d. Break-even:
20x = 1200 + 8x
12x = 1200
x = 100
Answer: The business breaks even at 100 bottles.
Verification:
Revenue = 20(100) = $2000
Cost = 1200 + 8(100) = $2000
7. Profit target
Selling price = $30
Variable cost = $12
Fixed cost = $1800
Target profit = $1800
Profit equation:
P = 30x − (1800 + 12x)
P = 18x − 1800
Set the target:
1800 = 18x − 1800
3600 = 18x
x = 200
Answer: 200 products.
Verification:
Revenue = 30(200) = $6000
Cost = 1800 + 12(200) = $4200
Profit = $1800
8. Total production cost
C = F + vx
C = 750 + 6(200)
C = 750 + 1200
Answer: $1,950.
9. Finding fixed and variable costs
Let:
F = fixed cost
v = variable cost per unit
Construct equations:
F + 100v = 1500
F + 300v = 2700
Subtract:
200v = 1200
v = 6
Substitute:
F + 100(6) = 1500
F = 900
Answer: Fixed cost = $900; variable cost = $6 per unit.
Cost equation:
C = 900 + 6x
10. Revenue and profit
Revenue:
R = 250(24)
R = $6000
Profit:
P = R − C
P = 6000 − 4200
Answer: Revenue = $6,000; profit = $1,800.
11. Comparing production plans
Plan A:
Cₐ = 1000 + 8x
Plan B:
Cᵦ = 400 + 12x
Set costs equal:
1000 + 8x = 400 + 12x
600 = 4x
x = 150
Calculate cost:
1000 + 8(150) = $2200
400 + 12(150) = $2200
Answer: Both plans cost $2,200 at 150 units.
Below 150 units, Plan B is cheaper.
Above 150 units, Plan A is cheaper.
12. Ticket sales
Let:
a = adult tickets
s = student tickets
Equations:
a + s = 120
15a + 10s = 1500
Multiply the first equation by 10:
10a + 10s = 1200
Subtract:
5a = 300
a = 60
Then:
s = 120 − 60
s = 60
Answer: 60 adult tickets and 60 student tickets.
Verification:
60 + 60 = 120
15(60) + 10(60) = $1500
13. Notebook and pen prices
Let:
n = notebook price
p = pen price
Equations:
3n + 2p = 23
2n + 4p = 26
Multiply the first equation by 2:
6n + 4p = 46
Subtract the second equation:
4n = 20
n = 5
Substitute:
3(5) + 2p = 23
2p = 8
p = 4
Answer: Notebook = $5; pen = $4.
Verification:
3(5) + 2(4) = 23
2(5) + 4(4) = 26
14. Furniture production
Let:
c = chairs
t = tables
s = shelves
Equations:
c + t + s = 100
2c + 4t + 3s = 290
c − s = 10
From the third equation:
c = s + 10
Substitute into the total quantity equation:
t + 2s = 90
Substitute into the assembly-time equation:
2(s + 10) + 4t + 3s = 290
4t + 5s = 270
Multiply t + 2s = 90 by 4:
4t + 8s = 360
Subtract:
3s = 90
s = 30
Then:
t = 90 − 2(30) = 30
c = 30 + 10 = 40
Answer: 40 chairs, 30 tables, and 30 shelves.
Verification:
40 + 30 + 30 = 100
2(40) + 4(30) + 3(30) = 290
15. Market equilibrium
Demand:
Qd = 120 − 3p
Supply:
Qs = 20 + 2p
At equilibrium:
120 − 3p = 20 + 2p
100 = 5p
p = 20
Substitute:
Q = 120 − 3(20)
Q = 60
Answer: Equilibrium price = $20; equilibrium quantity = 60 units.
Verification:
Demand = 60
Supply = 20 + 2(20) = 60
16. Profit target and capacity
Selling price = $25
Variable cost = $10
Fixed cost = $2000
Maximum production = 180 units
Profit equation:
P = 25x − (2000 + 10x)
P = 15x − 2000
To earn $1000:
1000 = 15x − 2000
3000 = 15x
x = 200
However, the company can only produce 180 units.
Maximum profit at full capacity:
P = 15(180) − 2000
P = 2700 − 2000
P = $700
Answer: No. The company cannot achieve a $1,000 profit under the stated conditions. Its maximum possible profit is $700 if it produces and sells all 180 units.
17. Comparing profit models
Pₐ = 12x − 900
Pᵦ = 15x − 1500
Set equal:
12x − 900 = 15x − 1500
600 = 3x
x = 200
Calculate profit:
Pₐ = 12(200) − 900 = $1500
Pᵦ = 15(200) − 1500 = $1500
Answer: Both models produce $1,500 profit at 200 units.
For more than 200 units, Model B produces greater profit because its profit increases by $15 per additional unit compared with $12 for Model A.
18. Two-product sales
Let:
a = units of Product A
b = units of Product B
Total quantity:
a + b = 100
Revenue:
20a + 30b = 2400
Multiply the first equation by 20:
20a + 20b = 2000
Subtract:
10b = 400
b = 40
Then:
a = 60
Answer: 60 units of Product A and 40 units of Product B.
Verification:
60 + 40 = 100
20(60) + 30(40) = $2400
19. Fractional sales quantity
The calculated quantity is:
x = 175.4
If the business must sell complete units and needs to reach or exceed a profit target, it should round up.
Answer: The business must sell at least 176 units, assuming profit increases with each additional unit and the model remains valid.
Rounding down to 175 would leave the business below its target.
20. Three-product production
Given:
x + y + z = 100
2x + 3y + 4z = 290
x − z = 10
From the third equation:
x = z + 10
Substitute into the first:
(z + 10) + y + z = 100
y + 2z = 90
Substitute into the second:
2(z + 10) + 3y + 4z = 290
3y + 6z = 270
Divide by 3:
y + 2z = 90
Both reduced equations are identical.
Therefore, the system does not have a unique solution.
Let z = t.
Then:
x = t + 10
y = 90 − 2t
The general solution is:
(x, y, z) = (t + 10, 90 − 2t, t)
For nonnegative quantities:
0 ≤ t ≤ 45
If the variables represent complete products, t must be an integer.
For example, one possible production combination is:
x = 40
y = 30
z = 30
Verification:
40 + 30 + 30 = 100
2(40) + 3(30) + 4(30) = 290
40 − 30 = 10
Answer: The system has infinitely many nonnegative real solutions and 46 possible whole-number production combinations.
An additional independent condition would be needed to determine the exact production quantities.
Final Summary
Systems of equations provide a practical foundation for analysing business and economic situations.
They can be used to calculate costs, determine prices, establish profit targets, identify break-even points, compare business strategies, and investigate supply-and-demand relationships.
However, mathematical calculations are only part of effective business decision-making. Results must be verified, interpreted using appropriate units, and evaluated against real-world constraints.
The most valuable business solution is not simply a correct number, but a well-supported conclusion that helps explain a situation and guide a decision.