Transformations of Graphs
1. Translations
Learning outcomes
- I can describe horizontal translations.
- I can describe vertical translations.
- I can predict translated graphs.
- I can relate equations to translations.
- I can sketch translated graphs.
Introduction
A translation is a transformation that moves a graph from one position to another without changing its shape, size, or orientation.
Translations are one of the most important transformations in mathematics because they help us understand how changing an equation affects the position of its graph.
For example, consider the quadratic function:
y = x²
Its graph is a parabola with a vertex at (0, 0).
If we change the equation to:
y = x² + 3
the entire parabola moves 3 units upward.
If we change the equation to:
y = (x − 4)²
the parabola moves 4 units to the right.
These changes are examples of vertical and horizontal translations.
Translations are useful when studying linear functions, quadratic functions, absolute value functions, exponential functions, trigonometric functions, and many other mathematical relationships.
In this topic, we will explore how to describe translations, predict their effects on graphs, relate equations to movements, and sketch translated functions accurately.
What Is a Translation?
A translation is a transformation in which every point of a graph moves the same distance in the same direction.
During a translation:
-
The shape of the graph remains unchanged.
-
The size of the graph remains unchanged.
-
The orientation remains unchanged.
-
Every point moves by the same horizontal and vertical amounts.
-
The domain and range may change depending on the translation.
For example, suppose a point A is located at (2, 3).
If the point moves 4 units right and 2 units up, its new coordinates are:
A′ = (2 + 4, 3 + 2)
A′ = (6, 5)
The same movement can be applied to every point on a graph.
Coordinate rule for translations
A translation of h units horizontally and k units vertically follows the rule:
(x, y) → (x + h, y + k)
where:
-
h > 0 means moving right.
-
h < 0 means moving left.
-
k > 0 means moving up.
-
k < 0 means moving down.
For example:
(x, y) → (x + 3, y − 2)
represents a translation 3 units right and 2 units down.
Visualising a Translation
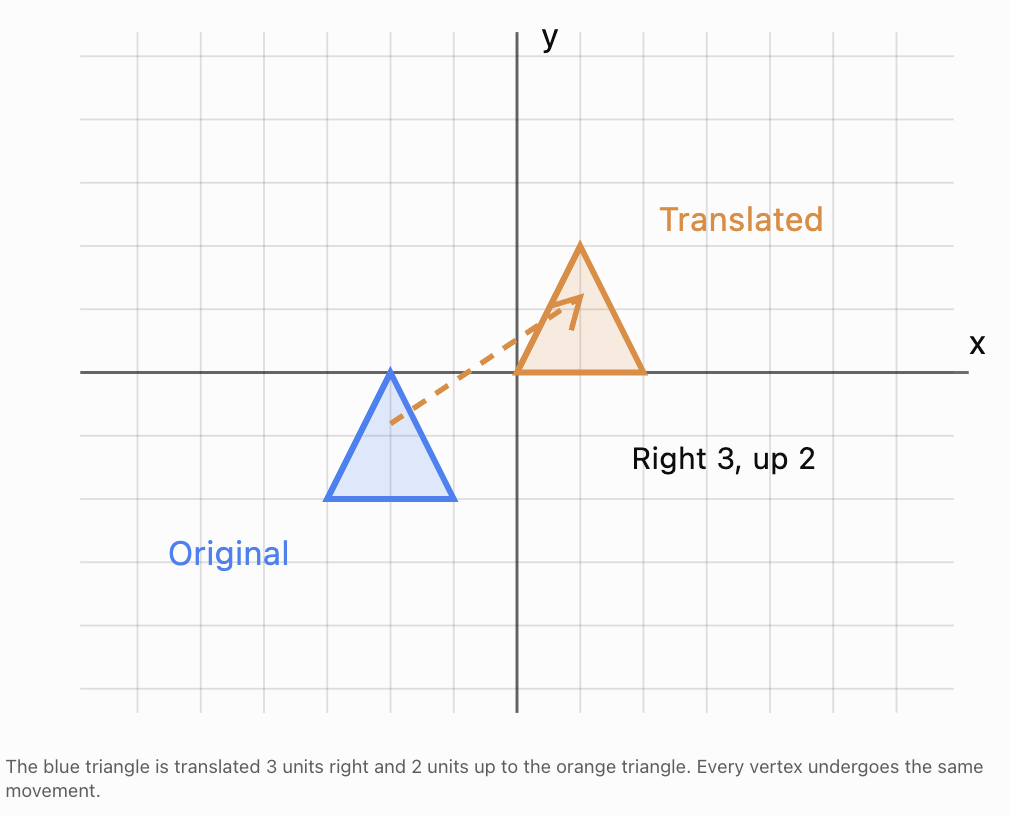
Although this illustration uses a triangle, exactly the same principle applies to graphs of functions.
Horizontal Translations
A horizontal translation moves a graph to the left or right.
Suppose the original function is:
y = f(x)
A horizontal translation is represented by:
y = f(x − h)
where h is the horizontal movement.
-
If h is positive, the graph moves right.
-
If h is negative, the graph moves left.
This can initially seem confusing because the sign inside the brackets appears opposite to the direction of movement.
Horizontal translation rules
|
Equation |
Translation |
|---|---|
|
y = f(x − 2) |
2 units right |
|
y = f(x − 5) |
5 units right |
|
y = f(x + 3) |
3 units left |
|
y = f(x + 7) |
7 units left |
Why does the sign appear reversed?
Consider:
y = x²
The original vertex occurs when x = 0.
Now consider:
y = (x − 3)²
The squared expression is zero when:
x − 3 = 0
x = 3
Therefore, the vertex moves from (0, 0) to (3, 0).
The graph moves right, even though the equation contains subtraction.
Worked Example: Translating a Parabola Right
Original function:
y = x²
Translated function:
y = (x − 2)²
The graph moves 2 units to the right.
Compare corresponding points:
|
Original point |
Translated point |
|---|---|
|
(−2, 4) |
(0, 4) |
|
(−1, 1) |
(1, 1) |
|
(0, 0) |
(2, 0) |
|
(1, 1) |
(3, 1) |
|
(2, 4) |
(4, 4) |
Notice that every x-coordinate increases by 2 while the y-coordinate remains unchanged.
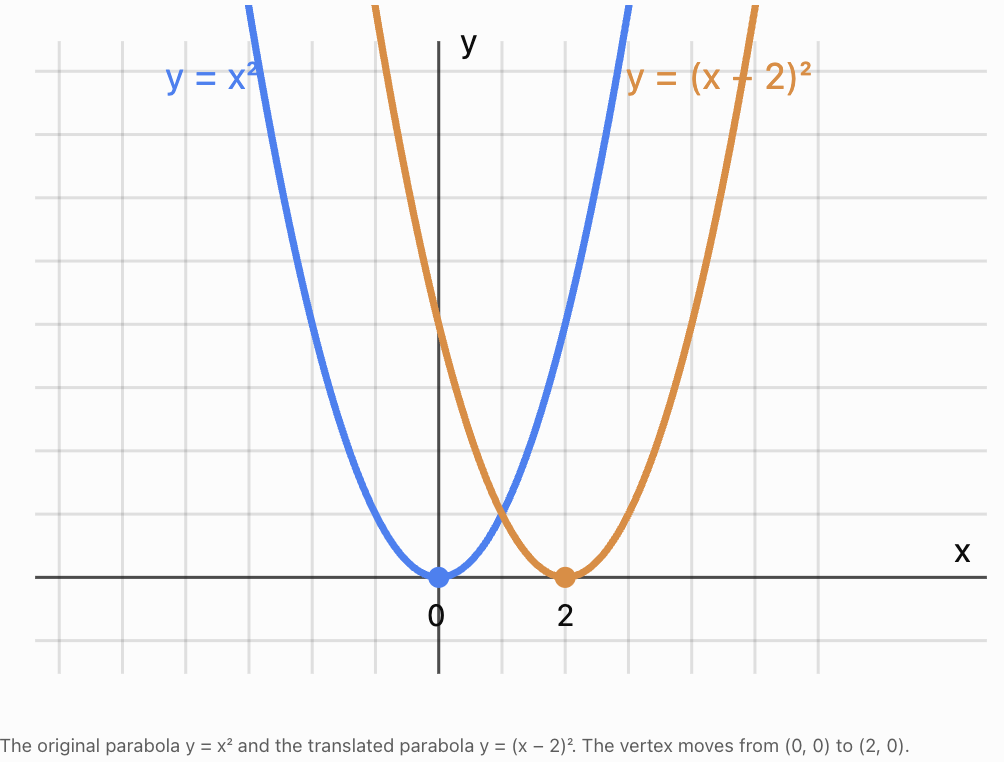
The graph's shape does not change. Only its position changes.
Worked Example: Translating a Graph Left
Original function:
y = |x|
Translated function:
y = |x + 4|
The graph moves 4 units left.
The original vertex is:
(0, 0)
The translated vertex is:
(−4, 0)
For example, the original point (2, 2) becomes:
(−2, 2)
The original point (−2, 2) becomes:
(−6, 2)
Every point moves left by 4 units.
Vertical Translations
A vertical translation moves a graph upward or downward.
For an original function:
y = f(x)
A vertical translation is represented by:
y = f(x) + k
where k is the vertical movement.
-
If k is positive, the graph moves upward.
-
If k is negative, the graph moves downward.
Vertical translation rules
|
Equation |
Translation |
|---|---|
|
y = f(x) + 3 |
3 units up |
|
y = f(x) + 8 |
8 units up |
|
y = f(x) − 2 |
2 units down |
|
y = f(x) − 6 |
6 units down |
Unlike horizontal translations, the sign of the constant outside the function directly matches the direction of movement.
Worked Example: Translating a Parabola Up
Original function:
y = x²
Translated function:
y = x² + 3
Every point moves 3 units upward.
|
Original point |
Translated point |
|---|---|
|
(−2, 4) |
(−2, 7) |
|
(−1, 1) |
(−1, 4) |
|
(0, 0) |
(0, 3) |
|
(1, 1) |
(1, 4) |
|
(2, 4) |
(2, 7) |
The x-coordinates remain unchanged.
The y-coordinates increase by 3.
The vertex moves from (0, 0) to (0, 3).
Worked Example: Translating a Graph Down
Original function:
y = √x
Translated function:
y = √x − 4
The graph moves 4 units downward.
The original starting point is:
(0, 0)
The translated starting point is:
(0, −4)
Other points translate as follows:
|
Original point |
Translated point |
|---|---|
|
(0, 0) |
(0, −4) |
|
(1, 1) |
(1, −3) |
|
(4, 2) |
(4, −2) |
|
(9, 3) |
(9, −1) |
The graph retains its original shape.
Combining Horizontal and Vertical Translations
A graph can be translated horizontally and vertically at the same time.
The general form is:
y = f(x − h) + k
where:
-
h represents the horizontal translation.
-
k represents the vertical translation.
For the point transformation:
(x, y) → (x + h, y + k)
Worked Example: Translating a parabola
Consider:
y = (x − 3)² + 2
Compare this with:
y = x²
The graph moves:
-
3 units right.
-
2 units up.
The original vertex is (0, 0).
The new vertex is (3, 2).
Other corresponding points include:
|
Original point |
Translated point |
|---|---|
|
(−2, 4) |
(1, 6) |
|
(−1, 1) |
(2, 3) |
|
(0, 0) |
(3, 2) |
|
(1, 1) |
(4, 3) |
|
(2, 4) |
(5, 6) |
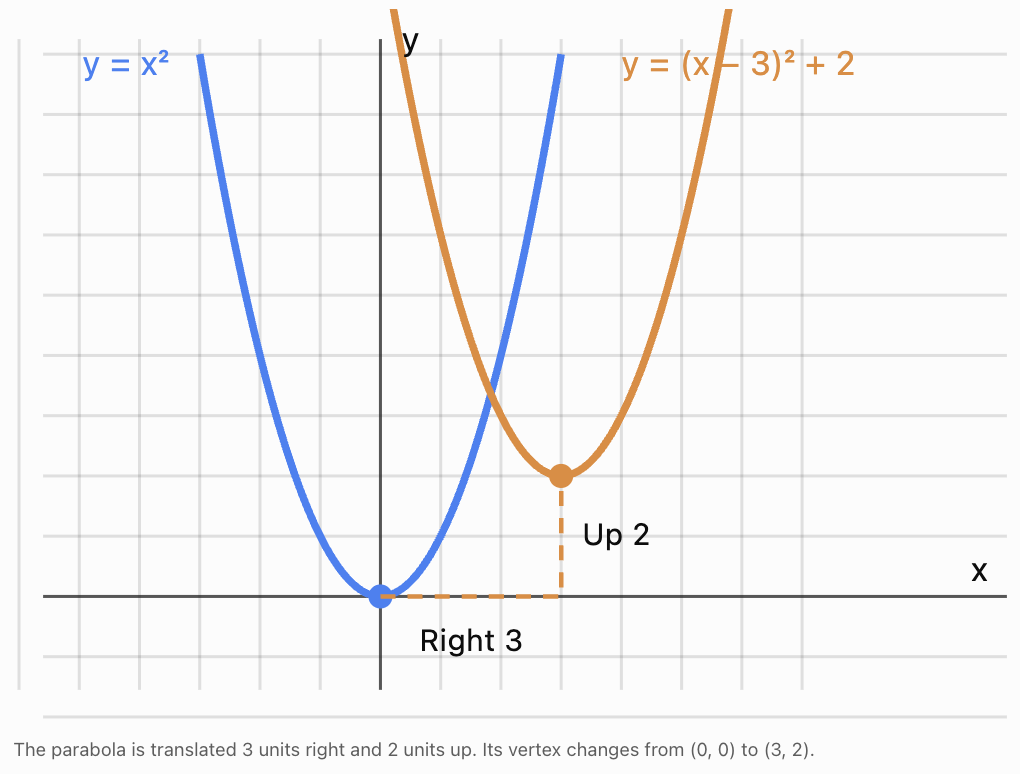
Worked Example: Left and down
Describe the transformation:
y = (x + 5)² − 4
Compared with y = x²:
-
The +5 inside the bracket means 5 units left.
-
The −4 outside the bracket means 4 units down.
The vertex is:
(−5, −4)
The shape and width of the parabola remain unchanged.
Predicting Translated Graphs
We do not always need to plot many points to predict the position of a translated graph.
Instead, we can identify important features of the original graph and move them according to the translation rule.
Important features include:
-
Vertices.
-
Turning points.
-
Endpoints.
-
Intercepts.
-
Asymptotes.
-
Points of symmetry.
-
Maximum and minimum values.
Worked Example: Translating a linear function
Original function:
y = 2x + 1
Translate the graph 3 units right and 4 units up.
Use:
g(x) = f(x − 3) + 4
Substitute:
g(x) = 2(x − 3) + 1 + 4
Expand:
g(x) = 2x − 6 + 5
g(x) = 2x − 1
The original line and translated line have the same gradient, 2.
The translated line is parallel to the original.
An important observation is that different combinations of horizontal and vertical translations can produce the same final line. For a non-horizontal straight line, the individual translations cannot always be determined uniquely from the original and final equations alone.
Worked Example: Translating an exponential function
Original function:
y = 2ˣ
Translate the graph 2 units right and 3 units down.
The translated equation is:
y = 2⁽ˣ ⁻ ²⁾ − 3
The original horizontal asymptote is:
y = 0
After translating down by 3 units, the new horizontal asymptote is:
y = −3
The original point (0, 1) becomes:
(2, −2)
The graph retains its exponential shape.
Translations of Different Function Families
The same translation rules apply to many kinds of functions.
|
Parent function |
Translated function |
Translation |
|---|---|---|
|
y = x² |
y = (x − 4)² + 1 |
Right 4, up 1 |
|
y = |x| |
y = |x + 2| − 3 |
Left 2, down 3 |
|
y = √x |
y = √(x − 5) + 2 |
Right 5, up 2 |
|
y = x³ |
y = (x + 1)³ − 4 |
Left 1, down 4 |
|
y = 2ˣ |
y = 2⁽ˣ ⁺ ³⁾ + 1 |
Left 3, up 1 |
|
y = sin x |
y = sin(x − π/2) + 2 |
Right π/2, up 2 |
The general translation rule remains:
g(x) = f(x − h) + k
The original function's shape is preserved.
Translations and the Domain and Range
Translations can change the domain and range of a function.
The domain is the set of permitted input values.
The range is the set of possible output values.
Worked Example: Square root function
Original:
y = √x
Domain:
x ≥ 0
Range:
y ≥ 0
Now translate the graph 4 units right and 2 units down:
y = √(x − 4) − 2
For the square root to be defined over the real numbers:
x − 4 ≥ 0
Therefore:
Domain: x ≥ 4
The minimum output occurs when x = 4:
y = √0 − 2 = −2
Therefore:
Range: y ≥ −2
The starting point moves from (0, 0) to (4, −2).
Worked Example: Quadratic function
Original:
y = x²
Range:
y ≥ 0
Translated:
y = (x + 3)² − 5
The vertex is (−3, −5).
Because the parabola still opens upward:
Range: y ≥ −5
The domain remains all real numbers.
General rule
If the original function has domain D and range R, a translation right by h and up by k gives:
-
New domain: every value in D increased by h.
-
New range: every value in R increased by k.
This is particularly useful when translating functions with restricted domains or ranges.
How Translations Affect Intercepts
Translations move every point of a graph, but the new x- and y-intercepts do not always come directly from translating the original intercepts.
An intercept is defined by its position on an axis.
After translation, a point that was originally on an axis may no longer be on that axis.
Worked Example
Original:
y = x²
Translated:
y = (x − 2)² − 4
The vertex is (2, −4).
To find the x-intercepts, set y = 0:
0 = (x − 2)² − 4
(x − 2)² = 4
x − 2 = ±2
Therefore:
x = 0 or x = 4
The x-intercepts are:
(0, 0) and (4, 0)
To find the y-intercept, set x = 0:
y = (0 − 2)² − 4
y = 0
The y-intercept is:
(0, 0)
This example shows that intercepts should be recalculated from the translated equation when needed.
Sketching Translated Graphs
A systematic method makes sketching translations much easier.
Step 1: Identify the parent function
For example:
y = x²
Recognise the familiar U-shaped parabola.
Step 2: Identify the translations
For:
y = (x − 2)² + 3
The graph moves 2 units right and 3 units up.
Step 3: Move the key points
The vertex moves:
(0, 0) → (2, 3)
Other points:
(−1, 1) → (1, 4)
(1, 1) → (3, 4)
(−2, 4) → (0, 7)
(2, 4) → (4, 7)
Step 4: Plot the points
Mark the new vertex and several corresponding points.
Step 5: Draw the graph
Connect the points using the same shape as the original function.
Step 6: Label important features
Include the equation, vertex, axes, and any important intercepts or asymptotes.
Describing a Translation from Two Equations
Sometimes we are given an original function and a transformed function and must describe the movement.
Worked Example
Original:
y = x²
Transformed:
y = (x + 6)² + 4
The graph moves:
6 units left and 4 units up.
Worked Example
Original:
y = |x|
Transformed:
y = |x − 3| − 7
The graph moves:
3 units right and 7 units down.
Worked Example
Original:
y = √x
Transformed:
y = √(x + 2) + 5
The graph moves:
2 units left and 5 units up.
Finding the Equation from a Translation
We can also work backwards.
Worked Example: From a description
The graph of y = x² is translated 5 units right and 2 units down.
Start with:
y = f(x)
Apply:
g(x) = f(x − 5) − 2
Therefore:
y = (x − 5)² − 2
Worked Example: From a new vertex
A parabola has the same shape and orientation as y = x², but its vertex is (−3, 4).
The equation is:
y = (x + 3)² + 4
Worked Example: Translating an absolute value graph
The graph of y = |x| is translated 4 units left and 1 unit down.
The equation is:
y = |x + 4| − 1
The vertex is (−4, −1).
Applications of Translations
Graph translations are useful because they allow mathematical models to be adjusted without rebuilding them from the beginning.
Physics: Vertical motion
Suppose the height of an object is modeled by:
h(t) = −5t² + 20t
where h is height in metres and t is time in seconds.
If the object is launched from a platform 15 m above the original reference level, its height becomes:
H(t) = −5t² + 20t + 15
The new graph is translated 15 units upward relative to the original height-time graph.
The parabolic shape remains unchanged.
This model assumes the same initial vertical velocity and gravitational acceleration, with air resistance neglected.
Business: Fixed operating costs
Suppose the variable production cost for n products is:
C = 8n
If a business also has a fixed cost of $200, the new cost function is:
C = 8n + 200
The graph moves upward by 200 units.
The gradient remains 8, meaning the cost still increases by $8 per additional product.
Biology: Shifting a growth model
Suppose an idealised growth model is:
P(t) = 100(1.1)ᵗ
If the same growth pattern begins 3 years later, its equation can be written:
P(t) = 100(1.1)⁽ᵗ ⁻ ³⁾
This represents a horizontal translation 3 years to the right.
The model has been shifted in time without changing its exponential growth pattern.
Comparing Translations with Other Transformations
Not every change to an equation represents a translation.
Consider the parent function:
y = x²
|
Equation |
Transformation |
|---|---|
|
y = x² + 4 |
Translation 4 units up |
|
y = (x − 4)² |
Translation 4 units right |
|
y = 2x² |
Vertical stretch by factor 2 |
|
y = −x² |
Reflection in the x-axis |
|
y = (2x)² |
Horizontal compression by factor 1/2 |
|
y = (x − 3)² + 2 |
Right 3 and up 2 |
A translation changes position without changing shape or orientation.
A stretch or compression changes the dimensions of the graph.
A reflection changes its orientation.
These distinctions become especially important when studying combined function transformations.
Common Mistakes
Confusing horizontal directions
For horizontal translations, the sign inside the function appears opposite to the movement.
y = f(x − 3) moves right 3 units.
y = f(x + 3) moves left 3 units.
Confusing vertical directions
Vertical translations follow the sign outside the function.
y = f(x) + 4 moves up 4 units.
y = f(x) − 4 moves down 4 units.
Changing the shape of the graph
Translations do not stretch, compress, or reflect a graph.
Moving only the vertex
Every point on the graph must move by the same amount.
Incorrectly translating coordinates
A translation right 4 and down 2 changes (x, y) to (x + 4, y − 2), not (x − 4, y + 2).
Forgetting brackets
The equations y = (x − 3)² and y = x² − 3 represent different translations.
Assuming intercepts simply remain intercepts
A translated point that was originally an intercept may no longer lie on an axis. Recalculate intercepts when necessary.
Ignoring domain and range changes
Horizontal translations may change the domain, while vertical translations may change the range.
Key Terms
-
Transformation: A change to the position, size, or orientation of a graph or shape.
-
Translation: A transformation that moves every point the same distance in the same direction.
-
Horizontal translation: A movement left or right.
-
Vertical translation: A movement up or down.
-
Parent function: A basic function used as a reference for transformations.
-
Translated function: A function obtained by shifting a parent function.
-
Coordinate rule: A rule describing how point coordinates change under a transformation.
-
Vertex: The turning point of a parabola or the corner of an absolute value graph.
-
Domain: The set of allowed input values.
-
Range: The set of possible output values.
-
Intercept: A point where a graph crosses or touches a coordinate axis.
-
Asymptote: A line that a graph approaches in a specified limiting direction.
-
Function notation: A way of expressing a function using symbols such as f(x).
-
Invariant shape: A shape that remains unchanged under a transformation.
-
Graph sketching: Representing the main features of a function on coordinate axes.
Key Takeaways
-
A translation moves every point of a graph by the same amount.
-
Translations preserve shape, size, and orientation.
-
Horizontal translations are represented by y = f(x − h).
-
Vertical translations are represented by y = f(x) + k.
-
The combined translation rule is y = f(x − h) + k.
-
Positive h moves a graph right; negative h moves it left.
-
Positive k moves a graph up; negative k moves it down.
-
A point (x, y) becomes (x + h, y + k).
-
Key points such as vertices, endpoints, and asymptotes help us sketch translated graphs.
-
The domain and range may change after a translation.
-
Intercepts should be recalculated when necessary.
-
Translation rules apply to quadratic, linear, absolute value, square root, exponential, trigonometric, and other functions.
Check Your Understanding
Recall and Understanding
1. Define a translation and explain which properties of a graph remain unchanged.
2. Describe the difference between horizontal and vertical translations.
3. Explain why y = (x − 4)² represents a translation to the right rather than to the left.
4. State the general equation for translating y = f(x) by h units horizontally and k units vertically.
Application
5. Describe the translation from y = x² to y = (x − 5)².
6. Describe the translation from y = |x| to y = |x + 3| − 4.
7. The point (2, 7) is translated 4 units left and 6 units down. Find its new coordinates.
8. Write the equation of y = x² after translating it 3 units right and 5 units up.
9. The graph of y = √x is translated 2 units left and 3 units down. Write its new equation and state its domain and range.
10. The graph of y = 2ˣ is translated 4 units right and 2 units up. Write the transformed equation and state its horizontal asymptote.
Analysis and Challenge
11. A parabola has the same shape and orientation as y = x², but its vertex is (−4, 6). Write its equation.
12. The graph of y = (x − 2)² + 3 is translated 5 units left and 4 units down. Find the resulting equation and vertex.
13. A function passes through the points (−2, 3), (0, 1), and (4, 5). Find the coordinates of these points after translating the graph 3 units right and 2 units down.
14. A quadratic function is given by y = (x − 3)² − 9. Determine its vertex, x-intercepts, and y-intercept.
15. A student claims that y = (x + 5)² − 2 is obtained from y = x² by moving 5 units right and 2 units down. Explain the error and give the correct translation.
Answers to Check Your Understanding
1. A translation moves every point of a graph by the same amount and in the same direction. Its shape, size, and orientation remain unchanged.
2. A horizontal translation moves a graph left or right and changes the input of the function. A vertical translation moves a graph up or down and changes the output.
3. The expression x − 4 equals zero when x = 4, so the vertex moves from x = 0 to x = 4. Therefore, the graph moves 4 units right.
4. The general equation is:
y = f(x − h) + k
5. The graph moves 5 units right.
6. The graph moves 3 units left and 4 units down.
7.
(2, 7) → (2 − 4, 7 − 6)
(−2, 1)
8.
y = (x − 3)² + 5
9.
New equation:
y = √(x + 2) − 3
Domain:
x ≥ −2
Range:
y ≥ −3
10.
New equation:
y = 2⁽ˣ ⁻ ⁴⁾ + 2
Horizontal asymptote:
y = 2
11.
Vertex = (−4, 6)
y = (x + 4)² + 6
12.
Original vertex:
(2, 3)
Translate left 5:
x = 2 − 5 = −3
Translate down 4:
y = 3 − 4 = −1
New vertex:
(−3, −1)
New equation:
y = (x + 3)² − 1
13.
Apply:
(x, y) → (x + 3, y − 2)
(−2, 3) → (1, 1)
(0, 1) → (3, −1)
(4, 5) → (7, 3)
14.
Given:
y = (x − 3)² − 9
Vertex:
(3, −9)
For x-intercepts, set y = 0:
(x − 3)² − 9 = 0
(x − 3)² = 9
x − 3 = ±3
x = 0 or x = 6
x-intercepts:
(0, 0) and (6, 0)
For the y-intercept, set x = 0:
y = (0 − 3)² − 9 = 0
y-intercept:
(0, 0)
15.
The student has confused the direction of the horizontal translation.
The expression x + 5 means the graph moves 5 units left, not right.
The −2 outside the squared expression means the graph moves 2 units down.
Correct translation: 5 units left and 2 units down.
The new vertex is (−5, −2).
Final Summary
Translations allow us to move graphs horizontally and vertically while preserving their shape and orientation.
By understanding how changes inside and outside a function affect its graph, we can predict transformations, sketch graphs accurately, and connect algebraic equations with geometric movements.
The most important relationship is:
y = f(x − h) + k
This represents a translation of h units horizontally and k units vertically.
Mastering translations provides an essential foundation for studying more advanced function transformations, graph analysis, and mathematical modeling.