4. Comparing Function Types

Learning outcomes
  • I can distinguish between linear, quadratic, and exponential functions.
  • I can compare their graphs.
  • I can compare rates of change.
  • I can identify each function from data.
  • I can determine which model best fits a situation.

Comparing Function Types

Functions describe relationships between quantities. Three of the most important types of functions are linear, quadratic, and exponential functions.

Although all three can be represented using equations, tables, and graphs, they behave very differently.

Learning to recognize these differences allows us to choose an appropriate mathematical model for a real-world situation.

Linear Functions

A linear function has a constant rate of change.

A common form is:

y = mx + b

where:

  • m = slope or rate of change
  • b = y-intercept

For example:

y = 2x + 1

Every time x increases by 1, y increases by 2.

x y
0 1
1 3
2 5
3 7
4 9

The first differences are:

+2, +2, +2, +2

Because the first differences are constant, the relationship is linear.

Graph Shape

The graph of a linear function is a straight line.

A positive slope produces an increasing line, while a negative slope produces a decreasing line.

https://images.openai.com/static-rsc-4/LdbOEb7KSzTc_IAyzGYxQ-cWInDDagzD97dpoXJrsNn34Afx67jNE5cjxRQBcZaTUcJ92ydYoPlhylRReUOSUO816dYoMsUETdcHkPFavUAfY7_Yw4CV_gtfMTBGTOS7t3lMF8ZzmC_w9A2cSyPvQUdSqrwgTcS3CZ-pagGnc_ZGqc35L6T5Gp1lzsYhHZwg?purpose=fullsize
 
https://images.openai.com/static-rsc-4/FOFhuN38DX2a5tmz2R0bMXDjdOJf616fRq-RhF5BNUaSnLTR-vRMLodghyRPGpENt3RwtDKAIkAIW1DcSrpbrhmZnCIU1Ubl1lr8jm4jLzLK9NQNixwEbyWlemC_vAIwtPDAdSmXXDvE_oc3guZk_d57U-CP0hC-RjtRMLp0v3YAm2I22vDkWd8Z7GdCCJPD?purpose=fullsize
 
https://images.openai.com/static-rsc-4/vAbMngzqcQ2P4zjIgimubWGuMSIUFwvkSzNXOi2zjTSJlNGmlyOXljKJj23HDv9orbgHFXlrKa67BdrDo0qevnupWZy_aLpnQT4q6mPpBKZ2UlizQf0Amksqit9f_IY-ievqsl-NdIdd0s4PsmMPdXEKHM2rl5HtMtZ9BeqNRWNY6BTbANu0ibEPEqKddHpj?purpose=fullsize
 
5

Linear relationships appear when something changes by the same amount during each equal interval.

Examples include:

  • Earning the same amount of money each hour
  • Travelling at constant speed
  • Filling a container at a constant rate
  • Paying a fixed price per item

Quadratic Functions

A quadratic function contains a squared variable.

A common form is:

y = ax² + bx + c

where a ≠ 0.

For example:

y = x²

x y
0 0
1 1
2 4
3 9
4 16

The first differences are:

+1, +3, +5, +7

These are not constant.

However, the second differences are:

+2, +2, +2

Constant second differences are an important clue that a table represents a quadratic function when the x-values increase by equal amounts.

Graph Shape

The graph of a quadratic function is called a parabola.

https://images.openai.com/static-rsc-4/R9ntwBWx7uF9rS2XFTX7Q1ikE4qCoSFV-8H8LT_N8dOQWZOJYESEy7Cl_94vDMu1fPdFIx0yXLaktDpS9ZaRC-UgNf1K9sLP4ilHyP_aHabxcx0397EpY7uFrwewFs0FW_bxQMLxfqupAag61PXw49kdYqo3q_urgs533VJWD5rjY5n_PXXxywVDJ4Zc2xnq?purpose=fullsize
 
https://images.openai.com/static-rsc-4/rPRYavaccVqT2G63-bE0eIOQGUsnQ129JrslRiDpRWlZf5_hhLDivpLyavsSDNmizd0MK0Ccldr5PdheWUgLvzdHrKwv9Hl8IxkcyXCOCg14mV70FfDBj0hd4J169RXRtOOZrqxBBBuyjaWhaoP1XEdp-XUedGmuJuVPeHxkCQ64f1q0kuKpEAye7o4VaRkT?purpose=fullsize
 
https://images.openai.com/static-rsc-4/_UwQEvH36zq1bfKOJ3J0XotFrIhFwZWX2dVbRBYKLRFzT2dn-cbcDnOLqhAv2rhbBwnfrXQ0HToeaUKjdJyod0yxafOL0NaUEgwYd_bctXTyH2kKCoyqorQYcncyy964Elbp0NEHO4saG5urYrMBPYkQFEWNSveeIoZQl2gSOvimDksIQTq929H0R1vNflPI?purpose=fullsize
 
8

A parabola can open upward or downward.

If a > 0, it opens upward.

If a < 0, it opens downward.

The turning point of a parabola is called its vertex.

Quadratic relationships appear in situations involving:

  • Projectile motion
  • Falling objects
  • Areas of geometric shapes
  • Optimization problems
  • Some profit and revenue models

Exponential Functions

An exponential function changes by a constant multiplying factor rather than a constant amount.

A common form is:

y = abˣ

where:

  • a = initial value
  • b = growth or decay factor

For example:

y = 2ˣ

x y
0 1
1 2
2 4
3 8
4 16

Each output is multiplied by 2:

1 → 2 → 4 → 8 → 16

The ratio between consecutive outputs is constant:

2/1 = 2

4/2 = 2

8/4 = 2

16/8 = 2

This constant ratio is a major clue that a relationship is exponential.

Graph Shape

An exponential growth graph begins relatively slowly and then becomes increasingly steep.

https://images.openai.com/static-rsc-4/8phPuJMmQsCqr3PyWmyRcsR8m7KnUuWwOuNffHKzoZQmn8TPUf2vQLdH2VPm0nv1KABmre28rmlTbitAGL2mdeSlWLdOlHizz1JKFGxWCxg4EQRpoTCR9mvFl_jAi1UQWZpjyry4h51xuFqi10VM9z3fXdFJq-DyA1hWhP8JmBWgGFfhSmLI6ZyFsNDgk03j?purpose=fullsize
 
https://images.openai.com/static-rsc-4/DfYkdNTuFDW0GVSd4fXaWqrU6IPXrMYkmF_cTXBVK8f0SOIR2ELLwOrCXr-Wb10J9N7PCsm5w5jR0fR3NgmQOmnIFQowBAlLvgZdoUfQx2704h9MVv07GhJkV1tBbwIAL36MgZGEkoTj_oZCCTs3bbgelmcIZY7TEcy1aQDGuaUjvLL-Skf3lspZpkkoMBos?purpose=fullsize
 
https://images.openai.com/static-rsc-4/3QS_1sAptf3d1ye9INlT-tvf8F6_sLnLEjJSiIv14nGgBctWXhUdEkL5BMCnLRmIfnG9czYhVhd8Eqfru01Tux1r6NDsI6NMnT8dyOkusjZWbQX6Qh_tecH8hoXWIBOAAQ9O-7b5g4T0e_CGyGl5OSP1H53AdzKM1o_5eeX8W2Nxhs-V6uNJdmSFM1R3HMXB?purpose=fullsize
 
5

If:

b > 1

the function represents exponential growth.

If:

0 < b < 1

the function represents exponential decay.

Exponential relationships appear in situations involving:

  • Population growth
  • Compound interest
  • Bacterial growth
  • Radioactive decay
  • Depreciation
  • Spread of information under simplified conditions

Comparing the Graphs

The shapes of the graphs provide one of the easiest ways to distinguish the three function types.
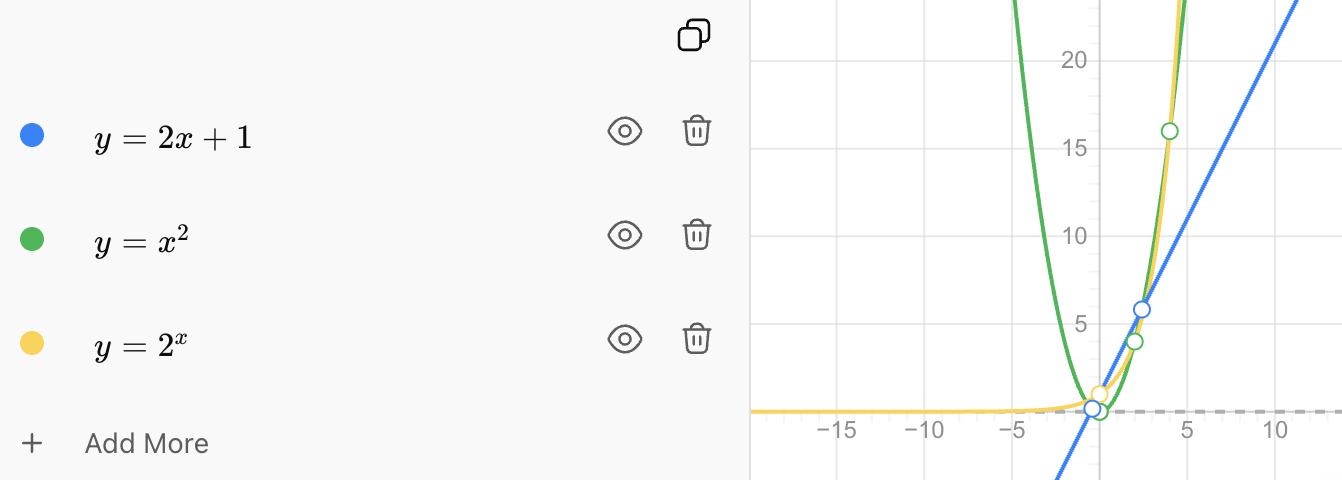
The three graphs have very different characteristics.

Function Type Typical Graph
Linear Straight line
Quadratic Parabola
Exponential Increasing or decreasing curve

Linear

A linear graph changes at a constant rate.

Its steepness remains constant.

Quadratic

A quadratic graph curves and has a turning point called the vertex.

Its rate of change changes steadily.

Exponential

An exponential graph becomes increasingly steep during growth or increasingly flat during decay.

Its rate of change depends on its current value.


Comparing Rates of Change

One of the most important differences between these functions is how their outputs change.

Linear: Constant Difference

Consider:

2, 5, 8, 11, 14

The differences are:

+3, +3, +3, +3

The output increases by the same amount each time.

This indicates a linear relationship.


Quadratic: Constant Second Difference

Consider:

1, 4, 9, 16, 25

First differences:

+3, +5, +7, +9

The first differences are not constant.

Now calculate the second differences:

+2, +2, +2

The second differences are constant.

This indicates a quadratic relationship.


Exponential: Constant Ratio

Consider:

3, 6, 12, 24, 48

Calculate the ratios:

6 ÷ 3 = 2

12 ÷ 6 = 2

24 ÷ 12 = 2

48 ÷ 24 = 2

Each output is multiplied by 2.

This indicates an exponential relationship.


A Useful Recognition Strategy

When x-values increase by equal amounts, look for these patterns:

Pattern in y-values Likely Function
Constant first difference Linear
Constant second difference Quadratic
Constant ratio Exponential

This provides a powerful way to identify functions from tables.

A useful memory aid is:

Linear → add

Quadratic → second differences

Exponential → multiply


Identifying Functions from Data

Suppose we have the following data.

Table A

x y
0 5
1 8
2 11
3 14
4 17

Differences:

+3, +3, +3, +3

Therefore:

Linear


Table B

x y
0 1
1 4
2 9
3 16
4 25

First differences:

+3, +5, +7, +9

Second differences:

+2, +2, +2

Therefore:

Quadratic


Table C

x y
0 5
1 10
2 20
3 40
4 80

Ratios:

10 ÷ 5 = 2

20 ÷ 10 = 2

40 ÷ 20 = 2

80 ÷ 40 = 2

Therefore:

Exponential


Comparing Linear and Exponential Growth

Linear and exponential growth can look surprisingly similar at first.

Suppose two savings accounts begin with $100.

Account A

The balance increases by $100 each year.

100 → 200 → 300 → 400 → 500

This is linear growth because we repeatedly add the same amount.

Account B

The balance doubles each year.

100 → 200 → 400 → 800 → 1600

This is exponential growth because we repeatedly multiply by the same factor.

https://images.openai.com/static-rsc-4/_eCGb1vwymrpKbSzaCCwPPZo1pmkgfaOjYzM3K9pt7gK-uxHg1Wgg3UGBm2gsjF2ac3TQb8WgO-eoYymec479BpTghWOU0FR880CI0VPrdUGPk5_MBvo1MUbIUl10-epIbiql4RaZneae3u6z7PczvbnPLDqC7sy1e6om5TqRWKWZePYk9VPIBTsSPb5UzwG?purpose=fullsize
 
https://images.openai.com/static-rsc-4/usad07JZNUiOs8knecGmjBHGzlTsR_RoBWpgdzkx31-Zr96NiF3155W8BlE1oej-uBMfiWxZRx8RA_wBiNodL8Xli32Wea0J551myyxfEYknRMBLVy2Hg6aOM-FKXNvaQYhFqg4ZYGNpqAme_SELyFjE0P2kuPZPhgDPnFeAg-kUq6Zi-irMNH1IPKrtY0jK?purpose=fullsize
 
https://images.openai.com/static-rsc-4/M018wc5ZIGV_gbwLPSwfPx9uk3Y1DmXwIaymE-jR8u7sXJT_eIhPV3nqKB4sGtk5xPPzdDBJyf76QiwFNl-_NcKLax0ko7-Jfl0fll-dyMRBrq8IuaVG0oEbzBVF9WFqACz3lAzYo5L_k93gAq35VRfh-h1sElD_Jt8wlYQFUZjyPx21yypkPIn5VA63ktXz?purpose=fullsize
 
5

At first, the values may be similar.

Over longer periods, however, exponential growth can become much larger because the amount being added grows along with the quantity itself.


Comparing Quadratic and Exponential Growth

Quadratic and exponential graphs can both curve upward and become increasingly steep.

This means that graph shape alone can sometimes be misleading.

Consider:

Quadratic:

y = x²

Exponential:

y = 2ˣ

For some x-values, the quadratic function may actually be larger.

But exponential growth eventually overtakes polynomial growth such as quadratic growth and then increases much more rapidly.
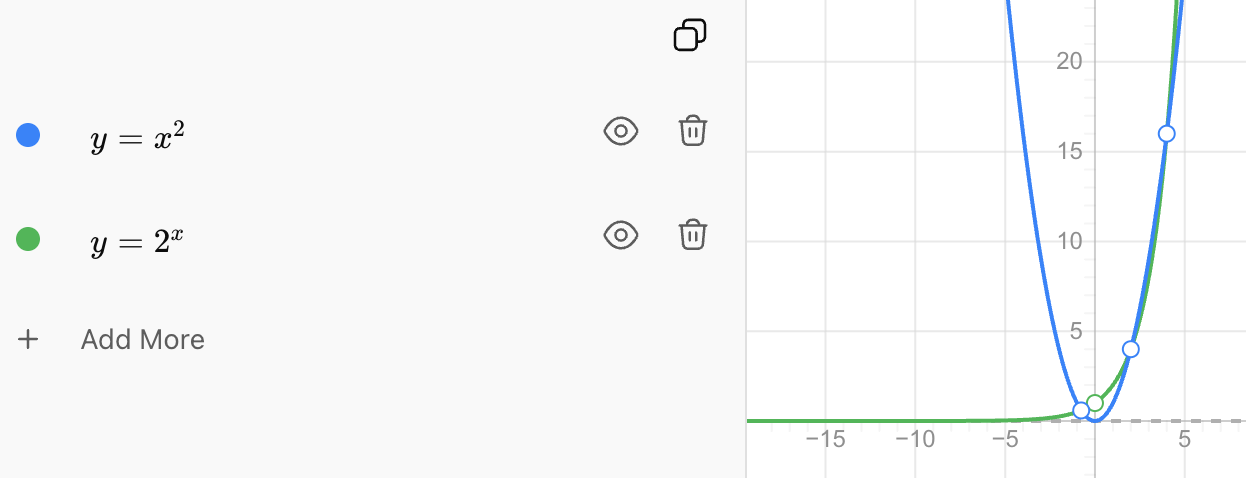
This is why examining rates of change and data patterns is important instead of relying only on the general appearance of a graph.


Choosing the Best Model

Real-world data rarely announces which mathematical function should be used.

We need to examine how the quantity changes.

Ask:

Does it change by approximately the same amount?

A linear model may be appropriate.

Does the rate of change itself change steadily, producing approximately constant second differences?

A quadratic model may be appropriate.

Does it change by approximately the same percentage or multiplying factor?

An exponential model may be appropriate.


Real-World Example: Taxi Fare

Suppose a taxi charges:

$4 starting fee

plus

$2 per kilometre.

The cost increases by the same amount for every kilometre travelled.

A suitable model is:

C = 2d + 4

This is a linear function.


Real-World Example: Projectile Motion

Imagine throwing a ball upward.

Its height may increase, reach a maximum, and then decrease.

https://images.openai.com/static-rsc-4/JetitxXX0JnU1VL5eM4U_Z--JsT1SBwdxMHK6Kfysp3RxgabnAb3tQ4XTksao5M99QjvDtX4REXUlMrzLHcjzoqGDgY884rWQjI9G-r80clIKQWWqtCsrwczMH16o3UwGxfOt34sIfsYGO3E-nx70lEPPPt2Rsin2JErTmWKlzcuwkqdrxJqRwoP9uA33FEu?purpose=fullsize
 
https://images.openai.com/static-rsc-4/UYXgraWgP8KE6yruKxexIb6O4c9vQmXxEMIQZ_gu7om3QyPnfchtI4VgIcOONZACqEH4yxW0sv9811F06-45YC_oDKPLOGCY9gUy9K8Pmqoz4BUJzBF7NTBMUvCdBzchK1dEToD6i_iNHQj-QEeFMbRyTBxjHuAbFfAS_jFCnewHhADJc-TlC7L6oIpk0qH6?purpose=fullsize
 
https://images.openai.com/static-rsc-4/JFzw2WkT3wxn8jNNZueFEousSp6xLJI4hg7DyRULjsN86Pyo5T_iIEo88ECF2__EE7oK3pp4uMamo6vq4EaKrMINYyUMvtQLnC7h5u92dhNqabQArDCkTrFb-TI_8qdOs1Kq2M7dMX61dKKf74K_5urBKKuJcz8n1VkLLSYn9MiQmd9HzvKGBgiHUGzar-QV?purpose=fullsize
 
7

Ignoring air resistance and using an appropriate coordinate system, the height can often be modeled using a quadratic function such as:

h = −4.9t² + vt + h₀

The graph is a downward-opening parabola.

Therefore, a quadratic model is appropriate.


Real-World Example: Population Growth

Suppose a bacterial population doubles every hour.

100 → 200 → 400 → 800 → 1600

The population does not increase by a constant amount.

Instead, it increases by a constant factor.

A possible model is:

P = 100(2ᵗ)

This is an exponential model.

https://images.openai.com/static-rsc-4/vR58ODFXwZ_tqhUHcmXnX-TGt8PXqrUrp3erS1_4o5jKivtM0zGgb_1h2lNnS214JEieVqFhR2OEUyMyrJrss3GuAKVBHi7n-ngLOBRX4V2oa9CPab1r3e8MkYJZ8I_iyWezzQ-SS0UEEtspcw-AoM_WG_Z7YjvvpCfNxct5ZDyP1AGhmBkNbWxDOwyFvECl?purpose=fullsize
 
https://images.openai.com/static-rsc-4/-beXBjV5OohNqIUhKVgUG9nql1tRjN1FziM1Z5rUA6horO6dU6hzHqn0hh92POcH_6959ffycbW-Icdv3J-QpoJ0HTcuUvgcCrvahmHgVZEJkDNmJUYUtQTqrJueN_GdJ7Fw9Tx8BO0n3Wxe6-uKOqU57bLNATQDNjoT7eTtk9a9pANWs5Ulimlf5adkf_zs?purpose=fullsize
 
https://images.openai.com/static-rsc-4/WNSVVQxWXkgKi0HC18O3GBKW6Ww_Frk5l7XMXNak0uy6hodMNYf1YI_vyhcp6RoSkipAQihT6f7UVzAUewytUm0vIxsIgPgRKsHtr_fOjUcPCSsAT1IE1-msa_MT0NUd-tFISnBKrRYtLWG8Zb7Rc3xQ8Wpdcxu2xVgCqkOCD5AI7zsSsCne4bwbrkVUVA7k?purpose=fullsize
 
5

Real-World Example: Depreciation

Suppose a machine loses 15% of its value each year.

Its value is repeatedly multiplied by:

1 − 0.15 = 0.85

If its initial value is $20,000:

V = 20000(0.85)ᵗ

Because the value changes by a constant percentage rather than a constant amount, the relationship is exponential decay.


Comparing the Three Function Types

Feature Linear Quadratic Exponential
Typical equation y = mx + b y = ax² + bx + c y = abˣ
Graph Straight line Parabola Growth/decay curve
First differences Constant Usually not constant Usually not constant
Second differences Usually not constant Constant Usually not constant
Consecutive ratio Usually not constant Usually not constant Constant
Rate of change Constant Changes steadily Changes proportionally
Common model Constant rate Accelerating/curved relationship Percentage growth/decay

How to Identify a Function

When given a graph, table, equation, or real-world situation, use several clues rather than relying on only one.

Look at the equation

x → likely linear

x² → likely quadratic

variable in the exponent → likely exponential

Examples:

y = 4x + 7 → linear

y = 3x² − 2x + 1 → quadratic

y = 5(1.2)ˣ → exponential

Look at the graph

Straight line → linear

Parabola → quadratic

Growth or decay curve → possibly exponential

Look at a table

Constant first difference → linear

Constant second difference → quadratic

Constant ratio → exponential

Look at the situation

Constant amount of change → linear

Parabolic or steadily changing rate → quadratic

Constant percentage or multiplying factor → exponential

Using several clues makes your classification more reliable.


Common Mistakes

Thinking every curved graph is quadratic

Exponential graphs are also curved. Look at the shape, equation, and rate of change.

Thinking exponential means simply "very fast"

Exponential describes a particular mathematical pattern involving repeated multiplication. Some exponential functions initially change quite slowly.

Confusing constant difference with constant ratio

Adding 5 repeatedly suggests linear growth.

Multiplying by 5 repeatedly suggests exponential growth.

Checking second differences before checking first differences

A linear sequence also has constant second differences—specifically, zero. Check first differences first. If they are constant, classify the relationship as linear.

Using differences when x-values are not equally spaced

The simple first- and second-difference tests assume equally spaced x-values.

Assuming a real-world model is perfect

Mathematical functions are models. Real populations, prices, profits, and physical systems may only approximately follow a particular function over a limited range.


Key Terms

Linear Function: A function with a constant rate of change and a straight-line graph.

Quadratic Function: A function whose highest variable power is 2 and whose graph is a parabola.

Exponential Function: A function in which the variable appears in the exponent and equal input changes produce a constant multiplying factor.

Rate of Change: The amount an output changes compared with a change in input.

First Difference: The difference between consecutive output values in a table with equally spaced inputs.

Second Difference: The difference between consecutive first differences.

Constant Ratio: A pattern in which consecutive outputs are multiplied by the same factor.

Slope: The constant rate of change of a linear function.

Parabola: The characteristic U-shaped or inverted U-shaped graph of a quadratic function.

Vertex: The turning point of a parabola.

Exponential Growth: A pattern in which a quantity increases repeatedly by the same factor or percentage over equal intervals.

Exponential Decay: A pattern in which a quantity decreases repeatedly by the same factor or percentage over equal intervals.

Mathematical Model: A mathematical representation used to describe or predict a real-world relationship.


Check Your Understanding

1. Which type of function has a constant rate of change?

2. Which type of function produces a parabola?

3. Which type of function usually has a constant ratio between consecutive outputs when inputs increase equally?

4. Identify the function type:

4, 7, 10, 13, 16

5. Identify the function type:

1, 4, 9, 16, 25

6. Identify the function type:

3, 9, 27, 81, 243

7. A worker earns $18 for every hour worked. Which function type would best model total earnings versus hours?

8. A ball is thrown upward and then falls back toward the ground. Which function type could model its height versus time?

9. An investment grows by 6% each year. Which function type would best model its value?

10. Explain the difference between a constant difference and a constant ratio.

11. Why can looking only at the shape of a graph sometimes make it difficult to distinguish quadratic and exponential functions?

12. Describe one real-world example each of a linear, quadratic, and exponential relationship.


Key Takeaways

  • Linear, quadratic, and exponential functions have different equations, graphs, and rates of change.
  • Linear functions have a constant first difference when inputs are equally spaced.
  • Linear functions produce straight-line graphs.
  • Quadratic functions have constant second differences when inputs are equally spaced.
  • Quadratic functions produce parabolic graphs.
  • Exponential functions have a constant ratio for equal input intervals.
  • Exponential relationships involve repeated multiplication rather than repeated addition.
  • Constant amounts of change often suggest a linear model.
  • Constant percentages or multiplying factors often suggest an exponential model.
  • Situations involving parabolic motion or steadily changing rates may be modeled with quadratic functions.
  • Tables, graphs, equations, and the context of a situation should all be considered when selecting a model.
  • Choosing the best function type helps us describe patterns, make predictions, and model real-world relationships.