Linear Functions
2. Slope
Learning outcomes
- I can define slope.
- I can calculate slope from two points.
- I can determine slope from a graph.
- I can distinguish between positive, negative, zero, and undefined slopes.
- I can explain the meaning of slope in real-life situations.
Slope
Slope describes the steepness and direction of a line.
It tells us how much the vertical value changes compared with the horizontal value.
In everyday language, slope can describe how steep something is. A steep hill has a greater slope than a gentle hill. In mathematics, the idea is more precise: slope measures the rate of change between two variables.
For a straight line, the slope remains constant along the entire line.


Understanding Slope
Imagine walking along a road.
If the road rises as you move forward, it has a positive slope.
If the road falls as you move forward, it has a negative slope.
If the road stays level, it has a zero slope.
A perfectly vertical cliff would represent an undefined slope.
Mathematically, we always read a graph from left to right when describing the direction of its slope.
Rise and Run
Slope compares two changes:
- rise — the vertical change
- run — the horizontal change
Therefore:
slope = rise/run
or:
slope = change in y / change in x
Using the symbol Δ to mean "change in":
m = Δy/Δx
The letter m is commonly used to represent slope.
For example, if a line rises 6 units while moving 2 units to the right:
m = 6/2
= 3
The slope is 3.
This means:
y increases by 3 units for every increase of 1 unit in x.


Slope from Two Points
If we know two points on a line, we can calculate its slope.
Suppose the points are:
(x₁, y₁)
and:
(x₂, y₂)
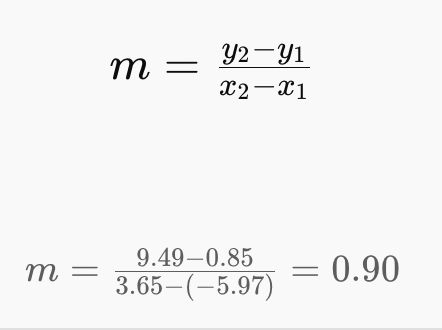
The slope formula is:
m = (y₂ − y₁)/(x₂ − x₁)
The numerator represents the change in y.
The denominator represents the change in x.
So the formula is simply another way of writing:
slope = vertical change / horizontal change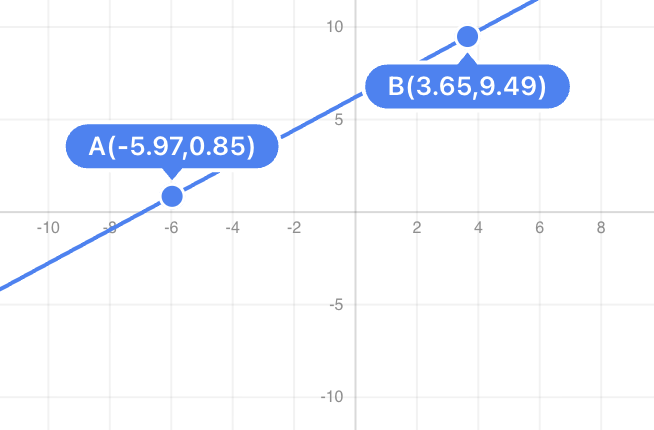
Worked Example: Slope from Two Points
Find the slope between:
(2, 3)
and:
(6, 11)
Use:
m = (y₂ − y₁)/(x₂ − x₁)
Substitute:
m = (11 − 3)/(6 − 2)
= 8/4
= 2
Therefore:
slope = 2
Interpretation:
For every increase of 1 in x, y increases by 2.
Another Worked Example
Find the slope between:
(3, 5)
and:
(7, 9)
m = (9 − 5)/(7 − 3)
= 4/4
= 1
Therefore:
m = 1
The line rises one unit for every one unit it moves to the right.
The Order of Subtraction Matters
Suppose the points are:
(2, 4) and (5, 10)
We could calculate:
m = (10 − 4)/(5 − 2)
= 6/3
= 2
We can also reverse the points:
m = (4 − 10)/(2 − 5)
= −6/−3
= 2
Both methods work.
The important rule is:
Use the same point first in both the numerator and denominator.
Do not write:
(10 − 4)/(2 − 5)
because you have changed the order in only one part of the calculation.
Determining Slope from a Graph
To determine slope from a graph:
- Choose two clear points on the line.
- Determine the vertical change between them.
- Determine the horizontal change between them.
- Calculate rise/run.
It is usually best to choose points where the line passes exactly through grid intersections.
For example, suppose a line passes through:
(1, 2) and (4, 8)
Rise:
8 − 2 = 6
Run:
4 − 1 = 3
Therefore:
m = 6/3
= 2


The Four Types of Slope
There are four important possibilities:
- positive slope
- negative slope
- zero slope
- undefined slope
Being able to recognize these quickly from a graph is essential.
Positive Slope
A line has a positive slope when it rises from left to right.
For example:
m = 3
means that for every increase of 1 in x:
y increases by 3.
Another example:
m = 1/2
means that for every increase of 2 in x:
y increases by 1.
Both slopes are positive.
A positive slope represents an increasing relationship.


Positive Fractional Slopes
A slope does not have to be a whole number.
Consider:
m = 2/5
This means:
rise = 2
run = 5
So for every 5 units moved to the right, the line rises 2 units.
The line still rises from left to right, but less steeply than a line with slope 1 or 2.
Negative Slope
A line has a negative slope when it falls from left to right.
For example:
m = −3
means that for every increase of 1 in x:
y decreases by 3.
We could think of this as:
rise = −3
run = 1
Therefore:
m = −3/1
= −3
A negative slope represents a decreasing relationship.


Worked Example: Negative Slope
Find the slope between:
(2, 10)
and:
(6, 2)
m = (2 − 10)/(6 − 2)
= −8/4
= −2
Therefore:
m = −2
Interpretation:
For every increase of 1 in x, y decreases by 2.
Zero Slope
A horizontal line has a slope of zero.
Suppose two points are:
(2, 5)
and:
(8, 5)
Calculate:
m = (5 − 5)/(8 − 2)
= 0/6
= 0
The y-value does not change.
Therefore:
horizontal line → zero slope
A horizontal line can be written in the form:
y = constant
For example:
y = 5
has a slope of zero.
Why Is a Horizontal Slope Zero?
Think about:
rise/run
For a horizontal line:
rise = 0
The run is nonzero.
Therefore:
0/run = 0
The line has no vertical change, so its slope is zero.
Undefined Slope
A vertical line has an undefined slope.
Suppose two points are:
(4, 2)
and:
(4, 8)
Calculate:
m = (8 − 2)/(4 − 4)
= 6/0
Division by zero is undefined.
Therefore:
vertical line → undefined slope
A vertical line can be written as:
x = constant
For example:
x = 4
has an undefined slope.


Zero Slope vs Undefined Slope
These two are commonly confused.
Horizontal Line
rise = 0
run ≠ 0
Therefore:
m = 0
Vertical Line
rise ≠ 0
run = 0
Therefore:
m = undefined
A useful memory aid is:
Horizontal → zero
Vertical → undefined
Comparing Slopes
Slope tells us both:
- direction
- steepness
Consider:
m = 1
and:
m = 4
Both slopes are positive.
But the line with:
m = 4
rises more quickly and is therefore steeper.
Now consider:
m = −2
and:
m = −6
Both slopes are negative.
The line with slope −6 falls more steeply.
The absolute value of the slope helps describe steepness.
| Slope | Absolute Value | General Behaviour |
|---|---|---|
| 1 | 1 | rises |
| 4 | 4 | rises more steeply |
| −2 | 2 | falls |
| −6 | 6 | falls more steeply |
Slope and Rate of Change
Slope is not just a feature of a graph.
It represents a rate of change.
Suppose a distance-time graph has:
m = 20 km/h
This means:
distance increases by 20 kilometres for every hour that passes.
Suppose a temperature-time graph has:
m = −3°C/h
This means:
temperature decreases by 3°C every hour.
The meaning of slope depends on the quantities shown on the axes.
Units of Slope
The units of slope come from:
vertical-axis units / horizontal-axis units
Suppose:
y-axis = distance in kilometres
x-axis = time in hours
Then:
slope units = km/h
If:
y-axis = temperature in °C
x-axis = time in minutes
then:
slope units = °C/min
If:
y-axis = cost in dollars
x-axis = number of tickets
then:
slope units = $/ticket
Always include units when interpreting a real-world slope.
Slope in Distance-Time Graphs
Consider a person walking at a constant speed.
| Time |
Distance (km) |
|---|---|
| 0 | 0 |
| 1 | 5 |
| 2 | 10 |
| 3 | 15 |
| 4 | 20 |
Calculate the slope:
m = (20 − 0)/(4 − 0)
= 20/4
= 5 km/h
The slope represents the person's speed.
A steeper distance-time graph represents a greater speed.


Slope in a Temperature Graph
Suppose a drink cools from:
90°C at 0 minutes
to:
60°C at 10 minutes.
Slope:
m = (60 − 90)/(10 − 0)
= −30/10
= −3°C/min
Interpretation:
The temperature decreases by an average of 3°C each minute over this interval.
The negative slope tells us the quantity is decreasing.
Slope in a Cost Graph
Suppose a rental company charges according to:
| Hours | Cost ($) |
|---|---|
| 1 | 25 |
| 2 | 40 |
| 3 | 55 |
| 4 | 70 |
Calculate:
m = (40 − 25)/(2 − 1)
= 15/1
= $15/h
The slope means:
The cost increases by $15 for each additional hour.
Notice that the slope does not necessarily tell us the starting cost.
Slope and Linear Equations
A linear equation is often written:
y = mx + b
where:
- m = slope
- b = y-intercept
For example:
y = 3x + 5
The slope is:
m = 3
The y-intercept is:
b = 5
These have different meanings.
The slope describes the rate of change.
The y-intercept describes the value of y when:
x = 0
Example: Interpreting y = mx + b
Suppose:
C = 4d + 10
where:
C = delivery cost in dollars
d = distance in kilometres
The slope is:
4
Its units are:
$/km
Therefore:
The delivery cost increases by $4 for every additional kilometre.
The 10 represents the starting cost:
$10
Slope and starting value should not be confused.
Finding Slope from an Equation
When an equation is already written as:
y = mx + b
the slope can be read directly from the coefficient of x.
Example:
y = 7x − 4
Slope:
m = 7
Example:
y = −2x + 8
Slope:
m = −2
Example:
y = (1/3)x + 5
Slope:
m = 1/3
When the Equation Is Not in y = mx + b Form
Sometimes we must rearrange the equation.
Consider:
2x + y = 8
Solve for y:
y = −2x + 8
Therefore:
m = −2
Another example:
3x + 2y = 10
Subtract 3x:
2y = −3x + 10
Divide by 2:
y = −(3/2)x + 5
Therefore:
m = −3/2
Slope from a Table
We can also calculate slope from a table.
Consider:
| x | y |
|---|---|
| 1 | 5 |
| 3 | 11 |
| 5 | 17 |
| 7 | 23 |
Use any two points.
For example:
(1, 5)
and:
(3, 11)
m = (11 − 5)/(3 − 1)
= 6/2
= 3
Check another interval:
m = (17 − 11)/(5 − 3)
= 6/2
= 3
The slope is constant.
Therefore, the table represents a linear relationship.
Tables with Unequal Intervals
Consider:
| x | y |
|---|---|
| 1 | 6 |
| 3 | 12 |
| 7 | 24 |
| 10 | 33 |
The changes in y are not the same:
+6
+12
+9
But the x-intervals are also different.
Calculate the slopes.
First interval:
(12 − 6)/(3 − 1)
= 6/2
= 3
Second:
(24 − 12)/(7 − 3)
= 12/4
= 3
Third:
(33 − 24)/(10 − 7)
= 9/3
= 3
The slope is still constant.
Therefore, the relationship is linear.
Slope and Straight Lines
Every non-vertical straight line has a constant slope.
This means we can choose any two different points on the line and obtain the same slope.
For example, if one pair gives:
m = 2
then every other pair of points on that same straight line will also give:
m = 2
This is one of the defining features of a linear relationship.
Curved Graphs
A curved graph does not generally have one constant slope.
Its steepness changes.
For example, a moving car may accelerate.
Its position-time graph may become increasingly steep.
We can still calculate the average slope between two points:
average rate of change = Δy/Δx
But the slope at one exact point requires a more advanced idea.
This leads directly to calculus.


Slope and Calculus
For a straight line, finding slope is easy because the slope is constant.
But suppose the graph is curved.
Its slope may be:
small at one point,
larger at another,
zero at another,
and negative somewhere else.
Calculus allows us to determine the slope at one exact point on a curve.
That slope is called the instantaneous rate of change.
The mathematical tool used to find it is the derivative.
So slope provides an important bridge from algebra into calculus.
Real-World Slope: Roads
Road slopes are often described using a grade or percentage.
Suppose a road rises:
8 m
for every:
100 m horizontally.
Its slope is:
8/100
= 0.08
As a percentage:
0.08 × 100%
= 8%
So the road has an:
8% grade
The sign of the slope depends on the direction of travel.
Real-World Slope: Ramps
Ramps are designed with slope in mind.
A ramp that rises too quickly over a short horizontal distance is steep.
A ramp with the same rise spread over a longer horizontal distance is gentler.
For example:
Ramp A:
rise = 1 m
run = 5 m
m = 1/5
= 0.20
Ramp B:
rise = 1 m
run = 10 m
m = 1/10
= 0.10
Ramp A is steeper because:
0.20 > 0.10


Real-World Slope: Roofs
Roof designers also consider slope.
A roof's slope affects:
- water drainage
- snow accumulation
- construction materials
- usable roof space
- appearance
A steeper roof has a larger ratio of vertical rise to horizontal run.
This is another example of the same mathematical idea being used in a practical setting.
Real-World Slope: Science
Slope appears throughout science.
Position-Time Graph
Slope represents:
velocity
Velocity-Time Graph
Slope represents:
acceleration
Mass-Volume Graph
Slope can represent:
density
Force-Extension Graph
Under suitable conditions, slope can represent:
spring stiffness
Voltage-Current Relationships
Depending on which variable is placed on each axis, slope can represent electrical quantities related to resistance or conductance.
This is why graph interpretation is so important in science.
The Meaning Depends on the Axes
Suppose a graph compares:
distance on the y-axis
with:
time on the x-axis
Slope means:
change in distance / change in time
which is speed or velocity magnitude in an appropriate context.
But if we reverse the axes:
time on the y-axis
and:
distance on the x-axis
then slope becomes:
change in time / change in distance
The numerical meaning changes.
Always check:
What is on the y-axis?
What is on the x-axis?
Worked Example: Science Graph
A spring experiment produces two points:
Extension = 2 cm, Force = 4 N
Extension = 6 cm, Force = 12 N
If force is on the y-axis and extension is on the x-axis:
m = (12 − 4)/(6 − 2)
= 8/4
= 2 N/cm
Interpretation:
The force increases by 2 N for each additional centimetre of extension over this interval.
Worked Example: Negative Real-World Slope
A container is draining.
At 2 minutes:
Volume = 90 L
At 8 minutes:
Volume = 60 L
Calculate:
m = (60 − 90)/(8 − 2)
= −30/6
= −5 L/min
Interpretation:
The volume decreases by 5 litres every minute.
The negative sign communicates important information.
Worked Example: Zero Slope
A parked vehicle remains 200 m from a reference point for 5 minutes.
Its position-time graph is horizontal.
Change in position:
Δy = 0
Therefore:
m = 0/time
= 0 m/min
The zero slope tells us that its position is not changing.
Choosing Good Points from a Graph
When calculating slope visually:
- choose points clearly on the line
- use grid intersections when possible
- choose points reasonably far apart
- read coordinates carefully
- calculate rise and run
- include the correct sign
Choosing points farther apart can sometimes reduce the effect of small graph-reading errors.
But both points must lie on the actual line.
A Useful Visual Check
Before calculating, predict the sign.
Ask:
Does the line rise, fall, stay flat, or stand vertically as I move left to right?
Then predict:
Rises → positive
Falls → negative
Horizontal → zero
Vertical → undefined
After calculating, compare your result with your prediction.
If a line clearly falls from left to right but you calculate a positive slope, check your subtraction.
Common Mistakes
Using run/rise
Slope is:
rise/run
not:
run/rise.
Mixing the subtraction order
If you calculate:
y₂ − y₁
you must also calculate:
x₂ − x₁.
Forgetting negative signs
A falling line has a negative slope.
Saying a horizontal line has undefined slope
A horizontal line has:
m = 0
Saying a vertical line has zero slope
A vertical line has:
undefined slope
because the run is zero.
Dividing by zero
Division by zero is undefined.
Looking only at steepness
Slope describes both steepness and direction.
Assuming every positive slope equals 1
Any positive value can represent a positive slope.
Thinking −2 is steeper than −5
The slope −5 has the greater magnitude and represents a steeper line.
Confusing slope with the y-intercept
In:
y = 4x + 7
the slope is 4.
The y-intercept is 7.
Forgetting units in real-world problems
A slope of:
5 km/h
communicates more information than simply writing 5.
Ignoring the axes
The meaning and units of slope depend on which quantities are plotted.
Using only one point
Slope describes change between points. One point alone is not enough to determine the slope of an arbitrary line.
Key Terms
Slope — A measure of the steepness and direction of a line.
Rate of change — The amount one variable changes relative to another.
Rise — The vertical change between two points.
Run — The horizontal change between two points.
Slope formula — The formula m = (y₂ − y₁)/(x₂ − x₁).
Delta (Δ) — A symbol meaning "change in."
Δx — Change in the horizontal variable.
Δy — Change in the vertical variable.
Positive slope — A slope that rises from left to right.
Negative slope — A slope that falls from left to right.
Zero slope — The slope of a horizontal line.
Undefined slope — The slope of a vertical line.
Linear relationship — A relationship represented by a straight line and having a constant rate of change.
Constant slope — A slope that remains the same throughout a straight line.
Steepness — How rapidly a line rises or falls.
Magnitude of slope — The absolute value of the slope, useful for comparing steepness.
Coordinate — An ordered pair (x, y) describing a point's location.
x-coordinate — The horizontal position of a point.
y-coordinate — The vertical position of a point.
y-intercept — The point where a graph crosses the y-axis.
Slope-intercept form — The linear equation form y = mx + b.
Initial value — The y-value when x = 0.
Horizontal line — A line with zero slope.
Vertical line — A line with undefined slope.
Grade — A way of expressing slope as a percentage, often used for roads.
Average rate of change — The slope between two points on a graph.
Instantaneous rate of change — The rate of change at one exact point, studied using calculus.
Derivative — A calculus concept used to determine instantaneous rate of change.
Key Takeaways
- Slope describes the steepness and direction of a line.
- Slope is also a rate of change.
- The symbol m is commonly used for slope.
- Slope can be calculated using:
m = rise/run
- It can also be written:
m = Δy/Δx
- From two points:
m = (y₂ − y₁)/(x₂ − x₁)
- The subtraction order must remain consistent.
- A positive slope rises from left to right.
- A negative slope falls from left to right.
- A horizontal line has zero slope.
- A vertical line has undefined slope.
- Vertical slopes are undefined because they require division by zero.
- A larger absolute slope generally represents a steeper line.
- Straight lines have constant slopes.
- Slope can be calculated from coordinates, graphs, tables, and equations.
- In y = mx + b, m represents slope.
- The y-intercept is not the same as the slope.
- The units of slope are:
y-axis units / x-axis units
- Real-world slopes must be interpreted in context.
- Slope can represent speed, acceleration, cost per unit, temperature change, density, and many other rates.
- Road and ramp steepness can also be described using slope.
- The meaning of slope depends on which quantities appear on the axes.
- Curved graphs generally have changing slopes.
- The slope between two points on a curve represents an average rate of change.
- Calculus extends the idea of slope to find the instantaneous rate of change at a single point.
- The derivative is fundamentally connected to slope.
A useful visual reminder is:
↗ Positive
↘ Negative
→ Zero
↑ Undefined
And the most important calculation to remember is:
Slope = change in y / change in x
Check Your Understanding
1. Define slope in your own words.
2. What two features of a line does slope describe?
3. Write the slope formula using rise and run.
4. Write the slope formula using Δy and Δx.
5. Find the slope between:
(1, 3) and (5, 11)
6. Find the slope between:
(2, 9) and (6, 17)
7. Find the slope between:
(3, 12) and (7, 4)
8. Is the slope in Question 7 positive or negative?
9. Find the slope between:
(2, 6) and (8, 6)
10. Explain why the answer to Question 9 is zero.
11. Find the slope between:
(5, 2) and (5, 10)
12. Explain why the slope in Question 11 is undefined.
13. What type of slope does a horizontal line have?
14. What type of slope does a vertical line have?
15. A line rises 12 units while moving 4 units to the right. Find its slope.
16. A line falls 15 units while moving 5 units to the right. Find its slope.
17. Which is steeper: a line with slope 2 or a line with slope 6?
18. Which is steeper: a line with slope −3 or a line with slope −8?
19. Identify the slope of:
y = 5x + 2
20. Identify the slope of:
y = −4x + 7
21. Identify the slope of:
y = (2/3)x − 5
22. Rearrange and determine the slope:
2x + y = 10
23. Determine the slope represented by the table:
| x | y |
|---|---|
| 1 | 4 |
| 3 | 10 |
| 5 | 16 |
| 7 | 22 |
24. A distance-time graph has a slope of 12 km/h. Explain what this means.
25. A temperature-time graph has a slope of −2°C/min. Explain what this means.
26. A water-volume graph has a slope of 8 L/min. What does the slope tell you?
27. A road rises 6 m for every 100 m of horizontal distance. Calculate its slope and percentage grade.
28. Explain why the units of slope depend on the axes.
29. Explain the connection between slope and rate of change.
30. Challenge: A delivery company's cost is represented by:
C = 3.5d + 8
where:
C = cost in dollars
d = distance in kilometres
a. Identify the slope.
b. State the units of the slope.
c. Explain the meaning of the slope.
d. Identify the initial value.
e. Explain why the initial value is not the slope.
f. Calculate the cost for a 12 km delivery.
g. Sketch what the graph should generally look like.
h. Explain why the line has a positive slope.
i. Describe what would happen to the graph if the rate increased from $3.50/km to $5.00/km.
j. Explain how this example connects slope to the idea of rate of change.