Linear Functions
| Сайт: | Young Education |
| Курс: | Functions and Graphs |
| Книга: | Linear Functions |
| Надруковано: | Guest user |
| Дата: | понеділок 9 листопада 2026 16:39 PM |
1. Constant Rate of Change
Learning outcomes
- I can define rate of change.
- I can calculate the rate of change from tables.
- I can identify constant rates of change.
- I can compare different rates of change.
- I can interpret rates of change in context.


2. Slope
Learning outcomes
- I can define slope.
- I can calculate slope from two points.
- I can determine slope from a graph.
- I can distinguish between positive, negative, zero, and undefined slopes.
- I can explain the meaning of slope in real-life situations.
Slope
Slope describes the steepness and direction of a line.
It tells us how much the vertical value changes compared with the horizontal value.
In everyday language, slope can describe how steep something is. A steep hill has a greater slope than a gentle hill. In mathematics, the idea is more precise: slope measures the rate of change between two variables.
For a straight line, the slope remains constant along the entire line.


Understanding Slope
Imagine walking along a road.
If the road rises as you move forward, it has a positive slope.
If the road falls as you move forward, it has a negative slope.
If the road stays level, it has a zero slope.
A perfectly vertical cliff would represent an undefined slope.
Mathematically, we always read a graph from left to right when describing the direction of its slope.
Rise and Run
Slope compares two changes:
- rise — the vertical change
- run — the horizontal change
Therefore:
slope = rise/run
or:
slope = change in y / change in x
Using the symbol Δ to mean "change in":
m = Δy/Δx
The letter m is commonly used to represent slope.
For example, if a line rises 6 units while moving 2 units to the right:
m = 6/2
= 3
The slope is 3.
This means:
y increases by 3 units for every increase of 1 unit in x.


Slope from Two Points
If we know two points on a line, we can calculate its slope.
Suppose the points are:
(x₁, y₁)
and:
(x₂, y₂)
The slope formula is:
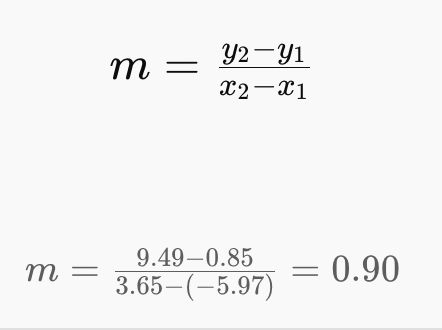
m = (y₂ − y₁)/(x₂ − x₁)
The numerator represents the change in y.
The denominator represents the change in x.
So the formula is simply another way of writing:
slope = vertical change / horizontal change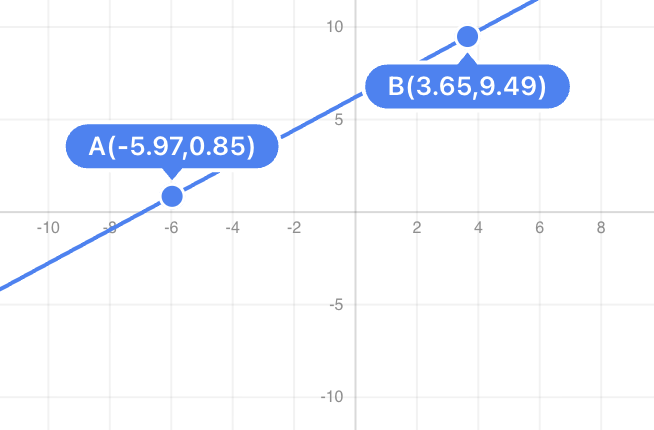


3. Slope-Intercept Form
Learning outcomes
- I can identify the slope and y-intercept in an equation.
- I can graph equations written in slope-intercept form.
- I can write equations from graphs.
- I can write equations from slope and a point.
- I can interpret slope-intercept form in context.
Slope-Intercept Form
A linear equation represents a straight-line relationship between two variables. One of the most useful ways to write a linear equation is slope-intercept form:
y = mx + b
where:
- m = slope
- b = y-intercept
- x and y = variables
Slope-intercept form is especially useful because we can identify two important features of a line simply by looking at its equation.
For example:
y = 3x + 2
has:
slope = 3
y-intercept = 2
The line crosses the y-axis at:
(0, 2)


Understanding y = mx + b
The equation:
y = mx + b
contains two numbers that control the position and direction of the line.
m Controls the Slope
The value of m tells us:
- how steep the line is
- whether the line rises or falls
- how much y changes when x changes
b Controls the y-Intercept
The value of b tells us where the line crosses the y-axis.
Because every point on the y-axis has:
x = 0
substituting x = 0 gives:
y = m(0) + b
so:
y = b
Therefore, the y-intercept is:
(0, b)
Identifying Slope and y-Intercept
Consider:
y = 4x + 7
Compare it with:
y = mx + b
Therefore:
m = 4
b = 7
So:
slope = 4
y-intercept = (0, 7)
Another Example
Consider:
y = −2x + 5
The slope is:
m = −2
The y-intercept is:
b = 5
Therefore:
y-intercept = (0, 5)
The negative slope tells us that the line falls from left to right.
What Is Slope?
Slope measures the rate of change of a line.
It compares vertical change with horizontal change:
slope = rise/run
or:
m = change in y / change in x
Using two points:
m = (y₂ − y₁)/(x₂ − x₁)
For example, if y increases by 6 while x increases by 2:
m = 6/2
m = 3
The slope is 3.


Slope as Rise Over Run
Suppose:
m = 2/3
This means:
rise = 2
run = 3
Starting at a point on the line:
- move 3 units right
- move 2 units up
to find another point.
Slope can also be interpreted in the opposite direction:
- move 3 units left
- move 2 units down
Both movements stay on the same line.
Whole-Number Slopes
A whole number can always be written as a fraction over 1.
For example:
m = 4
means:
m = 4/1
So from one point:
- move 1 right
- move 4 up
Similarly:
m = −3
can be written:
m = −3/1
so we could move:
- 1 right
- 3 down
Positive Slope
If:
m > 0
the line rises from left to right.
Example:
y = 2x + 1
As x increases, y increases.
Positive slope represents an increasing relationship.
Negative Slope
If:
m < 0
the line falls from left to right.
Example:
y = −3x + 4
As x increases, y decreases.
Negative slope represents a decreasing relationship.
Zero Slope
Consider:
y = 5
This can be written:
y = 0x + 5
Therefore:
m = 0
The graph is a horizontal line.
Its y-value never changes.
Undefined Slope
A vertical line such as:
x = 4
has undefined slope.
There is no horizontal change:
run = 0
and division by zero is undefined.
A vertical line cannot be written in ordinary slope-intercept form:
y = mx + b
Types of Slope
| Type | Value of m | Direction |
|---|---|---|
| Positive | m > 0 | Rises left to right |
| Negative | m < 0 | Falls left to right |
| Zero | m = 0 | Horizontal |
| Undefined | Cannot calculate | Vertical |
Recognizing these patterns helps when interpreting graphs.
Understanding the y-Intercept
The y-intercept is where the line crosses the y-axis.
For:
y = 3x − 4
the y-intercept is:
b = −4
Therefore the line crosses the y-axis at:
(0, −4)
Notice the difference between:
b = −4
and:
y-intercept = (0, −4)
One is a value; the other is a coordinate.
Graphing from Slope-Intercept Form
Suppose:
y = 2x + 1
We know:
m = 2
b = 1
To graph the equation:
- Plot the y-intercept (0, 1).
- Write the slope as 2/1.
- From (0, 1), move 1 right and 2 up.
- Plot the new point.
- Repeat if useful.
- Draw a straight line through the points.
The equation itself gives almost everything needed to graph the line.


Graphing a Fractional Slope
Graph:
y = (2/3)x − 1
Identify:
m = 2/3
b = −1
Start at:
(0, −1)
Then use the slope:
rise = 2
run = 3
Move:
- 3 right
- 2 up
This gives another point:
(3, 1)
Continue the pattern and draw the line.
Graphing a Negative Slope
Graph:
y = −2x + 4
Start at:
(0, 4)
Write:
−2 = −2/1
From the y-intercept:
- move 1 right
- move 2 down
This produces another point:
(1, 2)
Repeat:
(2, 0)
The line falls from left to right.
Negative Fractional Slopes
Suppose:
m = −3/4
There are two convenient ways to represent this:
rise = −3, run = 4
or:
rise = 3, run = −4
So you can move:
- 4 right and 3 down
or:
- 4 left and 3 up
Both movements describe the same slope.
Creating a Table to Graph a Line
Another way to graph:
y = 2x + 1
is to choose several x-values.
| x | y = 2x + 1 |
|---|---|
| −2 | −3 |
| −1 | −1 |
| 0 | 1 |
| 1 | 3 |
| 2 | 5 |
Plot these ordered pairs and connect them with a straight line.
This method works, but using the slope and y-intercept is often faster.
Writing an Equation from a Graph
To write an equation from a graph, identify:
- the y-intercept
- the slope
Then substitute them into:
y = mx + b
Suppose a graph crosses the y-axis at:
(0, 3)
and rises 2 units for every 1 unit to the right.
Then:
m = 2
b = 3
Therefore:
y = 2x + 3


Finding Slope from Two Points on a Graph
Suppose two points on a line are:
(1, 3)
and:
(4, 9)
Use:
m = (y₂ − y₁)/(x₂ − x₁)
Substitute:
m = (9 − 3)/(4 − 1)
m = 6/3
m = 2
If the graph shows the y-intercept is:
(0, 1)
then:
b = 1
Therefore:
y = 2x + 1
Be Consistent When Calculating Slope
Using:
(1, 3) and (4, 9)
we wrote:
m = (9 − 3)/(4 − 1)
If we reverse the order, we must reverse it in both numerator and denominator:
m = (3 − 9)/(1 − 4)
m = −6/−3
m = 2
Both methods give the same result.
Do not reverse only one part.
Writing an Equation from Slope and y-Intercept
Suppose:
slope = 5
and:
y-intercept = −3
Use:
y = mx + b
Substitute:
m = 5
b = −3
Therefore:
y = 5x − 3
Writing an Equation from Slope and a Point
Sometimes the slope is known, but the y-intercept is not.
Suppose:
m = 3
and the line passes through:
(2, 7)
Start with:
y = mx + b
Substitute:
x = 2
y = 7
m = 3
giving:
7 = 3(2) + b
7 = 6 + b
Therefore:
b = 1
So the equation is:
y = 3x + 1
Why This Method Works
The point:
(2, 7)
lies on the line.
Therefore its x- and y-values must satisfy the equation.
We know:
y = mx + b
and:
m = 3
so:
y = 3x + b
Using the known point lets us determine the only missing value, b.
Another Slope-and-Point Example
A line has:
m = −2
and passes through:
(3, 1)
Start:
y = mx + b
Substitute:
1 = −2(3) + b
1 = −6 + b
Add 6:
b = 7
Therefore:
y = −2x + 7
Check the point:
1 = −2(3) + 7
1 = 1 ✓
Finding an Equation from Two Points
Suppose a line passes through:
(2, 5)
and:
(6, 13)
First find the slope:
m = (13 − 5)/(6 − 2)
m = 8/4
m = 2
Now use one point to find b.
Using:
(2, 5)
in:
y = mx + b
gives:
5 = 2(2) + b
5 = 4 + b
b = 1
Therefore:
y = 2x + 1
Verify with the Second Point
Use:
(6, 13)
in:
y = 2x + 1
13 = 2(6) + 1
13 = 13 ✓
The second point confirms that the equation is correct.
Converting to Slope-Intercept Form
Not every equation starts in the form:
y = mx + b
Consider:
2x + y = 7
Solve for y:
y = −2x + 7
Now we can immediately identify:
m = −2
b = 7
Another Conversion Example
Consider:
3x + 2y = 10
Solve for y:
2y = −3x + 10
Divide everything by 2:
y = −(3/2)x + 5
Therefore:
m = −3/2
b = 5
Be Careful When Dividing
For:
4x + 2y = 12
subtract 4x:
2y = −4x + 12
Divide every term by 2:
y = −2x + 6
Not:
y = −4x + 6
Both terms on the right must be divided.
Slope as Rate of Change
Slope is much more than the steepness of a graph.
It describes how one quantity changes relative to another.
Suppose:
C = 3x + 10
where:
- C = total cost
- x = number of items
The slope is:
3
This means the cost increases by:
$3 per item
The intercept is:
10
This represents a starting cost of:
$10
Interpreting the Intercept in Context
In:
C = 3x + 10
when:
x = 0
we have:
C = 10
So the intercept represents the value before any items are purchased.
Depending on the context, this could represent:
- an initial fee
- a starting amount
- a fixed cost
- a base charge
- an initial measurement
The meaning depends on what x and y represent.
Taxi Fare Example
Suppose:
C = 2.5d + 4
where:
- C = cost in dollars
- d = distance in kilometres
The slope:
2.5
means:
$2.50 per kilometre
The intercept:
4
means:
$4 initial charge
If the trip is 6 km:
C = 2.5(6) + 4
C = 15 + 4
C = $19


Savings Example
Suppose:
S = 25w + 100
where:
- S = total savings
- w = number of weeks
The slope is:
25
This means savings increase by:
$25 per week
The intercept is:
100
This means the person started with:
$100
After 8 weeks:
S = 25(8) + 100
S = 300
Temperature Example
Suppose the temperature of an object is modeled by:
T = −3t + 90
where:
- T = temperature in °C
- t = time in minutes
The slope:
−3
means the temperature decreases by:
3°C per minute
The intercept:
90
means the initial temperature at t = 0 is:
90°C
The negative slope represents cooling.
Distance Example
Suppose:
d = 60t + 20
where:
- d = distance from a reference point in kilometres
- t = time in hours
The slope:
60
means the object travels away from the reference point at:
60 km/h
The intercept:
20
means the object began:
20 km from the reference point
Science Example
Suppose an experiment produces:
V = 2.4t + 1.5
where:
- V = volume in mL
- t = time in seconds
The slope:
2.4 mL/s
represents the rate at which volume increases.
The intercept:
1.5 mL
represents the initial volume at:
t = 0
The units of slope are:
units of y / units of x
Units of Slope
Since:
slope = change in y / change in x
the units of slope come from dividing the units of y by the units of x.
Examples:
Distance vs time:
km/h
Cost vs number of items:
$/item
Temperature vs time:
°C/min
Mass vs volume:
g/cm³
Population vs time:
people/year
Units help explain what slope actually means.
Comparing Slopes
Consider:
Line A: y = 2x + 1
Line B: y = 5x + 1
Both have the same y-intercept.
But:
m_A = 2
m_B = 5
Line B increases faster and is steeper.
For positive slopes, a larger slope means a faster increase.
Comparing Negative Slopes
Consider:
Line A: y = −2x + 4
Line B: y = −5x + 4
Both decrease.
Line B has the larger magnitude of slope:
|−5| > |−2|
so Line B falls more steeply.
Parallel Lines
Consider:
y = 3x + 2
y = 3x − 5
Both have:
m = 3
but different y-intercepts.
Therefore the lines have the same steepness and never meet.
They are parallel.
For different nonvertical lines:
same slope + different intercepts → parallel lines
The Same Line
Consider:
y = 2x + 4
and:
2y = 4x + 8
Divide the second equation by 2:
y = 2x + 4
The equations are identical.
They represent the same line.
This idea becomes particularly important when solving systems of equations.
Connection to Systems of Equations
Slope-intercept form can help predict the number of solutions in a system.
If two lines have:
different slopes
they intersect once.
Therefore:
one solution
If they have:
same slope, different y-intercepts
they are parallel.
Therefore:
no solution
If they have:
same slope, same y-intercept
they are the same line.
Therefore:
infinitely many solutions


A Useful Comparison
| Slopes | y-Intercepts | Relationship | Solutions |
|---|---|---|---|
| Different | Any | Intersecting lines | One |
| Same | Different | Parallel lines | None |
| Same | Same | Same line | Infinitely many |
This lets us sometimes classify a system without fully solving it.
Writing Equations from Real Situations
Suppose a gym charges:
- $25 membership fee
- $8 per visit
Let:
C = total cost
v = number of visits
The fixed starting amount becomes the intercept:
b = 25
The cost per visit becomes the slope:
m = 8
Therefore:
C = 8v + 25
Identifying Slope and Intercept from Words
Look for language such as:
per, each, every, for each
These often indicate slope.
Look for:
starting, initial, base, fixed, at zero
These often indicate the intercept.
For example:
A tank begins with 50 L of water and fills at 4 L per minute.
Equation:
V = 4t + 50
Slope:
4 L/min
Intercept:
50 L
When the Intercept Is Zero
Suppose:
d = 70t
This can be written:
d = 70t + 0
Therefore:
m = 70
b = 0
The graph passes through:
(0, 0)
This often represents a direct proportional relationship.
For example, an object starting at zero distance and travelling at constant speed may have:
d = vt
When the Slope Is Zero
Suppose:
T = 25
This can be written:
T = 0t + 25
Therefore:
m = 0
The temperature remains constant at:
25°C
The graph is horizontal.
Recognizing Hidden Coefficients
Consider:
y = x + 6
There is an invisible coefficient of 1:
y = 1x + 6
Therefore:
m = 1
b = 6
For:
y = −x + 4
the coefficient is:
−1
Therefore:
m = −1
b = 4
No Written Constant
Consider:
y = 5x
This means:
y = 5x + 0
Therefore:
m = 5
b = 0
The line passes through the origin.
Writing a Complete Interpretation
Suppose:
C = 12t + 40
where C is cost in dollars and t is time in hours.
A weak interpretation is:
The slope is 12 and the intercept is 40.
A stronger interpretation is:
The cost increases by $12 for each additional hour, and the initial cost at 0 hours is $40.
Good mathematical communication explains what the numbers mean in context.
A Reliable Strategy
When working with slope-intercept form, use:
Identify → Interpret → Graph or Construct → Check
Identify
Find m and b.
Interpret
Determine what the slope and intercept mean.
Graph or Construct
Use m and b to graph the line, or use known information to create the equation.
Check
Confirm that known points satisfy the equation and that the graph or equation is reasonable.
Common Mistakes
Mistake: Switching m and b.
In:
y = mx + b
m is the slope and b is the y-intercept.
Mistake: Ignoring the sign of the slope.
In:
y = −3x + 2
the slope is:
−3
not 3.
Mistake: Saying the y-intercept is just a point without the zero x-coordinate.
If:
b = 5
the y-intercept is:
(0, 5)
Mistake: Reading the constant as the slope.
For:
y = 2x + 7
slope = 2, not 7.
Mistake: Treating 3 as though it cannot be a fraction.
3 = 3/1
so its rise/run interpretation is:
3 up, 1 right
Mistake: Using inconsistent subtraction when finding slope.
If you calculate:
y₂ − y₁
you must also calculate:
x₂ − x₁
in the same order.
Mistake: Forgetting that a negative slope can be shown in different ways.
−3/4 = 3/(−4)
Both represent the same slope.
Mistake: Forgetting to divide every term when rearranging into slope-intercept form.
From:
2y = −6x + 10
the correct result is:
y = −3x + 5
Mistake: Assuming the y-intercept is always positive.
The line may cross below the origin.
Mistake: Ignoring units in real-world problems.
A slope of 5 might mean:
- $5/item
- 5 km/h
- 5°C/min
- 5 L/s
depending on the situation.
Key Terms
Linear equation — equation whose graph is a straight line.
Slope-intercept form — linear equation written as y = mx + b.
Slope — rate of change of y relative to x.
Rate of change — amount one quantity changes compared with another.
Rise — vertical change between two points.
Run — horizontal change between two points.
y-intercept — point where a graph crosses the y-axis.
x-intercept — point where a graph crosses the x-axis.
Positive slope — slope describing a line that rises from left to right.
Negative slope — slope describing a line that falls from left to right.
Zero slope — slope of a horizontal line.
Undefined slope — slope of a vertical line.
Slope formula — m = (y₂ − y₁)/(x₂ − x₁).
Coordinate — ordered pair describing a point's position.
Origin — point (0, 0).
Slope-intercept equation — equation in which slope and y-intercept can be read directly.
Rate — comparison between quantities with different units.
Initial value — value of y when x = 0.
Parallel lines — lines in the same plane with equal slopes that never intersect.
Key Takeaways
- Slope-intercept form is y = mx + b.
- The coefficient m represents the slope.
- The constant b represents the y-intercept.
- The y-intercept occurs at (0, b).
- Slope measures rate of change.
- Slope can be calculated using rise/run.
- Using two points, m = (y₂ − y₁)/(x₂ − x₁).
- Positive slopes rise from left to right.
- Negative slopes fall from left to right.
- A horizontal line has slope 0.
- A vertical line has undefined slope.
- A whole-number slope can be written over 1.
- To graph from slope-intercept form, plot the y-intercept first and then use the slope.
- A line's equation can be written from its graph by determining m and b.
- If the slope and one point are known, substitute the point into y = mx + b to find b.
- Two points can be used to calculate the slope and then determine the equation.
- Equations can often be rearranged into slope-intercept form by solving for y.
- In real situations, slope represents a rate of change.
- The units of slope are units of y divided by units of x.
- The y-intercept often represents an initial or starting value.
- A zero y-intercept means the line passes through the origin.
- Lines with the same slope and different intercepts are parallel.
- Lines with different slopes intersect once.
- Lines with the same slope and same intercept are the same line.
- Slope-intercept form is therefore especially useful when graphing and analyzing systems of linear equations.
Check Your Understanding
- State the general slope-intercept form of a linear equation.
- What does m represent in y = mx + b?
- What does b represent?
- Identify the slope and y-intercept of y = 4x + 7.
- Identify the slope and y-intercept of y = −3x + 5.
- Identify the slope and y-intercept of y = x − 6.
- Identify the slope and y-intercept of y = −x + 8.
- Identify the slope and y-intercept of y = 5x.
- Describe how you would graph y = 2x + 3 using the slope and y-intercept.
- Describe how you would graph y = −3x + 4.
- Find the slope of the line through (2, 3) and (6, 11).
- Find the slope of the line through (−1, 5) and (3, −3).
- A graph has slope 3 and y-intercept −2. Write its equation.
- A line has slope 4 and passes through (2, 11). Find its equation in slope-intercept form.
- A line has slope −2 and passes through (3, 1). Find its equation.
- Find the equation of the line passing through (2, 5) and (6, 13).
- Rewrite 3x + 2y = 10 in slope-intercept form and identify its slope and y-intercept.
- A taxi fare is modeled by C = 2.5d + 4. Explain what both 2.5 and 4 mean in context.
- A tank contains 80 L of water and fills at 6 L/min. Write a linear equation relating volume V to time t, then identify and interpret its slope and intercept.
- Two equations are y = 3x + 2 and y = 3x − 5. Without graphing or solving algebraically, explain the relationship between their graphs and determine how many solutions the corresponding system has.
4. Writing Linear Equations
Learning outcomes
- I can write equations using two points.
- I can write equations using slope and intercept.
- I can determine equations from tables.
- I can model situations with linear equations.
- I can verify that an equation matches a graph.


5. Applications of Linear Functions
Learning outcomes
- I can solve problems involving linear functions.
- I can interpret graphs in real-world contexts.
- I can predict values using linear models.
- I can compare different linear relationships.
- I can evaluate whether a linear model is appropriate.
Applications of Linear Functions
Linear functions are useful because many real-world situations involve a quantity that changes at an approximately constant rate.
Examples include:
- wages earned per hour
- distance travelled at constant speed
- taxi fares
- phone plans
- savings
- filling or draining containers
- temperature changes over short periods
- rental costs
- production costs
A common form is:
y = mx + b
where:
- m = rate of change
- b = initial value
- x = independent variable
- y = dependent variable
In applications, the important question is not only What are m and b? but also:
What do they mean in this situation?


Linear Functions as Models
A mathematical model uses mathematics to represent a real situation.
Suppose a bicycle rental company charges:
- $8 initial fee
- $5 per hour
Let:
C = total cost
h = number of hours
The linear model is:
C = 5h + 8
Here:
m = 5
means the cost increases by $5 per hour.
b = 8
means the customer pays $8 before any hourly charges are added.
Recognizing a Linear Situation
A relationship is linear when it has a constant rate of change.
Suppose a worker earns $18 per hour.
| Hours | Earnings |
|---|---|
| 1 | $18 |
| 2 | $36 |
| 3 | $54 |
| 4 | $72 |
Every additional hour increases earnings by:
$18
Therefore the rate of change is constant.
The model is:
E = 18h
Initial Values
Many linear models include an initial value.
Suppose a student already has $100 and saves $25 each week.
Then:
S = 25w + 100
where:
- S = total savings
- w = weeks
The initial value is:
$100
The rate of change is:
$25/week
After 8 weeks:
S = 25(8) + 100
S = 300
Interpreting Slope in Context
Slope represents:
change in output / change in input
Its meaning depends on the variables.
Examples:
| Situation | Possible slope |
|---|---|
| Distance vs time | km/h |
| Cost vs items | $/item |
| Temperature vs time | °C/min |
| Water volume vs time | L/min |
| Earnings vs time | $/h |
| Population vs time | people/year |
The units of slope are essential to its interpretation.
Interpreting the y-Intercept
The y-intercept represents the value of y when:
x = 0
Depending on the situation, it might represent:
- starting money
- initial temperature
- starting distance
- fixed charge
- base fee
- initial population
- starting volume
For:
C = 4x + 15
if C represents cost, then:
$15
could represent a fixed initial charge.
Solving Problems with Linear Functions
A useful strategy is:
Define → Model → Calculate → Interpret → Check
Define
Identify what the variables represent.
Model
Write or identify the linear equation.
Calculate
Substitute the required value or solve for the unknown.
Interpret
Explain the answer in the context of the problem.
Check
Determine whether the answer is mathematically and practically reasonable.
Predicting Values
Suppose:
C = 6x + 20
models the cost of renting equipment, where x is the number of hours.
Predict the cost for 7 hours.
Substitute:
x = 7
C = 6(7) + 20
C = 42 + 20
C = 62
Therefore:
A 7-hour rental costs $62.
Working Backwards
Linear models can also be used to determine an input.
Suppose:
C = 6x + 20
and the total cost is $80.
Set:
C = 80
80 = 6x + 20
Subtract 20:
60 = 6x
Therefore:
x = 10
A total cost of $80 corresponds to:
10 hours
Distance and Constant Speed
Suppose a car begins 30 km from a city and travels away from it at 70 km/h.
Let:
d = distance from the city
t = time in hours
Model:
d = 70t + 30
After 3 hours:
d = 70(3) + 30
d = 240
Therefore:
The car is 240 km from the city after 3 hours.


Interpreting a Distance-Time Graph
On a distance-time graph:
horizontal axis = time
vertical axis = distance
The slope represents:
speed
A steeper line represents a greater speed.
A horizontal line means:
distance is not changing
so the object is stationary relative to the reference point.
Positive and Negative Slopes in Context
Suppose:
V = −15t + 300
models water in a tank.
The slope:
−15 L/min
means the tank loses 15 L every minute.
The intercept:
300 L
means the tank initially contains 300 L.
A negative slope does not mean the model is wrong. It represents a decreasing quantity.
When Will the Tank Be Empty?
Use:
V = −15t + 300
When the tank is empty:
V = 0
Therefore:
0 = −15t + 300
15t = 300
t = 20
The tank becomes empty after:
20 minutes
After that, the model is no longer physically appropriate because it would predict negative water volume.
Domain in Real-World Models
Mathematically, a linear function may continue indefinitely.
A real-world model often cannot.
For the tank:
V = −15t + 300
a reasonable domain is:
0 ≤ t ≤ 20
because:
- negative time is not relevant
- after 20 minutes the tank is empty
The context determines the meaningful domain.
Interpreting Graphs
A real-world graph can communicate:
- initial value
- rate of change
- increasing or decreasing behaviour
- points where important events occur
- intersections between models
- ranges where the model makes sense


Reading an Initial Value from a Graph
Suppose a graph of savings against time crosses the vertical axis at:
$200
This means:
At time 0, the person already had $200.
It does not mean the person saves $200 each week.
The rate of saving comes from the slope, not the intercept.
Reading Rate from a Graph
Suppose a graph passes through:
(2, 70)
and:
(6, 150)
Slope:
m = (150 − 70)/(6 − 2)
m = 80/4
m = 20
If x represents weeks and y represents dollars:
The quantity increases by $20 per week.
Constructing a Model from Data
Suppose:
| Weeks | Savings ($) |
|---|---|
| 2 | 90 |
| 4 | 130 |
| 6 | 170 |
| 8 | 210 |
Find the rate:
m = (130 − 90)/(4 − 2)
m = 40/2
m = 20
Use:
S = 20w + b
Substitute:
90 = 20(2) + b
90 = 40 + b
b = 50
Therefore:
S = 20w + 50
The model tells us the person started with $50 and saves $20 per week.
Prediction Using a Model
Using:
S = 20w + 50
predict the savings after 15 weeks.
S = 20(15) + 50
S = 350
The model predicts:
$350 after 15 weeks.
Interpolation
Suppose data were collected between:
week 2 and week 10
Using the model to estimate the value at:
week 6
is interpolation.
Interpolation means making a prediction within the range of observed data.
It is often more reliable than predicting far beyond the available data.
Extrapolation
Using the same data to predict:
week 100
is extrapolation.
This prediction lies outside the measured range.
The linear pattern might continue, but we have less evidence that it will.
Therefore extrapolated predictions should be treated cautiously.
Comparing Linear Relationships
Linear functions are especially useful when comparing options.
Suppose two phone plans are:
Plan A: C = 20 + 5x
Plan B: C = 50 + 2x
where x represents units of usage.
Plan A has:
- lower initial cost
- higher rate
Plan B has:
- higher initial cost
- lower rate
Which plan is cheaper depends on the amount of usage.


Finding the Break-Even Point
At the break-even point:
Plan A cost = Plan B cost
Therefore:
20 + 5x = 50 + 2x
Subtract 2x:
20 + 3x = 50
Subtract 20:
3x = 30
x = 10
Find the cost:
C = 20 + 5(10)
C = 70
Therefore the plans cost the same at:
10 units of usage
with a cost of:
$70
Interpreting the Intersection
The point:
(10, 70)
means:
At 10 units of usage, both plans cost $70.
Before the intersection, one plan is cheaper.
After the intersection, the other may become cheaper.
An intersection therefore has an important practical meaning.
Which Plan Is Cheaper Before the Intersection?
Test:
x = 5
Plan A:
C = 20 + 5(5)
C = 45
Plan B:
C = 50 + 2(5)
C = 60
Therefore:
Plan A is cheaper at 5 units.
Which Plan Is Cheaper After the Intersection?
Test:
x = 20
Plan A:
C = 20 + 5(20)
C = 120
Plan B:
C = 50 + 2(20)
C = 90
Therefore:
Plan B is cheaper at 20 units.
The lower rate eventually compensates for Plan B's larger starting cost.
Comparing Slopes
Suppose:
A = 4x + 20
B = 7x + 5
The slopes are:
4 and 7
Therefore B increases faster.
This does not automatically mean B is always larger.
Its intercept is smaller.
Both slope and intercept must be considered.
Comparing Initial Values
Consider:
A = 8x + 10
B = 5x + 40
A begins at:
10
B begins at:
40
So B starts higher.
But A has the greater rate of increase.
Eventually A may catch up and pass B.
This is why intersections are useful when comparing linear relationships.
Wages Example
Job A pays:
A = 18h
Job B pays:
B = 15h + 60
where h is hours worked.
Job B includes an additional $60 payment but has a lower hourly rate.
Find when earnings are equal:
18h = 15h + 60
3h = 60
h = 20
At 20 hours:
A = 18(20) = 360
Both jobs pay:
$360
Interpreting the Wage Comparison
Before 20 hours:
Job B pays more
because of the $60 initial payment.
After 20 hours:
Job A pays more
because its hourly rate is higher.
The intersection helps identify when one option becomes better than another.
Taxi Comparison
Taxi A:
C = 3d + 4
Taxi B:
C = 2d + 10
where d is distance in kilometres.
Find when they cost the same:
3d + 4 = 2d + 10
d = 6
Cost:
C = 3(6) + 4
C = 22
At:
6 km
both taxis cost:
$22
Interpreting a Graph with Two Lines
If two cost graphs intersect:
- the intersection represents equal cost
- below the intersection, the lower line represents the cheaper option
- above the intersection, the lower line still represents the cheaper option, although which line is lower may have changed
Graphs can therefore help with decision-making.
Linear Models in Business
Suppose a company has:
C = 500 + 8x
where:
- C = production cost
- x = number of products
The intercept:
500
represents fixed costs.
The slope:
8
represents an additional:
$8 per product
If revenue is:
R = 13x
the company can compare cost and revenue.
Break-Even in Business
At break-even:
Revenue = Cost
Therefore:
13x = 500 + 8x
5x = 500
x = 100
At:
100 products
revenue equals cost.
For production above 100 products, this simple model predicts that revenue exceeds cost.


Profit as a Linear Function
Profit can be calculated as:
Profit = Revenue − Cost
Using:
R = 13x
and:
C = 500 + 8x
we get:
P = 13x − (500 + 8x)
P = 5x − 500
At:
x = 100
P = 0
This confirms the break-even point.
Linear Models in Science
Linear functions frequently appear in science.
Examples include:
d = vt + d₀
for constant-speed motion.
V = V₀ + rt
for a container filling at constant rate.
T = T₀ + rt
for approximately constant temperature change.
The same mathematical structure appears in many different contexts.
Motion Example
Suppose:
d = 12t + 5
where d is metres and t is seconds.
Interpret:
12 m/s
as the rate of change of distance.
Interpret:
5 m
as the starting position.
At 8 seconds:
d = 12(8) + 5
d = 101 m
Temperature Example
Suppose:
T = −2.5t + 80
where T is °C and t is minutes.
Slope:
−2.5°C/min
Initial temperature:
80°C
After 12 minutes:
T = −2.5(12) + 80
T = 50°C
When Is a Linear Model Appropriate?
A linear model is appropriate when:
- the rate of change is constant or approximately constant
- the data points form approximately a straight-line pattern
- the model makes reasonable predictions over the relevant range
- there is a logical reason to expect approximately constant change
Checking Constant Rate from a Table
Consider:
| x | y |
|---|---|
| 0 | 5 |
| 2 | 11 |
| 4 | 17 |
| 6 | 23 |
Calculate:
Δy/Δx = 6/2 = 3
for each interval.
The rate remains constant.
Therefore a linear model is appropriate.
When a Linear Model Is Not Appropriate
Consider:
| x | y |
|---|---|
| 0 | 2 |
| 1 | 4 |
| 2 | 8 |
| 3 | 16 |
| 4 | 32 |
The changes are:
+2, +4, +8, +16
The rate of change is not constant.
This pattern is not linear.
A linear model would not accurately represent the relationship.
Curved Graphs Are Usually Not Linear
A linear function produces a straight-line graph.
If data consistently follow a curve, another model may be more appropriate.
Common nonlinear patterns include:
- exponential growth
- exponential decay
- quadratic relationships
- inverse relationships
- periodic relationships


Real Data Are Not Always Perfect
Real measurements often contain variation.
Consider:
| Time | Temperature |
|---|---|
| 0 | 20.1 |
| 1 | 22.0 |
| 2 | 24.2 |
| 3 | 25.9 |
| 4 | 28.1 |
The increases are not exactly identical.
However, the data increase by approximately:
2°C per unit time
A linear model might still be reasonable.
Real data do not have to lie perfectly on a line for a linear model to be useful.
Line of Best Fit
When data are approximately linear, a line of best fit can be used.
The line does not need to pass through every point.
Instead, it represents the overall trend.
A linear model based on a best-fit line can be used to:
- describe the trend
- estimate the rate of change
- make predictions
Residuals
A residual measures the difference between an observed value and the value predicted by a model.
In simple terms:
residual = actual value − predicted value
Small residuals suggest that the model predicts the data reasonably well.
Large or systematic residuals may suggest that a different model would be better.
Example of a Prediction Error
Suppose a model predicts:
y = 42
but the measured value is:
45
Then:
residual = 45 − 42
residual = 3
The model underestimated the observed value by 3 units.
Appropriate Does Not Mean Perfect
A model is a simplified representation of reality.
A useful linear model might not predict every measurement exactly.
Instead, ask:
- Does it capture the overall trend?
- Are the errors reasonably small?
- Is the rate approximately constant?
- Does the model make sense scientifically or practically?
- Are predictions being made within a sensible range?
Beware of Extrapolation
Suppose population data are approximately linear between 2020 and 2025.
A prediction for 2026 might be reasonable.
A prediction for the year 2200 using the same linear model would be much less reliable.
Many factors could change over such a long period.
The farther we extrapolate, the greater the risk that the original pattern no longer applies.
Impossible Predictions
Suppose:
T = −4t + 80
models cooling.
Eventually the model predicts:
T = −1000°C
That may be physically impossible under the conditions of the problem.
This tells us the linear model is only valid for a limited time.
Mathematical models must be interpreted using real-world knowledge.
Population Models
Suppose:
P = 5000t + 100000
where t is years after a particular starting year.
The model assumes population increases by:
5,000 people per year
This might work over a short period.
Over decades or centuries, birth rates, migration, resources, and other factors may change.
A linear model may eventually become inappropriate.
Comparing a Table, Graph, and Equation
A linear relationship can be represented in several ways.
Equation
Shows the rate and initial value precisely.
Table
Shows specific input-output pairs.
Graph
Shows the overall pattern visually.
Verbal Description
Explains what the quantities mean in context.
Strong mathematical understanding means moving between all four representations.
From Equation to Table
For:
y = 3x + 2
we can calculate:
| x | y |
|---|---|
| 0 | 2 |
| 1 | 5 |
| 2 | 8 |
| 3 | 11 |
The table confirms a constant increase of:
3
for every increase of:
1
in x.
From Table to Context
Suppose:
| Hours | Cost ($) |
|---|---|
| 0 | 10 |
| 1 | 14 |
| 2 | 18 |
| 3 | 22 |
The initial cost is:
$10
The rate is:
$4/hour
Therefore:
C = 4h + 10
A possible interpretation is a rental service charging $10 initially plus $4 per hour.
From Context to Graph
Suppose:
C = 4h + 10
The graph begins at:
(0, 10)
and rises:
4 units vertically for each 1 unit horizontally
Every point on the graph represents a possible combination of time and cost within the meaningful domain.
Discrete Versus Continuous Situations
Some linear relationships are continuous.
Examples:
- time
- distance
- temperature
- volume
Values between measured points can make sense.
Other situations are discrete.
Examples:
- number of students
- number of cars
- number of tickets
- number of products
If x represents tickets, values such as:
x = 3.7 tickets
usually do not make sense.
The context affects which points on a linear graph are meaningful.
Recognizing Unreasonable Answers
Suppose a model predicts:
−8 students
This is mathematically possible as an output of an equation but not reasonable in the real situation.
Suppose a model predicts:
2.5 hours
That may be completely reasonable.
Always ask:
What does this number represent?
Comparing Models from Graphs
Suppose two lines represent savings accounts.
Account A has:
- lower intercept
- steeper slope
Account B has:
- higher intercept
- flatter slope
This means:
- B starts with more money
- A grows faster
- A may eventually overtake B
The intersection represents the time when both accounts contain the same amount.
Comparing Models Without Solving
Suppose:
A = 8x + 100
B = 5x + 100
Both start at the same value:
100
But:
8 > 5
Therefore, for positive x:
A grows faster than B.
We can make this comparison directly from the slopes.
Same Slope, Different Intercepts
Suppose:
A = 4x + 20
B = 4x + 50
Both increase at the same rate.
B always remains:
30 units greater
than A.
Their graphs are parallel.
They never intersect.
A Full Application Example
A fitness centre offers two payment plans.
Plan A:
A = 12v + 20
Plan B:
B = 8v + 52
where v is the number of visits.
Interpret Plan A
Initial fee:
$20
Cost per visit:
$12
Interpret Plan B
Initial fee:
$52
Cost per visit:
$8
Find when the costs are equal
12v + 20 = 8v + 52
4v = 32
v = 8
Cost:
A = 12(8) + 20
A = 116
Therefore:
Both plans cost $116 at 8 visits.
For fewer than 8 visits, Plan A is cheaper.
For more than 8 visits, Plan B is cheaper.
This is a complete interpretation of the two linear models.
Evaluating a Model
Before trusting a linear model, ask:
Is the rate approximately constant?
Does the graph look approximately straight?
Does the model fit the known data reasonably well?
Are the variables logically related in a linear way?
Is the prediction within or far beyond the observed range?
Does the prediction make sense in the real world?
A mathematical equation can be calculated correctly while still being a poor model of reality.
Common Mistakes
Mistake: Treating slope as only a number.
In applications, slope should be interpreted with units.
Mistake: Confusing slope and intercept.
Slope is the rate of change.
Intercept is the value when the input is zero.
Mistake: Ignoring a negative slope.
A negative slope represents a decreasing quantity.
Mistake: Giving only a numerical answer.
Explain what the answer means in context.
Mistake: Assuming every relationship is linear.
Check whether the rate of change is constant or approximately constant.
Mistake: Assuming real data must be perfectly linear.
Real measurements often contain variation.
Mistake: Extrapolating too far.
A relationship that is approximately linear over one range may not remain linear indefinitely.
Mistake: Ignoring the meaningful domain.
A mathematical model may produce values that are impossible in the real situation.
Mistake: Assuming the steeper line is always larger.
The intercept also matters.
Mistake: Comparing only initial values.
A model starting lower may eventually become larger if it has a greater slope.
Mistake: Ignoring intersections.
An intersection often represents an important event such as equal cost, equal distance, or break-even.
Mistake: Treating discrete quantities as continuous.
Not every decimal value makes sense for counts such as people or tickets.
Key Terms
Linear function — function with a constant rate of change and a straight-line graph.
Linear model — linear function used to represent a real-world relationship.
Slope — rate of change of the dependent variable relative to the independent variable.
Rate of change — amount one quantity changes compared with another.
y-intercept — value of the dependent variable when the independent variable is zero.
Initial value — starting value represented by the intercept.
Prediction — value estimated using a mathematical model.
Interpolation — prediction made within the range of known data.
Extrapolation — prediction made outside the range of known data.
Intersection — point where two graphs meet.
Break-even point — point where two financial quantities, commonly cost and revenue, are equal.
Domain — possible or meaningful input values.
Range — possible or meaningful output values.
Continuous data — data that can take values throughout an interval.
Discrete data — data consisting of separate countable values.
Line of best fit — straight line representing the overall trend of approximately linear data.
Residual — difference between an observed value and a model's predicted value.
Mathematical model — mathematical representation used to describe or predict a real situation.
Constant rate — rate of change that remains the same.
Reasonableness — whether a mathematical result makes sense in its context.
Key Takeaways
- Linear functions are useful for situations involving constant or approximately constant rates of change.
- A common linear model is y = mx + b.
- The slope represents the rate of change.
- The y-intercept represents the initial value.
- Slope should be interpreted with appropriate units.
- Linear models can be used to calculate unknown values.
- Substituting an input allows us to predict an output.
- Setting the output to a known value allows us to solve for the input.
- Graphs provide visual information about initial values and rates of change.
- A steeper slope represents a larger magnitude of rate of change.
- Negative slopes represent decreasing relationships.
- Intersections are important when comparing two linear models.
- An intersection means both relationships have the same output for the same input.
- In financial applications, an intersection may represent equal cost or a break-even point.
- Both slope and intercept should be considered when comparing linear relationships.
- A larger slope does not necessarily mean a function is always larger.
- Interpolation predicts within the known data range.
- Extrapolation predicts beyond the known data range.
- Extrapolated predictions are generally less reliable.
- A linear model is appropriate when the rate of change is constant or approximately constant.
- Real data do not need to lie perfectly on a straight line for a linear model to be useful.
- A curved pattern may indicate that a nonlinear model is more appropriate.
- Real-world context determines the meaningful domain of a model.
- Some variables are continuous while others are discrete.
- A mathematically correct prediction can still be physically or practically unreasonable.
- Models are simplified representations and should always be evaluated rather than accepted automatically.
Check Your Understanding
- What does the slope represent in a real-world linear model?
- What does the y-intercept usually represent?
- A rental cost is modeled by C = 7h + 15. Interpret both 7 and 15.
- Use C = 7h + 15 to predict the cost of an 8-hour rental.
- Using the same model, determine how many hours correspond to a cost of $85.
- A tank is modeled by V = −20t + 400. Interpret the slope and intercept.
- Determine when the tank in Question 6 becomes empty.
- State a reasonable domain for the model in Question 6.
- A car's position is modeled by d = 65t + 25. What does each number represent?
- A savings account follows S = 30w + 150. Predict the savings after 12 weeks.
- Plan A is C = 25 + 4x and Plan B is C = 55 + 2x. Find the value of x at which the plans cost the same.
- Determine which plan in Question 11 is cheaper before and after the intersection.
- Job A pays A = 20h and Job B pays B = 16h + 80. Determine when the earnings are equal and explain what the intersection means.
- Explain the difference between interpolation and extrapolation.
- A model is based on data collected for x-values between 5 and 20. Would a prediction at x = 12 be interpolation or extrapolation? What about x = 100?
- Explain why a perfectly constant rate of change is not always required for a linear model to be useful with real experimental data.
- The values 2, 4, 8, 16, 32 occur as x increases by 1. Explain why a linear model is not appropriate.
- A population model predicts −5,000 people far into the future. What does this suggest about the model?
- Two companies have cost models A = 6x + 40 and B = 3x + 100. Compare their initial costs and rates, find their intersection, and explain which company is cheaper on either side of the intersection.
- Choose a real-world situation that could reasonably be modeled with a linear function. Define the variables, write or propose an equation, interpret its slope and intercept, make one prediction, and explain one condition under which the model would stop being appropriate.