Arithmetic Sequences and Series
3. Graphing Arithmetic Sequences
Learning outcomes
- I can create a table of values for an arithmetic sequence.
- I can graph arithmetic sequence terms on a coordinate plane.
- I can recognize that arithmetic sequences produce linear patterns.
- I can interpret the meaning of the common difference on a graph.
- I can connect arithmetic sequences to linear relationships.
Graphing Arithmetic Sequences
Introduction
Arithmetic sequences are number patterns in which the difference between consecutive terms remains constant.
For example:
3, 7, 11, 15, 19, ...
Each term is 4 greater than the previous term.
We can represent this sequence in several ways:
-
As a list of numbers.
-
As a table of values.
-
As an nth term formula.
-
As points on a coordinate plane.
When we graph an arithmetic sequence, we discover an important mathematical relationship: the points lie on a straight line.
This happens because arithmetic sequences have a constant rate of change, just like linear functions.
However, there is an important difference. Arithmetic sequences are normally represented by separate points rather than a continuous line because term numbers are whole-number positions.
Understanding how to graph arithmetic sequences helps connect number patterns to coordinate geometry, linear equations, slope, and real-world mathematical models.


Reviewing Arithmetic Sequences
An arithmetic sequence is a sequence in which the difference between consecutive terms is constant.
Consider:
5, 8, 11, 14, 17, ...
Find the differences:
8 − 5 = 3
11 − 8 = 3
14 − 11 = 3
17 − 14 = 3
The common difference is:
d = 3
The sequence increases by 3 each time.
Important Vocabulary
-
Term: A number in a sequence.
-
Term number: The position of a term.
-
First term: The value at position n = 1.
-
Common difference: The fixed amount added to obtain the next term.
-
nth term formula: A rule for calculating the value at any term position.
The nth term formula for an arithmetic sequence is:
aₙ = a₁ + (n − 1)d
where a₁ is the first term and d is the common difference.
Creating a Table of Values
A table of values organises the positions and values of a sequence.
Consider:
4, 9, 14, 19, 24, ...
We can create the following table:
|
Term number |
Term value (aₙ) |
|---|---|
|
1 |
4 |
|
2 |
9 |
|
3 |
14 |
|
4 |
19 |
|
5 |
24 |
The first column shows the term position.
The second column shows the value at that position.
Why Are Tables Useful?
A table allows us to:
-
Organise sequence information.
-
Identify patterns.
-
Calculate coordinates for graphing.
-
Compare changes between terms.
-
Check an nth term formula.
-
Predict additional terms.
Extending the Table
Because the common difference is 5, we can continue:
|
Term number |
Term value (aₙ) |
|---|---|
|
6 |
29 |
|
7 |
34 |
|
8 |
39 |
|
9 |
44 |
|
10 |
49 |
We can now use these values to graph the sequence.
Turning a Table into Coordinates
Every row in a table of values can be written as an ordered pair.
An ordered pair has the form:
(x, y)
For arithmetic sequences:
-
x represents the term number n.
-
y represents the term value aₙ.
For the sequence:
4, 9, 14, 19, 24, ...
the coordinates are:
(1, 4)
(2, 9)
(3, 14)
(4, 19)
(5, 24)
Important Observation
The first coordinate is the term number, not the first term.
For example:
(3, 14)
means:
The third term has a value of 14.
It does not mean that the sequence begins with 3.
Graphing an Arithmetic Sequence
To graph an arithmetic sequence, plot the ordered pairs on a coordinate plane.
Worked Example
Graph:
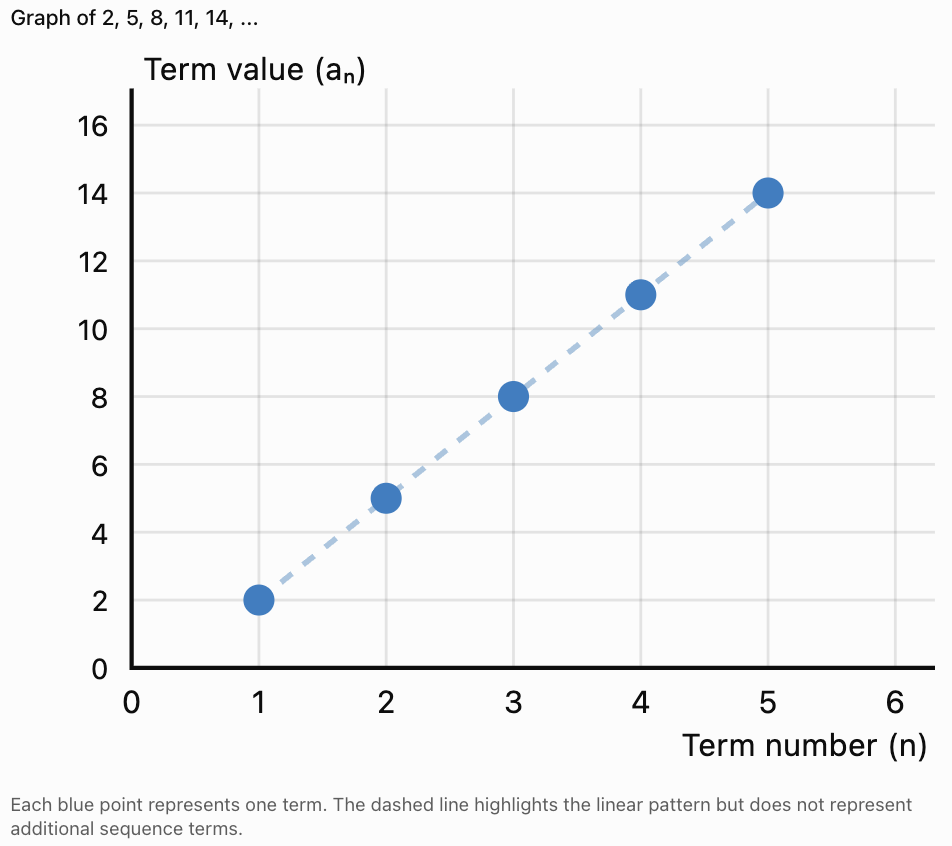
2, 5, 8, 11, 14, ...
Step 1: Create a Table
|
n |
aₙ |
|---|---|
|
1 |
2 |
|
2 |
5 |
|
3 |
8 |
|
4 |
11 |
|
5 |
14 |
Step 2: Write the Coordinates
(1, 2)
(2, 5)
(3, 8)
(4, 11)
(5, 14)
Step 3: Label the Axes
-
Horizontal axis: term number n.
-
Vertical axis: term value aₙ.
Step 4: Plot the Points
Step 5: Interpret the Graph
Notice that:
-
The points rise from left to right.
-
The points lie on a straight line.
-
Each time n increases by 1, the term value increases by 3.
-
The common difference is positive.
This is the graphical pattern of an increasing arithmetic sequence.
Why Arithmetic Sequences Form Linear Patterns
Arithmetic sequences have a constant common difference.
For example:
6, 10, 14, 18, 22, ...
The common difference is 4.
Each time the term number increases by 1, the term value increases by 4.
On the graph, this means:
Horizontal change = 1
Vertical change = 4
The ratio is:
Vertical change / Horizontal change = 4/1 = 4
This is the slope of the straight line containing the sequence points.
Connection to Linear Equations
The nth term formula is:
aₙ = a₁ + (n − 1)d
Expand:
aₙ = a₁ + dn − d
Rearrange:
aₙ = dn + (a₁ − d)
Compare this with the slope-intercept form of a linear equation:
y = mx + b
We can identify:
-
Slope m = d.
-
Vertical intercept b = a₁ − d.
Therefore, an arithmetic sequence is a linear relationship restricted to positive integer inputs.
Understanding the Common Difference as Slope
The slope describes how much a graph rises or falls as we move horizontally.
For two points:
(x₁, y₁) and (x₂, y₂)
the slope is:
m = (y₂ − y₁)/(x₂ − x₁)
Worked Example
Consider the sequence:
7, 12, 17, 22, ...
Two points are:
(1, 7) and (2, 12)
Calculate the slope:
m = (12 − 7)/(2 − 1)
m = 5/1
m = 5
This is exactly the common difference.
Another Example
Use the points:
(2, 12) and (4, 22)
m = (22 − 12)/(4 − 2)
m = 10/2
m = 5
Even when the points are not consecutive, the slope remains the same.
Key Relationship
For an arithmetic sequence, the common difference equals the slope of its underlying linear relationship.
This is one of the most important connections between sequences and graphing.
Positive Common Differences
A positive common difference produces an increasing sequence.
Example
3, 8, 13, 18, 23, ...
The common difference is:
d = 5
The nth term formula is:
aₙ = 3 + (n − 1)(5)
aₙ = 5n − 2
The points are:
(1, 3), (2, 8), (3, 13), (4, 18), (5, 23)
Graph Behaviour
-
The graph rises from left to right.
-
The slope is positive.
-
The sequence values become larger.
-
A greater positive common difference produces a steeper upward line when both axes use the same scales.

Negative Common Differences
A negative common difference produces a decreasing sequence.
Worked Example
Consider:
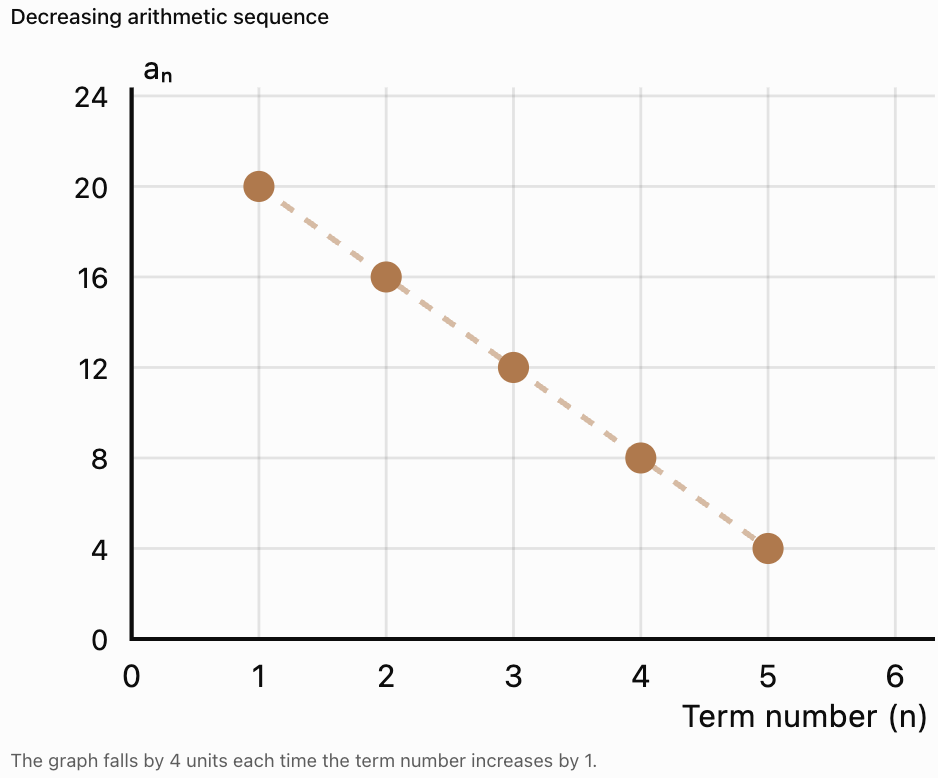
20, 16, 12, 8, 4, ...
The common difference is:
d = −4
Step 1: Create a Table
|
n |
aₙ |
|---|---|
|
1 |
20 |
|
2 |
16 |
|
3 |
12 |
|
4 |
8 |
|
5 |
4 |
Step 2: Find the nth Term Formula
aₙ = 20 + (n − 1)(−4)
aₙ = 20 − 4n + 4
aₙ = 24 − 4n
Step 3: Graph the Points
Interpretation
-
The graph falls from left to right.
-
The slope is −4.
-
Each term is 4 less than the previous term.
-
The common difference is negative.
Zero Common Difference
A sequence may have a common difference of zero.
Example
6, 6, 6, 6, 6, ...
The common difference is:
d = 0
The nth term formula is:
aₙ = 6
The points are:
(1, 6), (2, 6), (3, 6), (4, 6), (5, 6)
All points lie at the same height.
Graph Behaviour
-
The points form a horizontal pattern.
-
The slope is zero.
-
The sequence remains constant.
This is called a constant sequence.
Comparing Different Common Differences
The common difference controls the direction and steepness of the underlying linear relationship.
Consider three sequences:
|
Sequence |
nth Term Formula |
Common Difference |
|---|---|---|
|
A: 2, 4, 6, 8, ... |
aₙ = 2n |
2 |
|
B: 2, 7, 12, 17, ... |
bₙ = 5n − 3 |
5 |
|
C: 2, 0, −2, −4, ... |
cₙ = 4 − 2n |
−2 |
All three begin at 2.
However:
-
Sequence A rises by 2 each term.
-
Sequence B rises by 5 each term.
-
Sequence C falls by 2 each term.
Sequence B rises more steeply than Sequence A.
Sequence C has a negative slope.
Important Observation
Two arithmetic sequences with the same common difference have parallel underlying lines.
Two sequences with different common differences have different slopes.
Graphing from an nth Term Formula
Sometimes we are given a formula instead of a list of terms.
We can use the formula to construct a table and graph.
Worked Example
Graph the arithmetic sequence:
aₙ = 4n − 3
Step 1: Choose Term Numbers
Use:
n = 1, 2, 3, 4, 5
Step 2: Calculate Each Term
a₁ = 4(1) − 3 = 1
a₂ = 4(2) − 3 = 5
a₃ = 4(3) − 3 = 9
a₄ = 4(4) − 3 = 13
a₅ = 4(5) − 3 = 17
Step 3: Create a Table
|
n |
aₙ |
|---|---|
|
1 |
1 |
|
2 |
5 |
|
3 |
9 |
|
4 |
13 |
|
5 |
17 |
Step 4: Plot the Coordinates
(1, 1), (2, 5), (3, 9), (4, 13), (5, 17)
Step 5: Interpret
The points lie on the line:
y = 4x − 3
The slope is 4.
The common difference is also 4.
The sequence begins at n = 1, so (0, −3) is not normally included as a sequence point.
Understanding Discrete and Continuous Graphs
One of the most important differences between an arithmetic sequence and a linear function is the set of permitted inputs.
Discrete Graph
An arithmetic sequence is normally defined at positive integer positions:
n = 1, 2, 3, 4, ...
The graph contains separate points.
For example:
aₙ = 2n + 1
produces:
(1, 3), (2, 5), (3, 7), (4, 9), ...
There is no term at position n = 2.5.
Continuous Graph
A linear function such as:
y = 2x + 1
may be defined for every real x-value.
It includes points such as:
(2.5, 6)
The graph is a continuous straight line.
Discrete sequence
Only whole-number positions are included.Continuous linear function
All real inputs are included, unless restricted.Why Shouldn't We Connect Sequence Points?
Connecting the points with a solid line may suggest that positions such as 1.5 or 3.7 are valid term numbers.
For a standard arithmetic sequence, they are not.
A dashed line may be used to illustrate the underlying linear relationship, but the sequence itself consists of discrete points.
The y-Intercept and the First Term
An arithmetic sequence with formula:
aₙ = dn + c
has an underlying linear equation:
y = dx + c
The y-intercept of this line is:
(0, c)
However, the first sequence term occurs at n = 1.
Therefore:
a₁ = d + c
Worked Example
Consider:
aₙ = 3n + 4
The first term is:
a₁ = 3(1) + 4
a₁ = 7
The underlying line has y-intercept:
(0, 4)
These are not the same point.
Why Is This Important?
The y-intercept describes the value of the extended linear relationship at n = 0.
The first term describes the sequence value at n = 1.
For a sequence beginning at n = 1, the point (0, 4) is not normally part of the sequence.
Special Case
If d = 0, the first term and the line's y-intercept have the same numerical value.
Otherwise, they are different.
Finding the nth Term Formula from a Graph
We can reverse the graphing process.
Instead of using a formula to construct a graph, we can use points on a graph to determine the formula.
Worked Example
An arithmetic sequence graph contains the points:
(1, 6), (2, 10), (3, 14), (4, 18)
Find its nth term formula.
Step 1: Find the First Term
The point (1, 6) tells us:
a₁ = 6
Step 2: Find the Common Difference
From the graph, the term values increase by 4.
Therefore:
d = 4
Step 3: Substitute into the Formula
aₙ = 6 + (n − 1)(4)
Step 4: Simplify
aₙ = 6 + 4n − 4
aₙ = 4n + 2
Step 5: Verify
a₁ = 4(1) + 2 = 6
a₂ = 4(2) + 2 = 10
a₃ = 4(3) + 2 = 14
The formula matches the plotted points.
Finding the Formula Using Two Nonconsecutive Points
We do not need to know consecutive terms to determine an arithmetic sequence.
Worked Example
A sequence graph contains:
(3, 11) and (8, 31)
Find the nth term formula.
Step 1: Calculate the Slope
m = (31 − 11)/(8 − 3)
m = 20/5
m = 4
Therefore, the common difference is 4.
Step 2: Use the Linear Form
aₙ = 4n + c
Step 3: Substitute a Known Point
Use (3, 11):
11 = 4(3) + c
11 = 12 + c
c = −1
Final Formula
aₙ = 4n − 1
Verification
At n = 8:
a₈ = 4(8) − 1
= 32 − 1
= 31
The formula is correct.
General Rule
For two points (p, aₚ) and (q, aᵩ):
d = (aᵩ − aₚ)/(q − p)
The common difference is the change in term value divided by the change in term position.
Recognising Arithmetic Sequences from Graphs
A graph represents an arithmetic sequence when:
-
The term numbers are equally spaced along the horizontal axis.
-
The plotted points lie on a straight line.
-
The change in the term value is constant for each increase of 1 in term number.
Example
Suppose a graph contains:
(1, 4), (2, 7), (3, 10), (4, 13)
The differences are:
7 − 4 = 3
10 − 7 = 3
13 − 10 = 3
The points form a linear pattern.
Therefore, the sequence is arithmetic.
Non-Arithmetic Example
Now consider:
(1, 1), (2, 4), (3, 9), (4, 16)
The term values are:
1, 4, 9, 16
The differences are:
3, 5, 7
They are not constant.
The points follow a curved quadratic pattern rather than a straight-line pattern.

Important Qualification
A straight-line pattern must be interpreted using the term numbers as the horizontal coordinates.
If points are plotted using an unrelated horizontal scale, visual alignment alone may be misleading.
Comparing Two Arithmetic Sequences on a Graph
Graphing two sequences on the same coordinate plane can help us compare their values.
Consider:
Sequence A: aₙ = 2n + 5
Sequence B: bₙ = 4n − 1
Create a table:
|
n |
Sequence A |
Sequence B |
|---|---|---|
|
1 |
7 |
3 |
|
2 |
9 |
7 |
|
3 |
11 |
11 |
|
4 |
13 |
15 |
|
5 |
15 |
19 |
What Does the Table Show?
At n = 1:
Sequence A has the larger value.
At n = 3:
Both sequences have the same value.
After n = 3:
Sequence B has the larger value.
Finding the Intersection Algebraically
Set the formulas equal:
2n + 5 = 4n − 1
6 = 2n
n = 3
Substitute:
a₃ = 2(3) + 5 = 11
Therefore, the graphs share the sequence point:
(3, 11)
Interpretation
The two sequences have equal values at their third terms.
Sequence B increases faster because its common difference is 4, compared with 2 for Sequence A.
Parallel Arithmetic Sequence Graphs
Consider:
aₙ = 3n + 2
bₙ = 3n + 8
Both sequences have the same common difference:
d = 3
Therefore, their underlying lines have the same slope.
The lines are parallel.
Comparing Values
For any term position n:
bₙ − aₙ = (3n + 8) − (3n + 2)
bₙ − aₙ = 6
Sequence B is always 6 greater than Sequence A.
Important Conclusion
Arithmetic sequences with the same common difference have parallel underlying lines.
If their first terms are also equal, the sequences are identical and their graphs overlap.
Using a Graph to Predict Distant Terms
Graphs help us recognise a pattern, while the nth term formula allows us to make accurate predictions.
Worked Example
A graph contains:
(1, 8), (2, 13), (3, 18), (4, 23)
Predict the 100th term.
Step 1: Find the Common Difference
d = 13 − 8
d = 5
Step 2: Find the Formula
aₙ = 8 + (n − 1)(5)
aₙ = 5n + 3
Step 3: Calculate the 100th Term
a₁₀₀ = 5(100) + 3
a₁₀₀ = 503
Why Not Read the Value Directly from the Graph?
The graph may only display the first few terms.
Extending the graph to n = 100 could be impractical or inaccurate.
The formula provides the exact value.
Real-World Application: Stadium Seating
A stadium has 20 seats in its first row. Each new row has 4 more seats than the previous row.

The number of seats in each row forms the sequence:
20, 24, 28, 32, 36, ...
Creating a Table
|
Row number |
Seats in row |
|---|---|
|
1 |
20 |
|
2 |
24 |
|
3 |
28 |
|
4 |
32 |
|
5 |
36 |
Finding the Formula
a₁ = 20
d = 4
aₙ = 20 + (n − 1)(4)
aₙ = 4n + 16
Interpreting the Graph
-
Horizontal axis: row number.
-
Vertical axis: number of seats.
-
Each plotted point represents one row.
-
The slope is 4 seats per row.
-
The first plotted point is (1, 20).
Predicting the 30th Row
a₃₀ = 4(30) + 16
a₃₀ = 136
Therefore, the 30th row contains 136 seats.
Why Is the Graph Discrete?
A stadium has row 1, row 2, row 3, and so on.
There is no row 2.5 in this model.
Therefore, separate points are more appropriate than a continuous line.
Real-World Application: Weekly Savings
A student saves $10 during the first week and increases the amount saved each week by $5.
The weekly savings are:
10, 15, 20, 25, 30, ...
nth Term Formula
a₁ = 10
d = 5
aₙ = 10 + (n − 1)(5)
aₙ = 5n + 5
Interpreting the Graph
-
Horizontal axis: week number.
-
Vertical axis: amount saved during that week.
-
Slope: $5 per week.
-
First plotted point: (1, 10).
Finding Week 20
a₂₀ = 5(20) + 5
a₂₀ = $105
The student saves $105 during week 20.
This does not represent the total savings over 20 weeks.
Real-World Application: Decreasing Inventory
A warehouse begins with 500 boxes and ships 25 boxes at the end of each day.
The remaining inventory after each day forms the sequence:
475, 450, 425, 400, ...
nth Term Formula
a₁ = 475
d = −25
aₙ = 475 + (n − 1)(−25)
aₙ = 500 − 25n
Interpreting the Graph
-
The graph decreases from left to right.
-
The common difference is −25.
-
The slope represents a decrease of 25 boxes per day.
-
The first point is (1, 475).
When Will the Inventory Reach Zero?
Set:
500 − 25n = 0
25n = 500
n = 20
The inventory reaches zero at the end of day 20.
Model Limitation
The formula should not be used to predict negative inventory after day 20.
In this situation, the meaningful domain is restricted to the days for which the model is valid.
Common Mistakes
Switching the axes
The term number belongs on the horizontal axis. The term value belongs on the vertical axis.
Connecting the points with a solid line
Arithmetic sequences are normally discrete. A continuous line may incorrectly suggest fractional term positions.
Confusing slope and first term
The slope equals the common difference, not the first term.
Confusing the y-intercept with the first term
For aₙ = 4n + 3, the first term is 7, while the underlying line's y-intercept is 3.
Using the wrong sign for the common difference
A decreasing sequence has a negative common difference.
Assuming all increasing sequences are arithmetic
The increase must be constant.
Calculating slope without considering horizontal change
When using nonconsecutive points, divide the change in term value by the change in term position.
Assuming all points on the underlying line are sequence terms
Only points with valid integer term numbers belong to the standard sequence.
Extending real-world graphs beyond meaningful values
A mathematical formula may predict values that are not physically possible.
Key Terms
-
Arithmetic Sequence: Sequence with a constant difference between consecutive terms.
-
Term: Individual value in a sequence.
-
Term Number: Position of a term.
-
Common Difference: Fixed amount added to obtain the next term.
-
nth Term Formula: Algebraic expression used to calculate a term from its position.
-
Table of Values: Organised set of input and output values.
-
Coordinate Plane: Plane formed by horizontal and vertical axes.
-
Ordered Pair: Two coordinates written as (x, y).
-
Horizontal Axis: Axis normally representing the term number.
-
Vertical Axis: Axis normally representing the term value.
-
Linear Pattern: Relationship with a constant rate of change.
-
Slope: Ratio of vertical change to horizontal change.
-
Positive Slope: Slope indicating an increasing relationship.
-
Negative Slope: Slope indicating a decreasing relationship.
-
Zero Slope: Slope of a horizontal line.
-
Discrete Graph: Graph containing separate points at specified input values.
-
Continuous Graph: Graph defined across an interval of real inputs.
-
y-Intercept: Point where the underlying line crosses the vertical axis.
-
Parallel Lines: Lines with equal slopes that do not intersect.
-
Rate of Change: Change in output per unit change in input.
-
Linear Equation: Equation representing a constant rate of change.
-
Prediction: Calculation of an unknown value using a mathematical rule.
-
Mathematical Model: Mathematical representation of a real-world situation.
Key Takeaways
-
Arithmetic sequences can be represented using tables, graphs, and formulas.
-
A table of values pairs term positions with term values.
-
The term number is plotted on the horizontal axis.
-
The term value is plotted on the vertical axis.
-
Arithmetic sequence points lie on a straight line.
-
The common difference equals the slope of the underlying linear relationship.
-
A positive common difference produces an increasing graph.
-
A negative common difference produces a decreasing graph.
-
A zero common difference produces a horizontal pattern.
-
Arithmetic sequence graphs are normally discrete.
-
The first sequence point occurs at n = 1.
-
The y-intercept of the underlying line is not necessarily the first term.
-
The nth term formula can be found from graph coordinates.
-
Two nonconsecutive points can be used to calculate the common difference.
-
Arithmetic sequences with equal common differences have parallel underlying lines.
-
Graphs help identify trends, while formulas allow accurate distant-term predictions.
-
Real-world sequence models must be interpreted within meaningful domains.
Check Your Understanding
Tables of Values
-
Create a table for the first five terms of 3, 8, 13, 18, ...
-
Create a table for the first five terms of aₙ = 4n + 2.
-
Create a table for the first five terms of aₙ = 20 − 3n.
-
Write the ordered pairs for the sequence 6, 10, 14, 18, ...
Graphing Sequences
-
Which variable should be placed on the horizontal axis?
-
Which variable should be placed on the vertical axis?
-
Why are arithmetic sequence graphs normally discrete?
-
Describe the graph of 5, 5, 5, 5, ...
Common Difference and Slope
-
Find the common difference of 7, 12, 17, 22, ...
-
Find the slope through the points (2, 9) and (5, 21).
-
A sequence graph rises by 6 units for each increase of 1 in term number. What is its common difference?
-
A sequence has common difference −3. Describe its graph.
Connecting Sequences to Linear Equations
-
Find the nth term formula for the points (1, 4), (2, 7), (3, 10).
-
Find the nth term formula for the points (1, 15), (2, 11), (3, 7).
-
Determine the first term of aₙ = 5n + 2.
-
Determine the y-intercept of the underlying line for aₙ = 5n + 2.
Interpretation
-
Two sequences have common differences 3 and 7. Which underlying line has the greater positive slope?
-
Explain why sequences with the same common difference have parallel underlying lines.
-
A sequence graph contains (4, 18) and (9, 43). Find the nth term formula.
-
A stadium has 12 seats in its first row and adds 5 seats per row. Write the nth term formula and find the number of seats in row 20.
Answer Key
|
Question |
Answer |
|---|---|
|
1 |
(1, 3), (2, 8), (3, 13), (4, 18), (5, 23) |
|
2 |
(1, 6), (2, 10), (3, 14), (4, 18), (5, 22) |
|
3 |
(1, 17), (2, 14), (3, 11), (4, 8), (5, 5) |
|
4 |
(1, 6), (2, 10), (3, 14), (4, 18) |
|
5 |
Term number n |
|
6 |
Term value aₙ |
|
7 |
Term positions are positive integers |
|
8 |
Horizontal points at y = 5 |
|
9 |
5 |
|
10 |
4 |
|
11 |
6 |
|
12 |
Decreasing linear pattern with slope −3 |
|
13 |
aₙ = 3n + 1 |
|
14 |
aₙ = 19 − 4n |
|
15 |
7 |
|
16 |
(0, 2), on the underlying line |
|
17 |
Common difference 7 |
|
18 |
Their slopes are equal |
|
19 |
aₙ = 5n − 2 |
|
20 |
aₙ = 5n + 7; row 20 has 107 seats |
Extended Challenge
Creating Tables and Graphs
-
Create a table and graph for the first six terms of aₙ = 3n + 4.
-
Create a table and graph for the first six terms of aₙ = 25 − 4n.
-
Graph the first five terms of 8, 8, 8, 8, ...
-
Graph the first six terms of −5, −2, 1, 4, ...
-
Compare the graphs of aₙ = 2n + 1 and bₙ = 5n + 1.
Finding Formulas from Graph Data
-
Find the nth term formula for points (1, 9), (2, 15), (3, 21).
-
Find the nth term formula for points (2, 18) and (6, 34).
-
Find the nth term formula for points (3, 40) and (8, 15).
-
A sequence graph has slope 7 and first term 12. Find its formula.
-
A sequence graph has slope −5 and first term 30. Find its formula.
Comparing Sequences
-
Determine where aₙ = 3n + 8 and bₙ = 5n intersect for valid term positions.
-
Determine whether aₙ = 4n + 2 and bₙ = 4n − 5 ever have equal values.
-
Explain how changing the first term affects a sequence graph.
-
Explain how changing the common difference affects a sequence graph.
-
Determine whether the points (1, 3), (2, 6), (3, 12), (4, 24) form an arithmetic sequence.
Real-World Problems
-
A theatre has 18 seats in row 1 and adds 6 seats per row. Graph the first five rows and find the number of seats in row 25.
-
A student saves $20 in week 1 and increases weekly savings by $8. Graph the first five weeks and predict week 30.
-
A warehouse begins with 800 boxes and ships 40 each day. Graph the inventory remaining at the end of the first five days and determine when it reaches zero.
-
A tile design begins with 9 tiles and adds 4 tiles for each new design. Determine the design number containing 101 tiles.
-
Explain why a discrete sequence graph may be more appropriate than a continuous line for modelling the number of students in a classroom.
Final Challenge: Investigating Two Arithmetic Sequences
Two arithmetic sequences are defined by:
Sequence A: aₙ = 3n + 8
Sequence B: bₙ = 6n − 4
Complete the investigation.
-
Find the first term of Sequence A.
-
Find the first term of Sequence B.
-
Determine the common difference of each sequence.
-
Create a table for the first eight terms of both sequences.
-
Write the coordinates for the first five terms of each sequence.
-
Plot both sequences on the same coordinate plane.
-
Describe the slope of each underlying line.
-
Determine which sequence initially has the larger values.
-
Find the term position at which the sequences have equal values.
-
Determine the common term value at that position.
-
Identify the intersection point on the graph.
-
Determine which sequence increases faster.
-
Find the 20th term of each sequence.
-
Find the 100th term of each sequence.
-
Explain why the graphs are discrete.
-
Write the corresponding linear equations using x and y.
-
Determine the y-intercept of each underlying line.
-
Explain how the first term differs from the y-intercept.
-
Predict which sequence will have the larger values for all n > 4.
-
Explain how the table, graph, and formulas support the same conclusion.
Further Investigation: Design Your Own Sequence Graph
Create two arithmetic sequences that satisfy these conditions:
-
Both begin with positive first terms.
-
Sequence A has a positive common difference.
-
Sequence B has a negative common difference.
-
The sequences have equal values at some positive integer term position.
-
Their graphs have different slopes.
Then:
-
Write the first six terms of each sequence.
-
Create a table of values.
-
Determine each common difference.
-
Write each nth term formula.
-
Plot both sequences.
-
Identify their slopes.
-
Find the intersection algebraically.
-
Verify the intersection using the table or graph.
-
Predict the 50th term of each sequence.
-
Explain how graphing makes it easier to compare the two patterns.