Linear Relationships and Functions
5. Comparing Representations
Learning outcomes
- I can compare tables, graphs, equations, and verbal descriptions.
- I can identify equivalent representations of a relationship.
- I can move between different forms of representation.
- I can determine advantages of different representations.
- I can analyze linear relationships using multiple representations.
Comparing Representations
A mathematical relationship can often be represented in several different ways. The four most common representations are:
- tables
- graphs
- equations
- verbal descriptions
These representations may look very different, but they can describe exactly the same relationship.
For example, consider the equation:
y = 3x + 2
It tells us that the relationship has:
- a constant rate of change of 3
- a starting value of 2
The same information can be shown using a table, graph, or words.
Learning to move between these representations makes it easier to recognize patterns, compare relationships, and choose the most useful representation for a particular problem.
Four Ways to Represent a Relationship
Consider the relationship:
y = 2x + 4
Equation
y = 2x + 4
Table
| x | y |
|---|---|
| 0 | 4 |
| 1 | 6 |
| 2 | 8 |
| 3 | 10 |
| 4 | 12 |
Verbal description
"The output begins at 4 and increases by 2 for every increase of 1 in the input."
Graph
The points lie on a straight line with:
- slope = 2
- y-intercept = 4
All four representations describe the same mathematical relationship.
Equivalent Representations
Two representations are equivalent when they describe the same relationship between the variables.
For example:
Equation:
y = 5x + 3
Description:
"Start at 3 and increase by 5 for every increase of 1 in x."
These are equivalent because they have the same:
- rate of change
- starting value
- input-output relationship
How to Test for Equivalent Representations
For linear relationships, compare two important features:
Slope or rate of change
and:
y-intercept or starting value
If both are the same, the representations describe the same linear relationship.
For example:
A: y = 4x + 7
and a table:
| x | y |
|---|---|
| 0 | 7 |
| 1 | 11 |
| 2 | 15 |
| 3 | 19 |
The table has:
rate = 4
starting value = 7
Therefore, it is equivalent to:
y = 4x + 7
Tables
A table displays selected input-output pairs.
For example:
| Time |
Distance (km) |
|---|---|
| 0 | 0 |
| 1 | 60 |
| 2 | 120 |
| 3 | 180 |
| 4 | 240 |
Tables are especially useful for:
- identifying patterns
- finding exact values
- comparing inputs and outputs
- calculating rates of change
- organizing experimental or real-world data
The table shows that distance increases by:
60 km for every 1 hour
Therefore:
rate = 60 km/h
Advantages of Tables
Tables make individual values easy to locate.
If you want to know the distance after 3 hours, simply read:
180 km
Tables are also useful when the data consists of specific measured values.
However, a table normally shows only a limited number of points.
It may not show what happens between or beyond those values.
Equations
An equation gives a mathematical rule connecting the variables.
For the distance table:
d = 60t
where:
d = distance in kilometres
t = time in hours
An equation is useful because it allows us to calculate values that are not shown in the original table.
For example, after 7.5 hours:
d = 60(7.5)
d = 450 km
Advantages of Equations
Equations are especially useful for:
- calculating exact values
- making predictions
- finding unknown inputs
- finding unknown outputs
- identifying slope
- identifying intercepts
- comparing relationships algebraically
An equation can represent infinitely many input-output pairs using a compact mathematical rule.
Graphs
A graph provides a visual representation of how two variables are related.
For a linear relationship:
y = mx + b
the graph is a straight line.
Graphs make it easy to see:
- whether a relationship increases or decreases
- how quickly it changes
- where two relationships intersect
- approximate values
- trends
- intercepts
- whether a relationship is linear


Advantages of Graphs
Graphs are particularly useful for seeing the overall behaviour of a relationship.
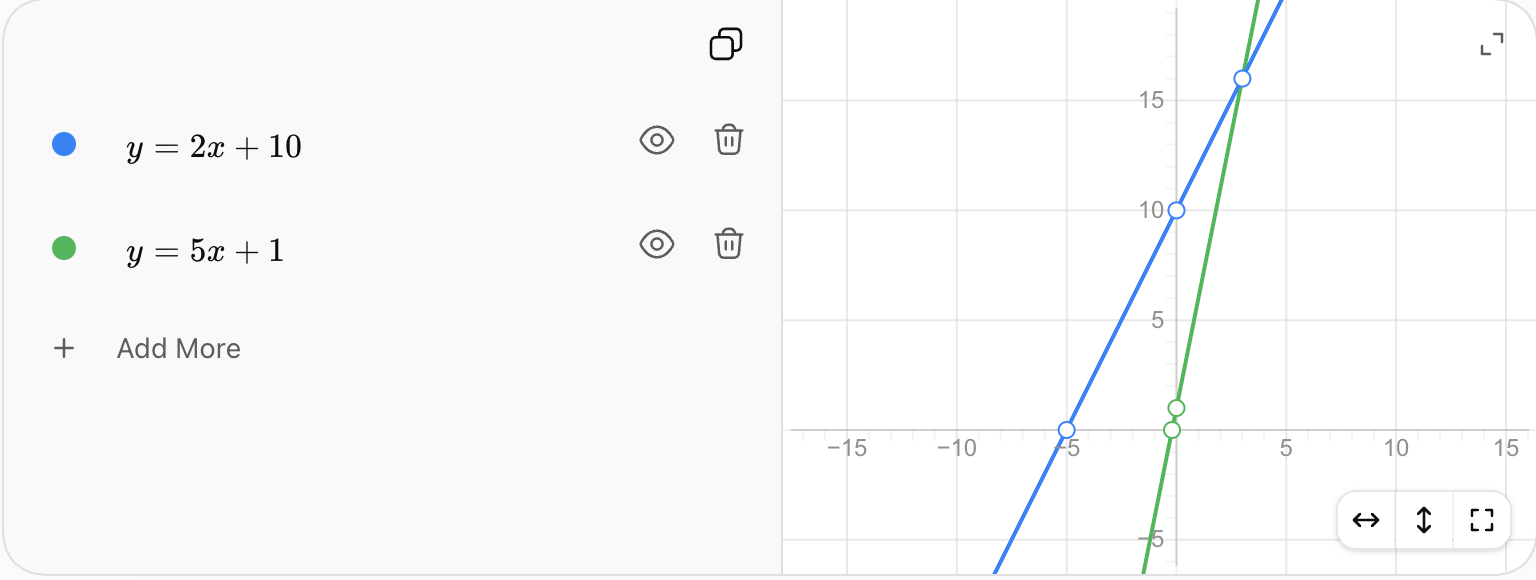
For example, compare:
y = 2x + 5
and:
y = 5x + 1
A graph quickly shows:
- which line starts higher
- which line grows faster
- where the lines intersect
- which relationship is larger in different regions
An equation provides this information too, but a graph often makes the comparison more visually obvious.
Verbal Descriptions
A verbal description explains a mathematical relationship using words.
For example:
"A taxi charges a $6 starting fee plus $3 for every kilometre travelled."
This tells us:
starting value = 6
rate = 3
Therefore:
C = 3d + 6
where:
C = cost
d = distance
Advantages of Verbal Descriptions
Verbal descriptions are especially useful for:
- explaining the meaning of variables
- providing context
- identifying units
- describing rates
- communicating what an equation represents
The equation:
C = 3d + 6
is mathematically efficient.
But the verbal description explains what the numbers 3 and 6 actually mean.
From Words to an Equation
Suppose:
"A tank begins with 200 L of water and fills at 15 L per minute."
Define:
t = time in minutes
V = volume in litres
The starting value is:
200 L
The rate of change is:
15 L/min
Therefore:
V = 15t + 200
From an Equation to Words
Consider:
P = 18h + 40
Suppose P represents pay in dollars and h represents hours worked.
The equation tells us:
- starting value = $40
- rate = $18/hour
A verbal description could be:
"A worker receives a $40 starting bonus and earns an additional $18 for each hour worked."
From an Equation to a Table
Suppose:
y = 3x − 2
Choose several x-values and calculate y.
| x | y |
|---|---|
| 0 | −2 |
| 1 | 1 |
| 2 | 4 |
| 3 | 7 |
| 4 | 10 |
For x = 2:
y = 3(2) − 2
y = 4
Each row represents a point on the graph.
From a Table to an Equation
Consider:
| x | y |
|---|---|
| 0 | 5 |
| 1 | 9 |
| 2 | 13 |
| 3 | 17 |
First find the rate.
Each increase of 1 in x produces an increase of:
4
Therefore:
m = 4
When x = 0:
y = 5
Therefore:
b = 5
The equation is:
y = 4x + 5
When x = 0 Is Not Shown
Consider:
| x | y |
|---|---|
| 2 | 11 |
| 4 | 17 |
| 6 | 23 |
| 8 | 29 |
Calculate slope:
m = (17 − 11)/(4 − 2)
m = 6/2
m = 3
Now use:
y = 3x + b
Substitute:
(2, 11)
11 = 3(2) + b
11 = 6 + b
b = 5
Therefore:
y = 3x + 5
From a Table to Words
Consider:
| Weeks | Savings ($) |
|---|---|
| 0 | 100 |
| 1 | 125 |
| 2 | 150 |
| 3 | 175 |
The starting amount is:
$100
The amount increases:
$25 each week
A verbal description is:
"The person begins with $100 and saves an additional $25 each week."
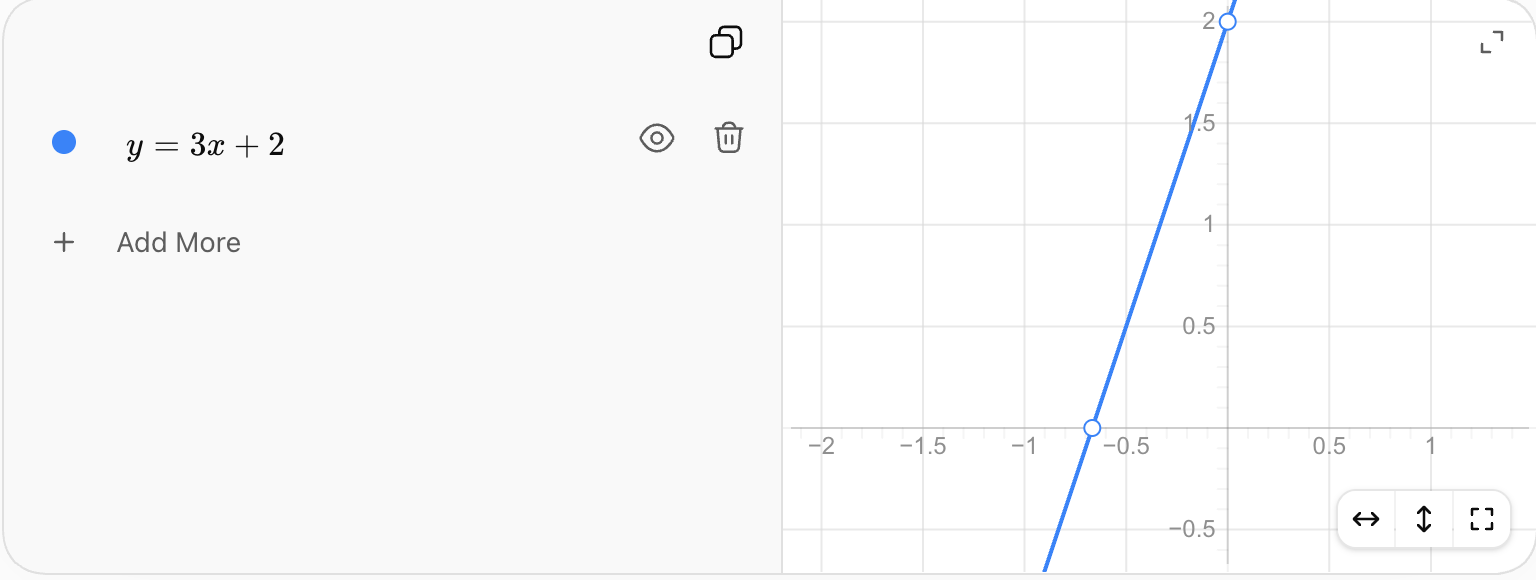
From a Table to a Graph
Every row of a table gives a coordinate pair.
Consider:
| x | y |
|---|---|
| 0 | 2 |
| 1 | 5 |
| 2 | 8 |
| 3 | 11 |
The corresponding points are:
(0, 2)
(1, 5)
(2, 8)
(3, 11)
Plotting these points produces a straight line.
The equation is:
y = 3x + 2
From a Graph to an Equation
To write an equation from a linear graph:
- identify the y-intercept
- choose two clear points
- calculate the slope
- substitute into y = mx + b
Suppose a line:
- crosses the y-axis at 4
- rises 3 units for every 1 unit to the right
Then:
m = 3
b = 4
Therefore:
y = 3x + 4
From a Graph to a Table
Suppose a graph represents:
y = 2x + 1
Read several points from the graph.
| x | y |
|---|---|
| 0 | 1 |
| 1 | 3 |
| 2 | 5 |
| 3 | 7 |
A table records selected points from the continuous relationship.
From a Graph to Words
Suppose a graph:
- crosses the y-axis at 10
- rises by 4 for every increase of 1 in x
A verbal description could be:
"The relationship begins at 10 and increases by 4 units for every 1-unit increase in the input."
If context is provided, the description should include appropriate units.
Comparing Slope Across Representations
Slope may appear differently depending on the representation.
Equation
y = 5x + 2
Slope:
5
Table
| x | y |
|---|---|
| 0 | 2 |
| 1 | 7 |
| 2 | 12 |
Rate:
+5 per +1 in x
Graph
The line rises 5 units for every 1 unit moved right.
Words
"The output increases by 5 for every additional unit of input."
All four describe:
m = 5
Comparing Intercepts Across Representations
The y-intercept also appears differently.
Equation
y = 3x + 8
Intercept:
8
Table
When x = 0:
y = 8
Graph
The line crosses the y-axis at:
(0, 8)
Words
"The initial value is 8."
Again, these are equivalent descriptions of the same feature.
Recognizing Equivalent Representations
Suppose you are given:
Equation A
y = 4x + 3
Table B
| x | y |
|---|---|
| 0 | 3 |
| 1 | 7 |
| 2 | 11 |
| 3 | 15 |
Description C
"The relationship starts at 3 and increases by 4 for every unit increase in x."
All three have:
slope = 4
intercept = 3
Therefore:
A, B, and C are equivalent representations.
Detecting Representations That Are Not Equivalent
Suppose:
Equation
y = 2x + 5
and a table:
| x | y |
|---|---|
| 0 | 5 |
| 1 | 8 |
| 2 | 11 |
| 3 | 14 |
The table has:
slope = 3
intercept = 5
The equation has:
slope = 2
intercept = 5
They share the same starting value but not the same rate of change.
Therefore:
They are not equivalent.
Comparing Linear Relationships
Consider:
Relationship A
y = 2x + 10
Relationship B
y = 5x + 1
Relationship A:
slope = 2
intercept = 10
Relationship B:
slope = 5
intercept = 1
A begins with a larger value.
B changes more quickly.
This means A may initially have the larger output, but B can eventually overtake it.
Finding Where Relationships Are Equal
Using:
A: y = 2x + 10
B: y = 5x + 1
Set the equations equal:
2x + 10 = 5x + 1
Subtract 2x:
10 = 3x + 1
Subtract 1:
9 = 3x
x = 3
Find y:
y = 2(3) + 10
y = 16
The relationships are equal at:
(3, 16)
Seeing the Same Comparison on a Graph
The equations:
y = 2x + 10
and:
y = 5x + 1
can be displayed together.