5. Comparing Representations

Learning outcomes
  • I can compare tables, graphs, equations, and verbal descriptions.
  • I can identify equivalent representations of a relationship.
  • I can move between different forms of representation.
  • I can determine advantages of different representations.
  • I can analyze linear relationships using multiple representations.

Comparing Representations

A mathematical relationship can often be represented in several different ways. The four most common representations are:

  • tables
  • graphs
  • equations
  • verbal descriptions

These representations may look very different, but they can describe exactly the same relationship.

For example, consider the equation:

y = 3x + 2

It tells us that the relationship has:

  • a constant rate of change of 3
  • a starting value of 2

The same information can be shown using a table, graph, or words.

Learning to move between these representations makes it easier to recognize patterns, compare relationships, and choose the most useful representation for a particular problem.


Four Ways to Represent a Relationship

Consider the relationship:

y = 2x + 4

Equation

y = 2x + 4

Table

x y
0 4
1 6
2 8
3 10
4 12

Verbal description

"The output begins at 4 and increases by 2 for every increase of 1 in the input."

Graph

The points lie on a straight line with:

  • slope = 2
  • y-intercept = 4

All four representations describe the same mathematical relationship.


Equivalent Representations

Two representations are equivalent when they describe the same relationship between the variables.

For example:

Equation:
y = 5x + 3

Description:
"Start at 3 and increase by 5 for every increase of 1 in x."

These are equivalent because they have the same:

  • rate of change
  • starting value
  • input-output relationship

How to Test for Equivalent Representations

For linear relationships, compare two important features:

Slope or rate of change

and:

y-intercept or starting value

If both are the same, the representations describe the same linear relationship.

For example:

A: y = 4x + 7

and a table:

x y
0 7
1 11
2 15
3 19

The table has:

rate = 4

starting value = 7

Therefore, it is equivalent to:

y = 4x + 7


Tables

A table displays selected input-output pairs.

For example:

Time cœur Distance (km)
0 0
1 60
2 120
3 180
4 240

Tables are especially useful for:

  • identifying patterns
  • finding exact values
  • comparing inputs and outputs
  • calculating rates of change
  • organizing experimental or real-world data

The table shows that distance increases by:

60 km for every 1 hour

Therefore:

rate = 60 km/h


Advantages of Tables

Tables make individual values easy to locate.

If you want to know the distance after 3 hours, simply read:

180 km

Tables are also useful when the data consists of specific measured values.

However, a table normally shows only a limited number of points.

It may not show what happens between or beyond those values.


Equations

An equation gives a mathematical rule connecting the variables.

For the distance table:

d = 60t

where:

d = distance in kilometres

t = time in hours

An equation is useful because it allows us to calculate values that are not shown in the original table.

For example, after 7.5 hours:

d = 60(7.5)

d = 450 km


Advantages of Equations

Equations are especially useful for:

  • calculating exact values
  • making predictions
  • finding unknown inputs
  • finding unknown outputs
  • identifying slope
  • identifying intercepts
  • comparing relationships algebraically

An equation can represent infinitely many input-output pairs using a compact mathematical rule.


Graphs

A graph provides a visual representation of how two variables are related.

For a linear relationship:

y = mx + b

the graph is a straight line.

Graphs make it easy to see:

  • whether a relationship increases or decreases
  • how quickly it changes
  • where two relationships intersect
  • approximate values
  • trends
  • intercepts
  • whether a relationship is linear
https://images.openai.com/static-rsc-4/dX7w4OMs8HFWkL4BKJW0UEewP3bj_Jd5hUiBlPtdmO3AG7g5wAw92IhKyVpgl-oEb6Bc6-k0Hs7O9uAn3Z6beAPv6EjwlmxhD5uCHtYSrQo7T834yToxdXbB5Y_-l1jFqNSbuX1rkJgyMcDM9K9xsK1F-tV_dFtfeoqxELv28fYZYZhWH3O9kYoLekPQGOis?purpose=fullsize
 
https://images.openai.com/static-rsc-4/JK7b8ZM_rwMZiXDFwwxtTRFC6wrwoYXJacEaBWrL9xr2ZXDvDleb9gcqNzBdVikh7Aa-pfKkaDuvOoIDyMrtQytXRfnSdno_d8FW4d0R0M1bd9X3uZYLf0TBE4hvT4gyRrp7lh4rzNpeqEN0m2jD48zhshS6Qv6q0G4I37BQz8chaxo1rZSprNT8YXSjYADd?purpose=fullsize
 
https://images.openai.com/static-rsc-4/AB5NPDQ-5z5pIHUHgH7CYK9g8UjN196C_7Tm9QIMJtnrS4P5tlXlQh5ua97Srgzf0nchYHmKxv8NDJJCt0KuiMWTP43mYaGo-Lb4Xz30QmQVyyA2b3pdifVLFuwKbfZbqdIT1QmUrkgic3aK8RIYM-vkywYKJoPIS4kWTZl-BWyIjl7-LUPMBjl3Zb4JHD2I?purpose=fullsize
 
7

Advantages of Graphs

Graphs are particularly useful for seeing the overall behaviour of a relationship.

For example, compare:

y = 2x + 5

and:

y = 5x + 1

A graph quickly shows:

  • which line starts higher
  • which line grows faster
  • where the lines intersect
  • which relationship is larger in different regions

An equation provides this information too, but a graph often makes the comparison more visually obvious.


Verbal Descriptions

A verbal description explains a mathematical relationship using words.

For example:

"A taxi charges a $6 starting fee plus $3 for every kilometre travelled."

This tells us:

starting value = 6

rate = 3

Therefore:

C = 3d + 6

where:

C = cost

d = distance


Advantages of Verbal Descriptions

Verbal descriptions are especially useful for:

  • explaining the meaning of variables
  • providing context
  • identifying units
  • describing rates
  • communicating what an equation represents

The equation:

C = 3d + 6

is mathematically efficient.

But the verbal description explains what the numbers 3 and 6 actually mean.


From Words to an Equation

Suppose:

"A tank begins with 200 L of water and fills at 15 L per minute."

Define:

t = time in minutes

V = volume in litres

The starting value is:

200 L

The rate of change is:

15 L/min

Therefore:

V = 15t + 200


From an Equation to Words

Consider:

P = 18h + 40

Suppose P represents pay in dollars and h represents hours worked.

The equation tells us:

  • starting value = $40
  • rate = $18/hour

A verbal description could be:

"A worker receives a $40 starting bonus and earns an additional $18 for each hour worked."


From an Equation to a Table

Suppose:

y = 3x − 2

Choose several x-values and calculate y.

x y
0 −2
1 1
2 4
3 7
4 10

For x = 2:

y = 3(2) − 2

y = 4

Each row represents a point on the graph.


From a Table to an Equation

Consider:

x y
0 5
1 9
2 13
3 17

First find the rate.

Each increase of 1 in x produces an increase of:

4

Therefore:

m = 4

When x = 0:

y = 5

Therefore:

b = 5

The equation is:

y = 4x + 5


When x = 0 Is Not Shown

Consider:

x y
2 11
4 17
6 23
8 29

Calculate slope:

m = (17 − 11)/(4 − 2)

m = 6/2

m = 3

Now use:

y = 3x + b

Substitute:

(2, 11)

11 = 3(2) + b

11 = 6 + b

b = 5

Therefore:

y = 3x + 5


From a Table to Words

Consider:

Weeks Savings ($)
0 100
1 125
2 150
3 175

The starting amount is:

$100

The amount increases:

$25 each week

A verbal description is:

"The person begins with $100 and saves an additional $25 each week."


From a Table to a Graph

Every row of a table gives a coordinate pair.

Consider:

x y
0 2
1 5
2 8
3 11

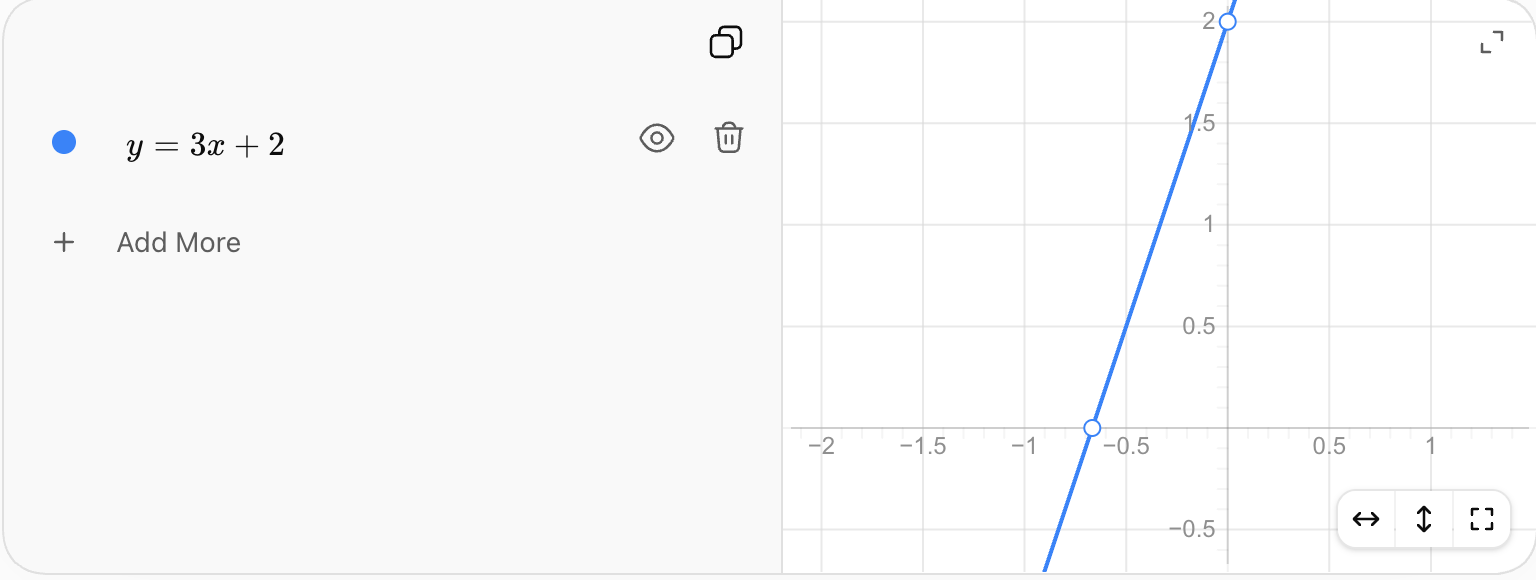
The corresponding points are:

(0, 2)

(1, 5)

(2, 8)

(3, 11)

Plotting these points produces a straight line.

The equation is:

y = 3x + 2
From a Graph to an Equation

To write an equation from a linear graph:

  1. identify the y-intercept
  2. choose two clear points
  3. calculate the slope
  4. substitute into y = mx + b

Suppose a line:

  • crosses the y-axis at 4
  • rises 3 units for every 1 unit to the right

Then:

m = 3

b = 4

Therefore:

y = 3x + 4


From a Graph to a Table

Suppose a graph represents:

y = 2x + 1

Read several points from the graph.

x y
0 1
1 3
2 5
3 7

A table records selected points from the continuous relationship.


From a Graph to Words

Suppose a graph:

  • crosses the y-axis at 10
  • rises by 4 for every increase of 1 in x

A verbal description could be:

"The relationship begins at 10 and increases by 4 units for every 1-unit increase in the input."

If context is provided, the description should include appropriate units.


Comparing Slope Across Representations

Slope may appear differently depending on the representation.

Equation

y = 5x + 2

Slope:

5

Table

x y
0 2
1 7
2 12

Rate:

+5 per +1 in x

Graph

The line rises 5 units for every 1 unit moved right.

Words

"The output increases by 5 for every additional unit of input."

All four describe:

m = 5


Comparing Intercepts Across Representations

The y-intercept also appears differently.

Equation

y = 3x + 8

Intercept:

8

Table

When x = 0:

y = 8

Graph

The line crosses the y-axis at:

(0, 8)

Words

"The initial value is 8."

Again, these are equivalent descriptions of the same feature.


Recognizing Equivalent Representations

Suppose you are given:

Equation A

y = 4x + 3

Table B

x y
0 3
1 7
2 11
3 15

Description C

"The relationship starts at 3 and increases by 4 for every unit increase in x."

All three have:

slope = 4

intercept = 3

Therefore:

A, B, and C are equivalent representations.


Detecting Representations That Are Not Equivalent

Suppose:

Equation

y = 2x + 5

and a table:

x y
0 5
1 8
2 11
3 14

The table has:

slope = 3

intercept = 5

The equation has:

slope = 2

intercept = 5

They share the same starting value but not the same rate of change.

Therefore:

They are not equivalent.


Comparing Linear Relationships

Consider:

Relationship A

y = 2x + 10

Relationship B

y = 5x + 1

Relationship A:

slope = 2

intercept = 10

Relationship B:

slope = 5

intercept = 1

A begins with a larger value.

B changes more quickly.

This means A may initially have the larger output, but B can eventually overtake it.


Finding Where Relationships Are Equal

Using:

A: y = 2x + 10

B: y = 5x + 1

Set the equations equal:

2x + 10 = 5x + 1

Subtract 2x:

10 = 3x + 1

Subtract 1:

9 = 3x

x = 3

Find y:

y = 2(3) + 10

y = 16

The relationships are equal at:

(3, 16)


Seeing the Same Comparison on a Graph

The equations:

y = 2x + 10

and:

y = 5x + 1

can be displayed together.
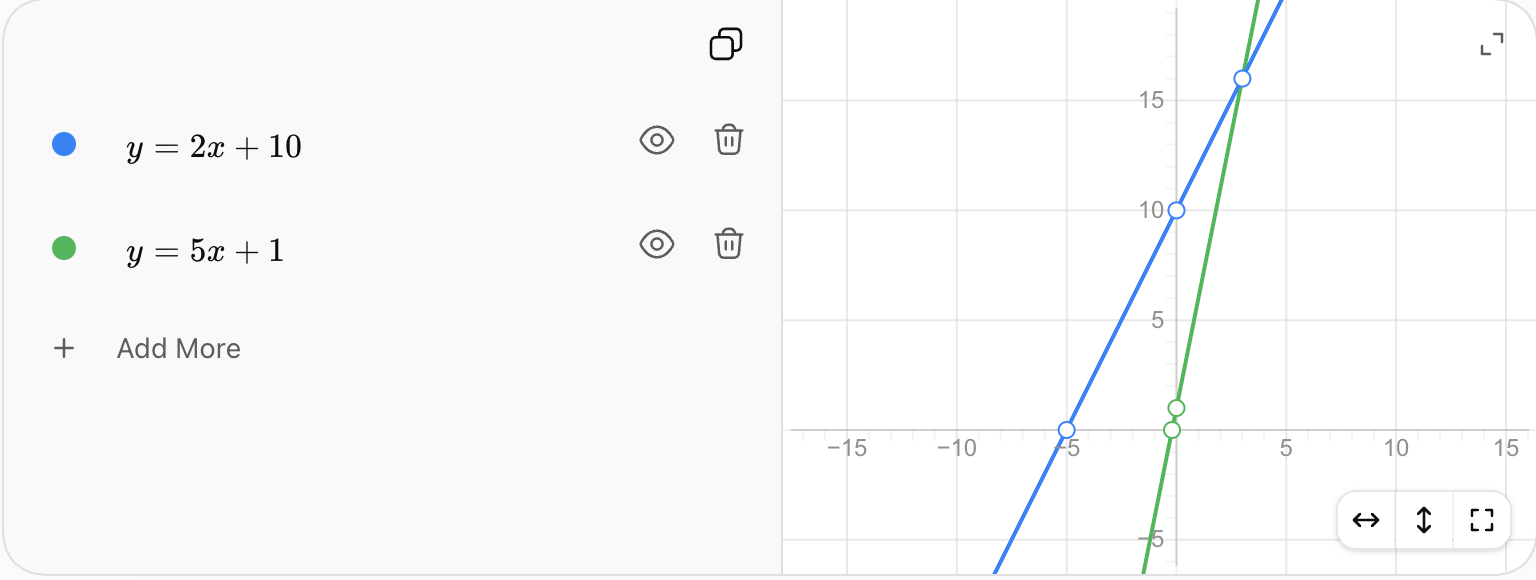
The graph visually shows that:

  • the first relationship starts higher
  • the second has a steeper slope
  • the two relationships eventually meet and then change order

This demonstrates why graphs are useful for comparisons.


Comparing a Table with an Equation

Suppose Plan A is:

A = 4x + 12

Plan B is represented by:

x B
0 5
1 11
2 17
3 23

From the table:

slope = 6

intercept = 5

Therefore:

B = 6x + 5

Now comparison is easier.

Plan A:

m = 4, b = 12

Plan B:

m = 6, b = 5

Plan A starts higher.

Plan B increases faster.


Comparing an Equation with Words

Suppose:

Plan A: C = 8h + 20

Plan B is described as:

"A $10 starting fee plus $12 per hour."

Translate Plan B:

C = 12h + 10

Now compare:

Plan A:

rate = $8/hour

starting fee = $20

Plan B:

rate = $12/hour

starting fee = $10

The equation form makes the mathematical comparison easier.


Comparing Two Tables

Relationship A

x y
0 10
1 13
2 16
3 19

Relationship B

x y
0 2
1 7
2 12
3 17

Relationship A:

m = 3

b = 10

Relationship B:

m = 5

b = 2

Therefore:

  • A has the larger starting value
  • B has the larger rate of change

Using a Common Representation

When comparing relationships shown in different forms, it is often helpful to convert them to a common representation.

For example:

  • convert both to equations
  • convert both to tables
  • graph both relationships together

Equations are especially efficient for comparing slope and intercept.

Graphs are especially effective for comparing overall behaviour and intersections.


Comparing Direct Variation Representations

Recall that direct variation has the form:

y = kx

Suppose a table shows:

x y
1 4
2 8
3 12
4 16

The constant ratio is:

y/x = 4

Therefore:

y = 4x

A verbal description might be:

"The output is four times the input."

A graph would be a straight line through:

(0, 0)

with slope 4.

All representations describe the same proportional relationship.


Distinguishing Proportional and Non-Proportional Linear Relationships

Compare:

A: y = 4x

and:

B: y = 4x + 6

Both are linear.

Both have slope:

4

But only A is proportional.

Why?

A has:

b = 0

and passes through:

(0, 0)

B has:

b = 6

and does not pass through the origin.

Representations can help reveal this distinction.


Real-World Example: Two Taxi Companies

Taxi A charges:

$5 starting fee + $3/km

Therefore:

A = 3d + 5

Taxi B charges:

$9 starting fee + $2/km

Therefore:

B = 2d + 9

Taxi A:

slope = 3

intercept = 5

Taxi B:

slope = 2

intercept = 9

Taxi A starts cheaper but increases more quickly.

Taxi B starts more expensive but increases more slowly.


Finding the Break-Even Distance

Set the taxi costs equal:

3d + 5 = 2d + 9

Subtract 2d:

d + 5 = 9

d = 4

At 4 km:

A = 3(4) + 5 = 17

B = 2(4) + 9 = 17

Therefore, both taxis cost:

$17 at 4 km

For shorter journeys, Taxi A is cheaper.

For longer journeys, Taxi B is cheaper.


Real-World Example: Savings Plans

Plan A begins with:

$200

and adds:

$25/week

Equation:

A = 25w + 200

Plan B begins with:

$80

and adds:

$40/week

Equation:

B = 40w + 80

Plan A has the greater starting value.

Plan B has the greater rate of change.

Different representations can help answer different questions about these plans.


Which Representation Is Best?

There is no single representation that is always best.

The most useful representation depends on what you want to know.

Representation Particularly Useful For
Table exact listed values and patterns
Graph visual trends, comparisons, intersections
Equation calculations, predictions, algebra
Words context, meaning, and units

Strong mathematical reasoning involves choosing the representation that best suits the problem.


When a Table Is Most Useful

Suppose a scientist records temperature every hour.

A table is useful because it preserves the exact measured values.

It allows the scientist to:

  • organize observations
  • compare specific measurements
  • identify possible patterns

However, a table may not make the overall trend as obvious as a graph.


When a Graph Is Most Useful

Suppose you want to compare two savings plans over 20 weeks.

A graph quickly reveals:

  • which starts higher
  • which grows faster
  • when one overtakes the other

This information may be less immediately obvious from a long table.

https://images.openai.com/static-rsc-4/h-o6P3kOUtbeWAAS-4c197aLXvBNyTBYTGjN29-w4xN0VRBHfMG4s3bbuPeWR1txLHnT8iEwP8RIoa7a-4HFrk75RNr3Kw4DcuEu53PnEq41U9KM6evZ7B2C7XdiVE-mVNFlCm6_e5pY32VFvOVcot3vZhQ-Di7W_QeLK8rrd9t2H8ZPH2G9pt-FALsr7phI?purpose=fullsize
 
https://images.openai.com/static-rsc-4/vC6RDfa05bvQFx97coUONWKP7ozkL385yHc4b03IX0iQD3wb55fiI4DOhUZrtVWqaHBTvslijKMb-I21hakcGFDn7IIVxqr9ZBiw6RsBaa0QNz_Ex2dFZBdGzX_3WaaYGKX5n3IqJQ8YLtNaht4G0yvvHPA2JhfGh2J7E7Fjeu5O4IrrlmC2Tl61D0M7CPCi?purpose=fullsize
 
https://images.openai.com/static-rsc-4/GdxHzobAXmQTqu9vFZdc40sOn79Hd4Nr9Xmuu0nO8lIqbtjyUSGA4DoqN9GjYGiW6pNQna1o3MIIThkH_fxkj1FF06Kg6cZRRj7s0MCkB2_rQVHP4VTvHjdRHDdu_T0QNTtYXhumG2nKm5AO7cQsb0AP4KCs9FtaRPdWhd7tkV-r6os0lndJ4EPFNiJmNpz2?purpose=fullsize
 
10

When an Equation Is Most Useful

Suppose you need the exact cost of a 37 km journey.

If:

C = 2.5d + 6

then:

C = 2.5(37) + 6

C = 92.5 + 6

C = $98.50

An equation allows exact calculation without needing a table containing d = 37.


When Words Are Most Useful

Consider:

y = −5x + 100

Without context, we know its mathematical structure but not what it represents.

Now suppose we are told:

"A tank initially contains 100 L and drains at 5 L per minute."

The verbal description gives meaning to:

−5 → water decreases by 5 L/min

100 → initial volume

Words provide the context that the equation alone cannot.


Strengths and Limitations of Tables

Strengths

  • organized
  • easy to read
  • shows exact listed values
  • useful for recognizing patterns
  • useful for recorded data

Limitations

  • shows only selected values
  • may become very long
  • trends may be difficult to see
  • values between rows may not be obvious

Strengths and Limitations of Graphs

Strengths

  • shows overall behaviour
  • makes trends visible
  • makes comparisons easier
  • shows intersections visually
  • shows increasing and decreasing behaviour

Limitations

  • exact values may be difficult to read
  • accuracy depends on scale
  • poor graph scales can be misleading

Strengths and Limitations of Equations

Strengths

  • compact
  • precise
  • allows exact calculations
  • useful for predictions
  • clearly shows mathematical structure

Limitations

  • may not immediately show overall behaviour to a beginner
  • may not explain the real-world meaning
  • requires algebraic understanding

Strengths and Limitations of Verbal Descriptions

Strengths

  • provides context
  • explains units
  • explains meaning
  • connects mathematics to real situations

Limitations

  • can be longer than an equation
  • mathematical structure may be less obvious
  • wording can sometimes be ambiguous

Checking Whether Representations Agree

Suppose an equation is:

y = 6x − 2

and a table claims to represent it:

x y
0 −2
1 4
2 10
3 16

Check:

x = 0:

6(0) − 2 = −2

x = 1:

6(1) − 2 = 4

x = 2:

6(2) − 2 = 10

The values agree.

Therefore, the representations are equivalent.


Finding an Error Between Representations

Suppose:

y = 5x + 3

and a table shows:

x y
0 3
1 8
2 13
3 19

Check x = 3:

5(3) + 3 = 18

But the table says:

19

Therefore, the final row does not match the equation.

Comparing representations is a useful way to detect errors.


Analyzing Rate of Change Across Representations

Suppose three relationships are given.

A

y = 4x + 2

B

"The value begins at 10 and increases by 6 for every unit of x."

C

x y
0 3
2 13
4 23
6 33

Rates:

A:

4

B:

6

C:

m = (13 − 3)/(2 − 0)

m = 10/2

5

Therefore, from greatest to least rate:

B, C, A


Analyzing Starting Values Across Representations

Using the same relationships:

A:

b = 2

B:

starting value = 10

C:

when x = 0:

y = 3

Therefore, from greatest to least starting value:

B, C, A

The representation changes, but the mathematical features can still be compared.


Representations Can Reveal Different Features

Consider:

y = −2x + 12

The equation immediately reveals:

slope = −2

intercept = 12

A table makes specific values easy to read.

A graph makes the decreasing trend obvious.

A verbal description can explain what −2 and 12 mean in context.

The representations are not competing versions of the mathematics. They are different ways of viewing the same relationship.


A Reliable Strategy for Comparing Representations

When comparing tables, graphs, equations, and descriptions:

  1. Identify the variables.
  2. Determine whether the relationship is linear.
  3. Find the rate of change.
  4. Find the starting value or y-intercept.
  5. Record the units if the situation has context.
  6. Convert representations if necessary.
  7. Compare slopes.
  8. Compare intercepts.
  9. Check whether the representations produce the same input-output pairs.
  10. Decide whether they are equivalent.
  11. Choose the representation best suited to the question.
  12. Explain what the mathematical features mean in context.

Common Mistakes

Assuming different-looking representations describe different relationships

A table, equation, graph, and description may all represent exactly the same relationship.

Comparing only one point

Two different lines can share one point. Equivalent linear relationships must have the same slope and intercept.

Comparing only the intercept

Two relationships can start at the same value but change at different rates.

Comparing only the slope

Two parallel relationships can have the same slope but different intercepts.

Using Δy without considering Δx

Rate of change is:

Δy/Δx

Confusing a larger intercept with a larger rate

The intercept describes the starting value. The slope describes how quickly the relationship changes.

Assuming the graph is always the most accurate representation

Graphs are excellent for visualization, but equations and tables may provide more precise numerical values.

Ignoring units

A rate of 5 could mean $5/hour, 5 km/s, or 5 L/min.

Assuming every straight line represents direct variation

A direct variation must also pass through the origin.

Failing to check converted representations

After converting a table or description to an equation, substitute values to verify the result.


Key Terms

Representation — way of showing or communicating a mathematical relationship.

Table — organized display of input-output values.

Graph — visual representation of the relationship between variables.

Equation — mathematical statement describing a relationship between quantities.

Verbal description — explanation of a mathematical relationship using words.

Equivalent representations — different representations describing the same mathematical relationship.

Slope — rate of change of a linear relationship.

Rate of change — change in one variable compared with the change in another.

y-intercept — value of y when x = 0.

Starting value — initial value of the dependent variable.

Linear relationship — relationship with a constant rate of change.

Direct variation — proportional linear relationship of the form y = kx.

Input — independent variable value.

Output — dependent variable value.

Intersection — point where two graphs meet and therefore have the same input and output values.

Conversion — process of changing one representation into another while preserving the same relationship.


Key Takeaways

  • Mathematical relationships can be represented using tables, graphs, equations, and words.
  • Different representations can describe exactly the same relationship.
  • Equivalent linear representations have the same slope and y-intercept.
  • Tables are useful for displaying exact selected values and identifying patterns.
  • Graphs are useful for visualizing trends, rates, and intersections.
  • Equations are useful for exact calculations, predictions, and algebraic analysis.
  • Verbal descriptions provide context, meaning, and units.
  • Linear equations can be written in the form y = mx + b.
  • The slope m appears as a constant rate in tables, steepness on graphs, a coefficient in equations, and a rate in verbal descriptions.
  • The y-intercept b appears as the value when x = 0, the point where a graph crosses the y-axis, the constant term in an equation, and the starting value in words.
  • Converting relationships to a common representation can make comparisons easier.
  • A relationship with a greater starting value does not necessarily have a greater rate of change.
  • A relationship with a greater rate of change may eventually overtake one that starts higher.
  • Intersections represent values for which two relationships have the same output.
  • Comparing representations can help detect errors.
  • A graph may make behaviour easier to see, while an equation may provide greater numerical precision.
  • The best representation depends on the question being investigated.
  • Strong mathematical reasoning involves being able to move flexibly between different representations.

Check Your Understanding

  1. Describe one advantage of representing a relationship using a table, a graph, an equation, and a verbal description.
  2. Write a table containing x = 0, 1, 2, 3, and 4 for:

y = 3x + 5

  1. Write a verbal description of:

y = 4x + 7

that clearly identifies the starting value and rate of change.

  1. Write an equation for the table:
x y
0 6
1 10
2 14
3 18
  1. Determine whether the equation y = 5x + 2 is equivalent to the table:
x y
0 2
1 7
2 12
3 17

Explain how you know.

  1. A relationship is described as: "The value begins at 12 and decreases by 3 for every increase of 1 in x." Write its equation and create a table for x = 0 through x = 4.
  2. Compare y = 2x + 15 and y = 6x + 3. Which has the greater starting value? Which has the greater rate of change?
  3. Relationship A is y = 4x + 8. Relationship B is represented by:
x y
0 2
1 7
2 12
3 17

Write an equation for Relationship B and compare the slopes and intercepts of the two relationships.

  1. A taxi company charges a $7 starting fee plus $3 per kilometre. Represent this relationship using words, an equation, and a table for journeys of 0, 1, 2, 3, and 4 km.
  2. A savings account begins with $150 and increases by $25 each week. Write an equation, construct a table for the first five weeks, and explain how the slope and intercept appear in each representation.
  3. Relationship A is represented by y = 3x + 10. Relationship B begins at 4 and increases by 5 for every unit of x. Determine where the two relationships have the same value.
  4. A student claims that two linear relationships are equivalent because both have a slope of 6. Explain why this information alone is not enough. What else must be compared?
  5. A table shows the points (0, 4), (2, 10), (4, 16), and (6, 22). Determine the equation, describe the relationship in words, and explain what its graph would look like.
  6. Two phone plans are represented differently. Plan A is C = 5g + 20. Plan B has a $35 starting charge and costs an additional $3 per GB. Write both plans as equations, compare their starting costs and rates, and determine the amount of data for which they cost the same.
  7. A tank initially contains 500 L and loses 20 L per minute. Represent the situation with an equation, a verbal description, and a table for the first five minutes. Explain what its graph would show, identify the slope and intercept in each representation, and discuss which representation would be most useful for determining exactly when the tank reaches 100 L.