Linear Relationships and Functions
2. Functions and Function Notation
Learning outcomes
- I can define a function as a relationship between inputs and outputs.
- I can identify whether a relation is a function.
- I can evaluate functions using function notation.
- I can interpret function values in context.
- I can represent functions using tables, graphs, and equations.
Functions and Function Notation
A function is a relationship between inputs and outputs in which each input has exactly one output.
Think of a function as a machine:
input → function rule → output
For example, suppose the rule is:
y = 2x + 3
If the input is x = 4:
y = 2(4) + 3
y = 11
So:
input 4 → output 11
The most important rule is:
One input cannot produce two different outputs if the relationship is a function.
Inputs and Outputs
A function connects two quantities.
The input is the value entered into the function.
The output is the value produced.
For:
y = 3x + 5
x is the input.
y is the output.
If x = 2:
y = 3(2) + 5
y = 11
Therefore:
2 → 11
Independent and Dependent Variables
The input is often called the independent variable.
The output is often called the dependent variable because its value depends on the input.
Consider:
C = 4h + 10
where:
h = hours
C = cost
The number of hours is the input.
The cost is the output.
Changing h causes C to change.
What Makes a Relation a Function?
A relation is any collection of input-output pairs.
For example:
(1, 5), (2, 7), (3, 9), (4, 11)
Each input appears with exactly one output.
Therefore, this relation is a function.
Now consider:
(1, 5), (2, 7), (2, 10), (3, 12)
Input 2 has two outputs:
2 → 7
and:
2 → 10
Therefore, this relation is not a function.
Repeated Outputs Are Allowed
A common misunderstanding is that outputs cannot repeat.
They can.
Consider:
(1, 5), (2, 5), (3, 7), (4, 7)
Different inputs produce the same outputs.
That is allowed.
Each input still has only one output.
Therefore:
This relation is a function.
The rule applies to repeated inputs, not repeated outputs.
Repeated Inputs
Consider:
(1, 4), (2, 6), (2, 6), (3, 8)
The repeated input 2 still produces the same output, 6.
This does not create two different outputs.
The relationship can still represent a function.
The problem occurs when one input is connected to different outputs.
Functions in Tables
Consider:
| Input x | Output y |
|---|---|
| 1 | 4 |
| 2 | 7 |
| 3 | 10 |
| 4 | 13 |
Every input has exactly one output.
Therefore, the table represents a function.
A Table That Is Not a Function
Consider:
| Input x | Output y |
|---|---|
| 1 | 5 |
| 2 | 8 |
| 2 | 11 |
| 3 | 14 |
Input 2 produces:
8 and 11.
Therefore:
This relation is not a function.
Mapping Diagrams
Functions can also be represented using mapping diagrams.
A mapping diagram shows arrows connecting inputs to outputs.
For example:
1 → 4
2 → 6
3 → 8
4 → 10
Every input has one arrow leading to one output.
Therefore, the relation is a function.


Identifying Functions from Mapping Diagrams
Suppose:
1 → 5
2 → 6
3 → 6
4 → 8
This is a function.
Although inputs 2 and 3 share the same output, each input still has only one output.
Now suppose:
1 → 5
2 → 6
2 → 9
3 → 10
This is not a function because input 2 produces two different outputs.
Function Notation
Instead of writing:
y = 2x + 3
we can write:
f(x) = 2x + 3
This is called function notation.
The expression:
f(x)
is read:
"f of x"
It does not mean:
f × x
Instead, f(x) represents the output of function f when the input is x.
Understanding f(x)
If:
f(x) = 3x + 4
then:
f(2)
means:
the output when the input is 2
Substitute 2 for x:
f(2) = 3(2) + 4
f(2) = 6 + 4
f(2) = 10
Evaluating a Function
Suppose:
f(x) = 5x − 2
Find:
f(4)
Replace every x with 4:
f(4) = 5(4) − 2
f(4) = 20 − 2
f(4) = 18
Therefore, input 4 produces output 18.
Evaluating a Function at Zero
Suppose:
f(x) = 4x + 7
Find:
f(0)
Substitute 0:
f(0) = 4(0) + 7
f(0) = 7
For a linear function, f(0) often represents the starting value.
Evaluating Functions at Negative Values
Suppose:
f(x) = 3x + 8
Find:
f(−2)
Substitute −2:
f(−2) = 3(−2) + 8
f(−2) = −6 + 8
f(−2) = 2
Use parentheses around negative inputs to reduce sign errors.
Evaluating Functions with Exponents
Functions do not have to be linear.
Suppose:
g(x) = x² + 2
Find:
g(3)
g(3) = 3² + 2
g(3) = 9 + 2
g(3) = 11
Now find:
g(−3)
g(−3) = (−3)² + 2
g(−3) = 9 + 2
g(−3) = 11
Different inputs can produce the same output and the relation can still be a function.
Why Parentheses Matter
Suppose:
f(x) = x² − 4x
Find:
f(−2)
Substitute carefully:
f(−2) = (−2)² − 4(−2)
f(−2) = 4 + 8
f(−2) = 12
Writing negative inputs inside parentheses helps preserve the correct signs.
Evaluating Decimal Inputs
Suppose:
f(x) = 2x + 5
Find:
f(1.5)
f(1.5) = 2(1.5) + 5
f(1.5) = 3 + 5
f(1.5) = 8
Function inputs do not have to be whole numbers unless the context restricts them.
Evaluating Fraction Inputs
Suppose:
f(x) = 6x + 1
Find:
f(1/2)
f(1/2) = 6(1/2) + 1
f(1/2) = 3 + 1
f(1/2) = 4
Functions as Machines
A useful mental model is a function machine.
For:
f(x) = 2x + 1
the machine:
- takes an input
- multiplies it by 2
- adds 1
- produces an output
For example:
3 → multiply by 2 → 6 → add 1 → 7
Therefore:
f(3) = 7


Building a Function Table
Suppose:
f(x) = 2x + 3
We can evaluate several inputs.
| x | f(x) |
|---|---|
| −2 | −1 |
| −1 | 1 |
| 0 | 3 |
| 1 | 5 |
| 2 | 7 |
The table represents the same function as the equation.
Moving from a Table to an Equation
Consider:
| x | f(x) |
|---|---|
| 0 | 4 |
| 1 | 7 |
| 2 | 10 |
| 3 | 13 |
The output increases by:
3
for every increase of 1 in x.
Therefore, the rate of change is:
3
At x = 0:
f(0) = 4
So the function rule is:
f(x) = 3x + 4
Function Values from Tables
Suppose:
| x | f(x) |
|---|---|
| −2 | 7 |
| −1 | 4 |
| 0 | 1 |
| 1 | −2 |
| 2 | −5 |
To find:
f(1)
look for the row where x = 1.
The output is:
−2
Therefore:
f(1) = −2
Finding an Input from a Function Table
Using the same table, suppose we ask:
For what value of x is f(x) = 7?
Find 7 in the output column.
It corresponds to:
x = −2
This is different from being asked to find f(−2).
Function notation requires careful reading.
Evaluating Functions from Graphs
A graph can also represent a function.
To find:
f(2)
from a graph:
- locate x = 2 on the horizontal axis
- move vertically until you reach the graph
- read the corresponding y-value
That y-value is:
f(2)


A Function Graph
Consider:
f(x) = 2x + 1
The graph represents every input-output pair satisfying the function.
For example:
f(0) = 1
f(1) = 3
f(2) = 5
f(3) = 7
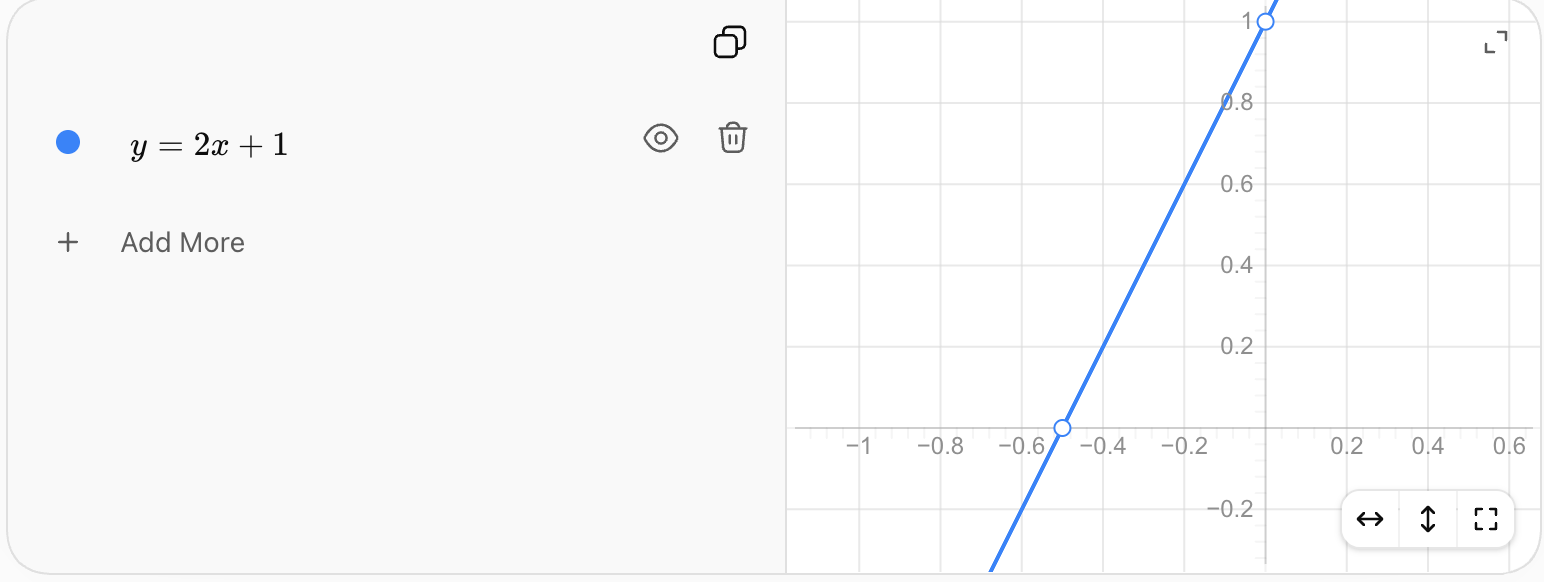
Each x-coordinate has exactly one corresponding y-coordinate.
The Vertical Line Test
A graph represents a function if every input x has no more than one output y.
The vertical line test provides a quick graphical method.
Imagine drawing vertical lines through the graph.
If any vertical line intersects the graph more than once:
the graph is not a function.
If every vertical line intersects at most once:
the graph is a function.
Why the Vertical Line Test Works
A vertical line represents one particular x-value.
If it crosses the graph twice, that same x-value has two different y-values.
That violates the definition of a function.
Therefore:
More than one intersection with a vertical line → not a function.
Function vs Non-Function Graphs
A typical straight line such as:
y = 2x + 3
is a function.
A parabola such as:
y = x²
is also a function.
For each x-value, there is exactly one y-value.
A circle such as:
x² + y² = 25
is not y as a function of x over the entire circle because many x-values correspond to two y-values.


A Non-Linear Function
A function does not need to be linear.
For example:
f(x) = x²
is a function.
Its graph is curved rather than straight.
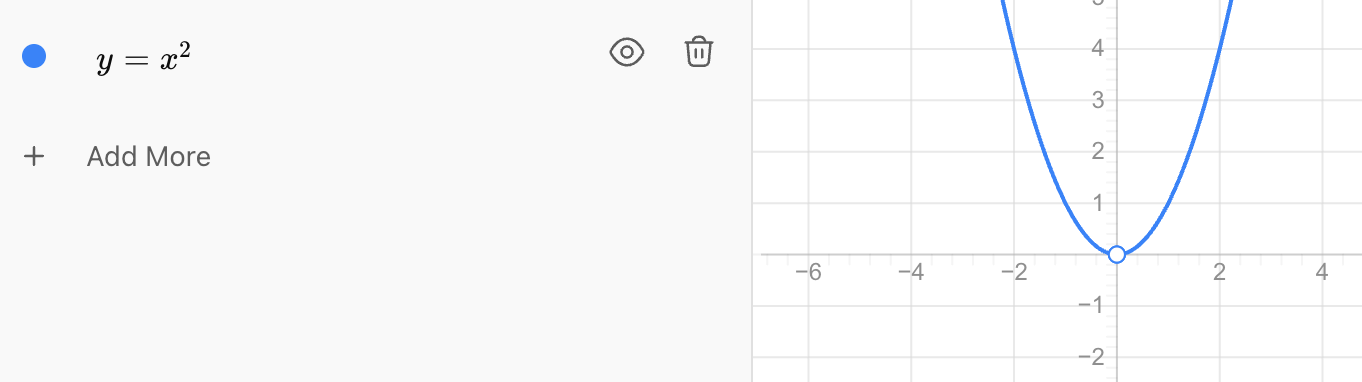
For every input x, there is exactly one output.
For example:
f(2) = 4
and:
f(−2) = 4
Two inputs producing the same output is allowed.
Relations That Are Not Functions
Consider:
x² + y² = 9
This represents a circle.
For x = 0:
y could be:
3
or:
−3
Therefore, the same input x = 0 has two outputs.
So the complete circle is not a function of x.
Domain
The domain is the set of allowed input values.
For example, suppose a function is represented by:
(1, 5), (2, 7), (3, 9), (4, 11)
The domain is:
{1, 2, 3, 4}
These are all the input values.
Range
The range is the set of output values.
For:
(1, 5), (2, 7), (3, 9), (4, 11)
the range is:
{5, 7, 9, 11}
So:
domain = inputs
range = outputs
Repeated Values in the Range
Consider:
(1, 4), (2, 6), (3, 6), (4, 8)
Domain:
{1, 2, 3, 4}
Range:
{4, 6, 8}
The number 6 only needs to be listed once in the range because a set does not repeat elements.
Domain Restrictions
Not every function allows every possible input.
Consider:
f(x) = 10/x
The input:
x = 0
is not allowed because division by zero is undefined.
Therefore, the domain excludes 0.
Domain:
all real numbers except 0
Domain in Real-World Situations
Suppose:
C = 8n + 20
represents the cost of ordering n pizzas.
Mathematically, the equation could accept values such as:
n = −4
or:
n = 2.5
But these values do not make sense if n represents a number of pizzas.
The realistic domain might be:
n = 0, 1, 2, 3, ...
Context determines which inputs are meaningful.
Function Notation in Context
Suppose:
C = 12n + 5
represents the total cost of ordering n items.
Then:
C(4)
does not simply mean "C times 4."
It means:
the total cost when 4 items are ordered.
Calculate:
C(4) = 12(4) + 5
C(4) = 53
Therefore:
C(4) = $53
Interpreting Function Values
Suppose:
H(t) = 120 − 5t
represents the height of water in a tank, in centimetres, after t minutes.
Then:
H(6)
means:
the height of the water after 6 minutes.
Calculate:
H(6) = 120 − 5(6)
H(6) = 90
Therefore:
After 6 minutes, the water is 90 cm high.
A complete interpretation includes both the value and its meaning.
Units Matter
Suppose:
d(t) = 60t
where:
d = distance in kilometres
t = time in hours
Then:
d(3) = 60(3)
d(3) = 180
A complete interpretation is:
After 3 hours, the object has travelled 180 km.
Not simply:
"d(3) = 180."
Real-World Function: Taxi Cost
Suppose a taxi charges:
- $6 starting fee
- $3 per kilometre
Let:
C(d) = 3d + 6
where d is distance in kilometres.
Find:
C(10)
C(10) = 3(10) + 6
C(10) = 36
Therefore:
A 10 km trip costs $36.
Real-World Function: Temperature
Suppose:
T = 18 + 2h
models temperature in °C, h hours after a measurement begins.
Find:
T(4)
T(4) = 18 + 2(4)
T(4) = 26
Therefore:
The model predicts a temperature of 26°C after 4 hours.
Real-World Function: Falling Water Level
Suppose:
W(t) = 250 − 12t
where W is water volume in litres and t is time in minutes.
Find:
W(5)
W(5) = 250 − 12(5)
W(5) = 190
Therefore:
After 5 minutes, 190 L of water remain.
Different Names for Functions
Functions do not always use the letter f.
We might have:
f(x) = 2x + 1
g(x) = x²
h(t) = 5t − 3
C = 12n + 20
T(t) = 25 − 0.5t
The function name can help communicate what the function represents.
For example:
C might represent cost.
T might represent temperature.
P might represent population.
Comparing Two Functions
Suppose:
f(x) = 2x + 5
and:
g(x) = 4x − 1
Find f(3):
f(3) = 2(3) + 5
f(3) = 11
Find g(3):
g(3) = 4(3) − 1
g(3) = 11
At x = 3, both functions have the same output.
Functions Can Be Represented in Different Ways
A function can be represented using:
- words
- ordered pairs
- mapping diagrams
- tables
- equations
- function notation
- graphs
For example:
Words: Start at 2 and increase by 3 for every unit increase in x.
Equation: y = 3x + 2
Function notation: f(x) = 3x + 2
Table:
| x | f(x) |
|---|---|
| 0 | 2 |
| 1 | 5 |
| 2 | 8 |
| 3 | 11 |
All these representations describe the same relationship.
Moving Between Representations
Suppose a table shows:
| x | f(x) |
|---|---|
| 0 | 5 |
| 1 | 9 |
| 2 | 13 |
| 3 | 17 |
The outputs increase by 4.
Therefore:
rate of change = 4
At x = 0:
f(0) = 5
So:
f(x) = 4x + 5
The table and equation represent the same function.
Functions and Linear Relationships
A linear function can usually be written:
f(x) = mx + b
where:
m = constant rate of change
b = starting value
For example:
f(x) = −3x + 10
has:
rate of change = −3
starting value = 10
Every input still has exactly one output, so it is a function.
Functions Do Not Have to Be Linear
Examples of functions include:
Linear:
f(x) = 2x + 3
Quadratic:
f(x) = x²
Exponential:
f(x) = 2ˣ
Constant:
f(x) = 7
All satisfy the fundamental requirement:
each allowed input produces exactly one output.
Finding an Input When the Output Is Known
Suppose:
f(x) = 3x + 5
and:
f(x) = 20
We want to find the input that produces 20.
Write:
3x + 5 = 20
Subtract 5:
3x = 15
Divide by 3:
x = 5
Therefore:
f(5) = 20
Input vs Output Questions
These two questions are different:
Find f(5).
This gives you the input and asks for the output.
But:
Find x when f(x) = 5.
This gives you the output and asks for the input.
Carefully identify which quantity is known before calculating.
Evaluating an Expression as an Input
Function notation can contain expressions rather than just numbers.
Suppose:
f(x) = 2x + 3
Find:
f(a)
Replace x with a:
f(a) = 2a + 3
Now find:
f(a + 1)
Replace every x with:
a + 1
f(a + 1) = 2(a + 1) + 3
f(a + 1) = 2a + 2 + 3
f(a + 1) = 2a + 5
This idea becomes important in more advanced algebra.
A Function as a Rule
A function can be thought of as a rule assigning each allowed input exactly one output.
For:
f(x) = x² − 1
the rule says:
- take the input
- square it
- subtract 1
For x = 4:
f(4) = 4² − 1
f(4) = 16 − 1
f(4) = 15
The same rule is applied consistently to every allowed input.
Evaluating Functions Efficiently
When evaluating a function:
- Write the function.
- Identify the requested input.
- Replace every occurrence of the variable with the input.
- Use parentheses when substituting negative numbers or expressions.
- Follow the order of operations.
- Simplify.
- Include units and interpretation when working in context.
Determining Whether a Relation Is a Function
When given a relation, ask:
Ordered pairs:
Does any input have two different outputs?
Table:
Does any input appear with different outputs?
Mapping diagram:
Does any input have arrows leading to multiple outputs?
Graph:
Does it pass the vertical line test?
Equation:
Does each allowed input determine exactly one output?
These tests all come from the same definition of a function.
Common Mistakes
Thinking f(x) means f × x
Function notation does not represent multiplication. It means the output of function f at input x.
Thinking outputs cannot repeat
Different inputs are allowed to produce the same output.
Allowing one input to have two outputs
This violates the definition of a function.
Substituting into only one occurrence of x
Every x in the rule must be replaced.
Forgetting parentheses around negative inputs
For f(x) = x², write:
f(−3) = (−3)²
not:
−3²
Confusing inputs and outputs
f(4) asks for the output corresponding to input 4.
Misreading a graph
To find f(3), begin with x = 3 and locate the corresponding y-value.
Ignoring context
An equation may mathematically accept inputs that are impossible in the real situation.
Ignoring units
Function values in context should be interpreted using appropriate units.
Thinking only straight lines are functions
Many curved graphs, including y = x², are functions.
Key Terms
Function — relationship in which every input has exactly one output.
Relation — collection of input-output relationships.
Input — value entered into a function.
Output — value produced by a function.
Independent variable — variable used as the input.
Dependent variable — variable whose value depends on the input.
Function notation — notation such as f(x) used to represent the output of a function.
Evaluate — determine a function's output for a specified input.
Ordered pair — pair (x, y) representing an input and its corresponding output.
Mapping diagram — visual representation connecting inputs to outputs.
Function rule — mathematical rule used to determine outputs from inputs.
Domain — set of allowed input values.
Range — set of resulting output values.
Vertical line test — graphical test used to determine whether a relation is a function.
Linear function — function with a constant rate of change.
Non-linear function — function whose graph is not a straight line and whose rate of change is generally not constant.
Realistic domain — inputs that make sense within the context of a real-world model.
Key Takeaways
- A function connects inputs to outputs.
- Every input in a function must have exactly one output.
- Different inputs may have the same output.
- A relation fails to be a function only when an input corresponds to more than one different output.
- Functions can be represented using tables, ordered pairs, mapping diagrams, equations, graphs, and words.
- Function notation such as f(x) is read "f of x."
- f(x) does not mean f multiplied by x.
- To evaluate a function, substitute the specified input for every occurrence of the variable.
- Parentheses are particularly important when substituting negative values.
- f(0) often represents the starting value of a linear function.
- The domain contains allowed inputs.
- The range contains resulting outputs.
- The vertical line test determines whether a graph represents y as a function of x.
- A function does not have to be linear.
- Linear, quadratic, exponential, and constant relationships can all be functions.
- Function values should be interpreted using their real-world meaning and units.
- Context can restrict the domain of a function.
- Tables, graphs, equations, and function notation can represent the same function.
- Function notation provides an efficient way to communicate input-output relationships.
Check Your Understanding
- Explain what it means to say that a relation is a function.
- Determine whether the relation {(1, 4), (2, 6), (3, 8), (4, 10)} is a function. Explain your reasoning.
- Determine whether {(1, 5), (2, 7), (2, 9), (3, 11)} is a function. Identify the problem.
- Determine whether {(1, 6), (2, 6), (3, 8), (4, 8)} is a function. Explain why repeated outputs do or do not cause a problem.
- Given f(x) = 3x + 7, calculate f(5).
- Given g(x) = x² − 4, calculate g(3) and g(−3).
- Given h(x) = 5 − 2x, calculate h(0), h(4), and h(−2).
- The function C
= 8n + 15 represents the cost of ordering n items. Calculate C(6) and explain what the result means.
- The function H(t) = 150 − 6t represents the height of water in centimetres after t minutes. Find H(10) and interpret your answer.
- Consider the table:
| x | f(x) |
|---|---|
| 0 | 3 |
| 1 | 7 |
| 2 | 11 |
| 3 | 15 |
Write an equation for f(x) and use it to determine f(20).
- A relation contains the pairs (−2, 4), (−1, 1), (0, 0), (1, 1), (2, 4). Is it a function? Explain why two different inputs producing the same output does not violate the function rule.
- Explain how the vertical line test can be used to determine whether a graph represents a function.
- Given f(x) = 4x − 3, determine the input x for which f(x) = 25.
- A taxi's cost is represented by C(d) = 4d + 6, where d is distance in kilometres and C is cost in dollars. Explain the meanings of C(0), C(5), and the number 4 in the function rule.
- A water tank contains 300 L and loses water at a constant rate of 12 L/min. Define an appropriate function V(t), create a table for t = 0 through 5 minutes, explain the domain that makes sense physically, and determine whether the function should continue to be used after the tank becomes empty.