1. Patterns and Linear Relationships

Learning outcomes
  • I can identify linear patterns in tables and sequences.
  • I can determine the constant rate of change in a pattern.
  • I can extend linear patterns using algebraic rules.
  • I can describe relationships between variables.
  • I can distinguish linear relationships from non-linear relationships.

Patterns and Linear Relationships

A pattern is a repeated or predictable arrangement of numbers, shapes, or quantities. In mathematics, recognizing patterns helps us predict what comes next and describe how quantities are related.

A linear pattern changes by a constant amount.

Consider the sequence:

4, 7, 10, 13, 16, ...

Each term increases by:

+3

Because the same amount is added each time, this is a linear pattern.

Linear patterns are closely connected to linear equations, tables, graphs, and real-world situations involving a constant rate of change.


Recognizing Patterns in Sequences

A sequence is an ordered list of numbers or other mathematical objects.

For example:

5, 9, 13, 17, 21, ...

Look at the difference between consecutive terms:

9 − 5 = 4

13 − 9 = 4

17 − 13 = 4

21 − 17 = 4

The difference is always:

+4

Therefore, the sequence is linear.

The value 4 is called the common difference.


Constant Difference

A numerical sequence is linear when the difference between consecutive terms is constant.

Consider:

20, 17, 14, 11, 8, ...

Differences:

17 − 20 = −3

14 − 17 = −3

11 − 14 = −3

8 − 11 = −3

The common difference is:

−3

This is still a linear pattern.

A linear pattern can increase or decrease.


Increasing Linear Patterns

Consider:

2, 7, 12, 17, 22, ...

The pattern increases by:

5

each time.

The common difference is:

+5

An increasing linear pattern has a positive rate of change.


Decreasing Linear Patterns

Consider:

30, 26, 22, 18, 14, ...

The pattern decreases by:

4

each time.

The common difference is:

−4

A decreasing linear pattern has a negative rate of change.


Constant Patterns

Consider:

8, 8, 8, 8, 8, ...

The difference between consecutive terms is:

0

This is also a linear pattern because its rate of change is constant.

Its constant rate of change is:

0


Patterns in Tables

Linear relationships can also be identified using tables.

Consider:

x y
0 2
1 5
2 8
3 11
4 14

As x increases by 1, y increases by 3.

Therefore:

rate of change = 3

This table represents a linear relationship.

https://images.openai.com/static-rsc-4/lcsqnHo_uhyeX3VLncqdI1qq-amuQ2RXeattwo56iusWY4Iuvmd5_PuAe4OJWptHW12c32EviDf2ReOtfg6dHeg8PUiD_pvrQxlnwyDymVbFk8-lGwLIQ7TheFs9iJ_ZervxW_TwKxIRCYKjsNz-xOPWuoN8xR9lv6PfgzGRLaY5-inLbsgbn7YguuvDPq1Q?purpose=fullsize
 
https://images.openai.com/static-rsc-4/bOHyGrR2RDJzraJFRJFdBtTMcyljFfG_05M8tAI93TjBQc0BX9KAMD6i9-1TBUCIkHgZ42Z5G_2w_gdsbV0jzIeYgI1crBfv2Gzh8JxmIaZ6i_efCa7SVWQ5p471opFrHuXZEWloBtqvAJBUBUjphtyGuoxNfxsnRIGFqAQrzrbQUWdj9ZEXzO3k5kVQUBEX?purpose=fullsize
 
https://images.openai.com/static-rsc-4/GHI0v-m1PD2U96i56OZDUvccjKIeixxSvEIbU87wrph40296hmJfujFMb3pS0tfFcXl9EV9OJL897lF9OQ00bzBu0d6rdtqla-5O0OG0p9plZg4PQRYTAyWDRfm4qfrE7tM8a8sZXsjL6o24z2meugOZcEmwyXF0Bi7w7Z9zSt39cvvhD_bVXFY9GIEuwbam?purpose=fullsize
 
10

Rate of Change

The rate of change describes how much one variable changes compared with another variable.

It can be calculated using:

rate of change = change in y / change in x

or:

rate of change = Δy/Δx

The symbol Δ means "change in."

For example, suppose:

x changes from 2 to 5

and:

y changes from 7 to 19

Then:

Δx = 5 − 2 = 3

Δy = 19 − 7 = 12

Therefore:

rate of change = 12/3

rate of change = 4


Constant Rate of Change

A relationship is linear when its rate of change remains constant.

Consider:

x y
1 7
2 11
3 15
4 19

For every increase of 1 in x:

y increases by 4.

Therefore:

Δy/Δx = 4/1 = 4

The rate of change is constant, so the relationship is linear.


When x Does Not Increase by 1

Do not simply look at the change in y unless the change in x is always 1.

Consider:

x y
0 5
2 11
4 17
6 23

Here:

Δx = 2

and:

Δy = 6

Therefore:

rate of change = 6/2

rate of change = 3

The relationship is linear because this rate remains constant.


Unequal x-Intervals

Consider:

x y
1 5
3 11
7 23
10 32

The x-values do not increase by equal amounts, so calculate the rate carefully.

From the first to second row:

rate = (11 − 5)/(3 − 1)

= 6/2

= 3

From the second to third:

rate = (23 − 11)/(7 − 3)

= 12/4

= 3

From the third to fourth:

rate = (32 − 23)/(10 − 7)

= 9/3

= 3

The rate is always 3.

Therefore, the relationship is linear.


Linear Rules

A linear relationship can often be represented using:

y = mx + b

where:

m = constant rate of change

and:

b = starting value when x = 0

This is called a linear equation.

For example:

y = 3x + 2

has:

rate of change = 3

starting value = 2


Connecting a Table to a Rule

Consider:

x y
0 4
1 7
2 10
3 13
4 16

First identify the rate of change.

Each y-value increases by:

3

Therefore:

m = 3

Now look at the value when x = 0:

y = 4

Therefore:

b = 4

The rule is:

y = 3x + 4


Checking the Rule

For:

y = 3x + 4

when x = 2:

y = 3(2) + 4

y = 6 + 4

y = 10

The table gives y = 10 when x = 2.

Therefore, the rule works.


Extending a Pattern Using a Rule

Suppose:

y = 5x + 2

To determine y when x = 10:

y = 5(10) + 2

y = 50 + 2

y = 52

An algebraic rule allows us to find values far beyond those shown in a table.

We do not need to extend the pattern one step at a time.


Sequences and Term Numbers

Sequences can also be described using algebraic rules.

Consider:

5, 8, 11, 14, 17, ...

Let n represent the term number.

n Term
1 5
2 8
3 11
4 14
5 17

The common difference is:

3

A rule for the sequence is:

T = 3n + 2

where T represents the term value.


Checking a Sequence Rule

For:

T = 3n + 2

find the fourth term.

T = 3(4) + 2

T = 12 + 2

T = 14

This agrees with the sequence.


Finding a Sequence Rule

Consider:

7, 12, 17, 22, 27, ...

The common difference is:

5

Start with:

T = 5n + b

Use the first term:

n = 1

T = 7

Therefore:

7 = 5(1) + b

7 = 5 + b

b = 2

So:

T = 5n + 2


Why the Starting Number Is Not Always b

Consider the sequence:

7, 12, 17, 22, ...

The first term is 7, but the equation is:

T = 5n + 2

not:

T = 5n + 7

This happens because the first term corresponds to:

n = 1

not n = 0.

If we extended the pattern backward to term 0:

2, 7, 12, 17, 22, ...

then the value at n = 0 would be 2.

That is the value of b.


Finding Later Terms Efficiently

Suppose:

T = 4n − 1

Find the 50th term.

Substitute:

n = 50

T = 4(50) − 1

T = 200 − 1

T = 199

An algebraic rule is much faster than writing all 50 terms.


Describing Relationships Between Variables

Variables often represent quantities that change together.

Suppose a taxi charges:

  • $5 starting fee
  • $3 per kilometre

Let:

d = distance travelled in kilometres

C = total cost in dollars

The relationship is:

C = 3d + 5

This tells us:

  • each additional kilometre adds $3
  • the rate of change is $3/km
  • the initial cost is $5
  • cost depends on distance

Independent and Dependent Variables

In many relationships, one variable affects another.

The independent variable is the variable we choose or control.

The dependent variable changes in response.

In:

C = 3d + 5

distance d is the independent variable.

Cost C is the dependent variable.

The cost depends on how far the taxi travels.


Real-World Linear Relationship: Hourly Pay

Suppose a worker earns:

$18 per hour

and receives a fixed:

$25 bonus

Let:

h = hours worked

P = total pay

Then:

P = 18h + 25

The rate of change is:

$18/hour

The starting value is:

$25

https://images.openai.com/static-rsc-4/LUHE6G1IFMlhWM8uyO19wYP36wpidz2YXpIeW1jR_xho3gH8tqIBHqTUC9hRDBBUdXFGhZ6nGrk-KS36aPCbJsV5CasCUECEmU1UxRzz10cFs1FvK7jd4SBfTlLg5oq6QHk6kis05JMnDaRE3SMr1So-E1i8kx-Iyud1LoFvvJ87Fz463bV4F19j8Ool5F8d?purpose=fullsize
 
https://images.openai.com/static-rsc-4/akPZdS47F8NUW_4uZXhKFc74S79d2epy_qFgckkmJuC4nVkuWVUHl7dnHH2CwDhrh3sF10rTf-q_k8OTj1sxV_OMB-nmodmLHht9uThvgAdh6qf3DU6g5FTXYF_UV93a4sEiJtGAeX2aVwD3ggiDgdt_zQRMRvHi9xAYTRPKm7tQ15qDeehs6vmoLsbLPGK1?purpose=fullsize
 
https://images.openai.com/static-rsc-4/W_UU4zE8ly0mippcxnLJCRRKjtO3DWiw3GG_Ty8XZEaueu5pchTjprkZ1UnItlA3khRTbPdmQG__kfGayquo3uinw6ZVnKp51mWv1arXH76Sh3kx9ozrATusay99lJrAdT3d48TMtX7y7tG-Il0tp47_I54dIta-wfd5rVgOwNos0GIQR4BX8hDI2eJLvPG2?purpose=fullsize
 
9

Building a Table from a Rule

For:

P = 18h + 25

we can construct:

Hours h Pay P
0 $25
1 $43
2 $61
3 $79
4 $97

Each additional hour increases pay by:

$18

This constant increase confirms that the relationship is linear.


Linear Relationships and Graphs

When a linear relationship is graphed on a coordinate plane, its points lie on a straight line.

For example:

y = 2x + 1

produces:

x y
0 1
1 3
2 5
3 7
4 9

The y-value increases by 2 whenever x increases by 1.
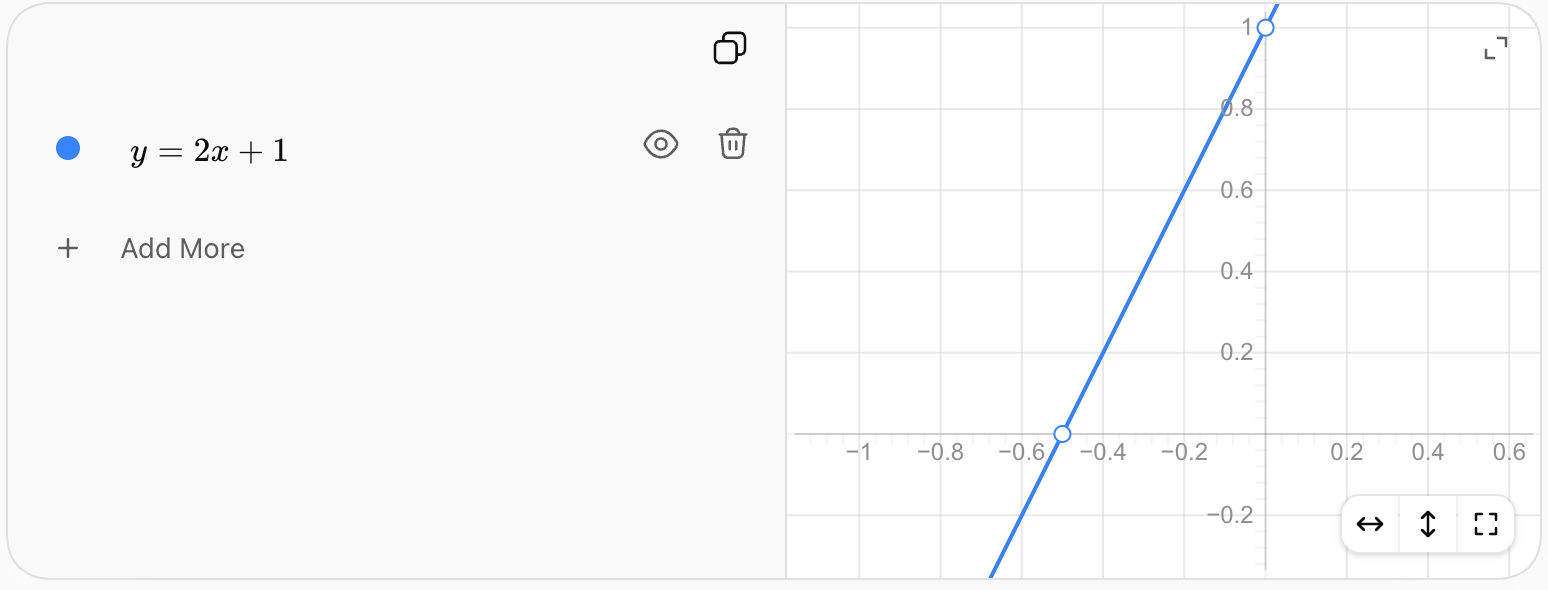
The straight-line graph is another way to recognize a linear relationship.


Rate of Change and Steepness

The rate of change affects how steep a linear graph appears.

Compare:

y = x

and:

y = 4x

The second relationship changes four times as quickly.

A larger positive rate of change produces a steeper upward line.

A negative rate of change produces a line that falls from left to right.


Positive Rate of Change

Consider:

y = 3x + 2

The rate of change is:

3

As x increases, y increases.

The graph rises from left to right.


Negative Rate of Change

Consider:

y = −2x + 10

The rate of change is:

−2

Every time x increases by 1:

y decreases by 2.

For example:

x y
0 10
1 8
2 6
3 4
4 2

The relationship is still linear because the rate of change remains constant.


Zero Rate of Change

Consider:

y = 6

No matter what x is, y remains 6.

Therefore:

rate of change = 0

The graph is a horizontal line.

This is still a linear relationship.


Linear vs Non-Linear Relationships

The defining feature of a linear relationship is a constant rate of change.

Consider:

x y
0 1
1 4
2 7
3 10

Changes in y:

+3, +3, +3

This is linear.

Now consider:

x y
0 1
1 2
2 4
3 8

Changes in y:

+1, +2, +4

The differences are not constant.

This relationship is non-linear.


A Quadratic Pattern

Consider:

1, 4, 9, 16, 25, ...

These are square numbers:

1², 2², 3², 4², 5²

First differences:

3, 5, 7, 9

The first differences are not constant.

Therefore, this sequence is not linear.

It follows a quadratic pattern.


An Exponential Pattern

Consider:

2, 4, 8, 16, 32, ...

Each term is multiplied by:

2

The differences are:

2, 4, 8, 16

They are not constant.

Therefore, this pattern is not linear.

It is an exponential pattern.

A constant multiplication factor does not produce a linear pattern.


Additive vs Multiplicative Patterns

Linear patterns are generally additive.

Example:

3, 8, 13, 18, 23

Add 5 each time.

Exponential patterns are generally multiplicative.

Example:

3, 6, 12, 24, 48

Multiply by 2 each time.

This distinction is useful when identifying patterns.


A Pattern Can Look Regular Without Being Linear

Consider:

1, 4, 9, 16, 25

The sequence clearly follows a pattern.

However, it is not linear.

A pattern is not automatically linear simply because it follows a predictable rule.

To be linear, it must have a constant rate of change.


Using First Differences

One useful way to identify a linear sequence is to calculate first differences.

Consider:

11, 16, 21, 26, 31

First differences:

16 − 11 = 5

21 − 16 = 5

26 − 21 = 5

31 − 26 = 5

Because the first differences are constant:

The sequence is linear.


Non-Linear First Differences

Consider:

2, 5, 10, 17, 26

First differences:

3, 5, 7, 9

Because the first differences change:

The sequence is non-linear.

In later mathematics, patterns in the differences themselves can help identify other types of relationships.


Constant Rate with Different Intervals

A common mistake is to expect equal changes in y when x changes by unequal amounts.

Consider:

Time серце Distance (km)
1 60
2 120
4 240
7 420

The changes in distance are not identical:

+60, +120, +180

But the changes in time are also different:

+1, +2, +3

Calculate the rates:

60/1 = 60

120/2 = 60

180/3 = 60

The rate is always:

60 km/h

Therefore, the relationship is linear.


Distance and Constant Speed

If an object travels at constant speed:

distance = speed × time

Suppose a cyclist travels at:

15 km/h

Then:

d = 15t

where:

d = distance in kilometres

t = time in hours

The constant rate of change is:

15 km/h

This is a linear relationship.


Starting Values in Real Situations

Not every linear relationship begins at zero.

Suppose a water tank initially contains:

100 L

and fills at:

8 L/min

Let:

t = time in minutes

V = volume in litres

Then:

V = 8t + 100

The rate of change is:

8 L/min

The starting value is:

100 L

At t = 0:

V = 100


Decreasing Real-World Pattern

Suppose a tank contains:

500 L

and loses water at:

20 L/min

The relationship is:

V = 500 − 20t

or:

V = −20t + 500

The rate of change is:

−20 L/min

The negative rate tells us that the amount of water decreases over time.


Extending a Table

Suppose:

x y
1 9
2 14
3 19
4 24

The constant difference is:

+5

Continue the pattern:

x y
5 29
6 34
7 39

The rule is:

y = 5x + 4

Using the rule, we can calculate any value directly.


Predicting Far Beyond a Table

Using:

y = 5x + 4

find y when:

x = 100

Substitute:

y = 5(100) + 4

y = 500 + 4

y = 504

This is one of the major advantages of algebraic rules: they allow us to make predictions without extending a table one row at a time.


Working Backward

An algebraic rule can also be used to determine an input from an output.

Suppose:

y = 4x + 3

and:

y = 35

Then:

35 = 4x + 3

Subtract 3:

32 = 4x

Divide by 4:

x = 8

This tells us that 35 occurs when x = 8.


Comparing Two Linear Patterns

Consider:

Pattern A:

y = 2x + 5

Pattern B:

y = 4x + 1

Pattern A has:

rate of change = 2

Pattern B has:

rate of change = 4

Therefore, Pattern B grows more quickly.

However, Pattern A begins with a larger starting value.

This means one pattern may begin larger even though the other eventually overtakes it.


Finding Where Two Patterns Are Equal

Using:

y = 2x + 5

and:

y = 4x + 1

set the expressions equal:

2x + 5 = 4x + 1

Subtract 2x:

5 = 2x + 1

Subtract 1:

4 = 2x

x = 2

At x = 2:

Pattern A:

2(2) + 5 = 9

Pattern B:

4(2) + 1 = 9

The two patterns meet at:

(2, 9)


Comparing Linear Relationships from Tables

Suppose:

Pattern A

x y
0 5
1 8
2 11
3 14

Rate:

3

Now consider:

Pattern B

x y
0 1
1 6
2 11
3 16

Rate:

5

Pattern B changes more quickly because:

5 > 3

Even though Pattern A begins with a larger value.


Connecting Tables, Rules, and Graphs

A linear relationship can be represented in several ways.

Words

"Start at 4 and increase by 3 each time."

Table

x y
0 4
1 7
2 10

Rule

y = 3x + 4

Graph

A straight line with a constant rate of change of 3.

These are different representations of the same relationship.

https://images.openai.com/static-rsc-4/JK7b8ZM_rwMZiXDFwwxtTRFC6wrwoYXJacEaBWrL9xr2ZXDvDleb9gcqNzBdVikh7Aa-pfKkaDuvOoIDyMrtQytXRfnSdno_d8FW4d0R0M1bd9X3uZYLf0TBE4hvT4gyRrp7lh4rzNpeqEN0m2jD48zhshS6Qv6q0G4I37BQz8chaxo1rZSprNT8YXSjYADd?purpose=fullsize
 
https://images.openai.com/static-rsc-4/yl947in3Ufe77JB5Gf0O0DIkF_-yc9y6yj-TwWcJq1ukZgOj6XUELz26NxnwKZU7nk12h9eRDAFSXenHxLX5o9p4ibSFKuwoqZkA0HVytRAUwjGAmzybtztQEIKIW0oKysV1cQ_VXINWJd0yO6fCaR-c3al-YRkPKsuMAx4ovZD_fC8VeNwvtlUlNUOcRdM0?purpose=fullsize
 
https://images.openai.com/static-rsc-4/rw8_DONyrXhVQWyXpk70t2Os-GmJlWxDNyUXhSFFsjJ8wjUdONNxleF5AxLBe9q_DkM9eiw2v1p-idlgMz-yMkq2u3xEZb0znQQ6Nkd8FRSP2v0tM_XBqOcPqulFjLazGk8EaOHRS99pfH7yXLslv3wsHu8fYJwYfdO7_PnHHDfGvW2wQWcRBckT_c2JcHOu?purpose=fullsize
 
9

Interpreting the Rate in Context

The rate of change should always include meaning and units.

If:

C = 4d + 6

where C is taxi cost in dollars and d is distance in kilometres:

rate = $4/km

This means:

The cost increases by $4 for every additional kilometre travelled.

Simply saying "the rate is 4" is mathematically incomplete when interpreting a real situation.


Interpreting the Starting Value

For:

C = 4d + 6

the starting value is:

6

In context:

The taxi costs $6 before any distance is travelled.

The starting value might represent:

  • an initial fee
  • an initial population
  • starting height
  • initial volume
  • starting balance
  • initial temperature

Its meaning depends on the situation.


Practical Example: Phone Plan

A phone plan costs:

$25 per month

plus:

$3 per GB of additional data

Let:

g = additional data in GB

C = total cost

Then:

C = 3g + 25

The rate of change is:

$3/GB

The starting value is:

$25

If 8 GB of additional data is used:

C = 3(8) + 25

C = 24 + 25

C = $49


Practical Example: Saving Money

Suppose you already have:

$120

and save:

$25 each week

Let:

w = number of weeks

S = total savings

Then:

S = 25w + 120

After 10 weeks:

S = 25(10) + 120

S = 250 + 120

S = $370

This is linear because the savings increase by the same amount each week.


Practical Example: Candle Burning

A candle begins at:

30 cm

and burns down at:

2 cm per hour

Let:

t = time in hours

h = candle height

Then:

h = 30 − 2t

The rate of change is:

−2 cm/h

The negative sign indicates that the candle becomes shorter.

After 6 hours:

h = 30 − 2(6)

h = 18

The candle is:

18 cm tall

under this model.


When a Linear Model Stops Making Sense

The candle equation:

h = 30 − 2t

is mathematically defined for many values of t.

But eventually it predicts negative candle heights.

For example:

t = 20

h = 30 − 40

h = −10 cm

A candle cannot have a physical height of −10 cm.

Therefore, the mathematical model only makes sense over a limited domain.

This is an important part of interpreting real-world linear relationships.


Linear Patterns in Geometry

Suppose a row of connected squares is built with matchsticks.

If each new square shares one side with the previous square, each additional square adds a constant number of matchsticks.

A possible pattern is:

4, 7, 10, 13, 16, ...

The common difference is:

3

Therefore, the pattern is linear.

https://images.openai.com/static-rsc-4/oy_EeOVY7jEtzOytVN4hqQzyOEvDqUoI8aRfMMWd6U1r39cTvMn2vgWKvFygirPDOI4q3eaJ6QLhkhUYZdHUZcsdNg2Tb5ioa7jo9Rb97NEFDK-py_YUWk4qJvrnTf6WgtrcmWlCfCGRwnq9kvInYTI3Gq2O5ZGgBMZml4O4btJYEYEyiLpI-RuqvSnjNHEN?purpose=fullsize
 

Finding the Rule for a Geometric Pattern

Suppose:

Number of Squares n Matchsticks M
1 4
2 7
3 10
4 13

The rate is:

3 matchsticks per additional square

Use:

M = 3n + b

Substitute n = 1 and M = 4:

4 = 3(1) + b

b = 1

Therefore:

M = 3n + 1

For 20 squares:

M = 3(20) + 1

M = 61


Identifying Linear Relationships Quickly

Ask these questions:

From a sequence:
Are the first differences constant?

From a table:
Is Δy/Δx constant?

From an equation:
Can it be written in the form y = mx + b?

From a graph:
Do the points form a straight line?

From a situation:
Does one quantity change by a constant amount for each unit change in another quantity?

If yes, the relationship is likely linear.


Identifying Non-Linear Relationships

A relationship is non-linear if its rate of change is not constant.

Common examples include:

Quadratic

y = x²

Exponential

y = 2ˣ

Inverse

y = 1/x

These relationships do not form straight lines and do not have a constant rate of change over their entire domains.


Linear or Non-Linear?

Consider:

Pattern A

2, 6, 10, 14, 18

Differences:

+4, +4, +4, +4

Linear

Consider:

Pattern B

2, 6, 18, 54, 162

Each term is multiplied by 3.

Differences are not constant.

Non-linear

Consider:

Pattern C

3, 3, 3, 3, 3

Differences:

0, 0, 0, 0

Linear


A Reliable Strategy for Analyzing Patterns

When given a sequence, table, graph, or situation:

  1. Identify the variables or term numbers.
  2. Calculate changes in the input.
  3. Calculate changes in the output.
  4. Determine Δy/Δx.
  5. Check whether the rate remains constant.
  6. If constant, identify the relationship as linear.
  7. Determine the rate of change.
  8. Find the starting value.
  9. Write an algebraic rule if possible.
  10. Use the rule to extend or predict values.
  11. Interpret the rate and starting value in context.
  12. Check whether the model remains realistic for the values being considered.

Common Mistakes

Looking only for a pattern

A predictable pattern is not necessarily linear. Linear patterns specifically require a constant rate of change.

Checking y-values without considering x-values

If x changes by different amounts, calculate:

Δy/Δx

rather than only comparing y-differences.

Thinking decreasing patterns are non-linear

A constant negative rate of change is still linear.

Thinking a constant pattern is non-linear

A constant rate of zero is linear.

Confusing additive and multiplicative patterns

Adding the same amount produces a linear sequence. Multiplying by the same factor usually produces an exponential pattern.

Using the first term as b

In a sequence where n starts at 1, the first term is not necessarily the value of b.

Ignoring units

A rate should be interpreted using units such as dollars/hour, kilometres/hour, or litres/minute.

Assuming every algebraic pattern is linear

Equations containing x², x³, √x, 1/x, or similar expressions are generally non-linear.

Extending a real-world model beyond a reasonable domain

A linear rule may be mathematically valid for values that make no physical sense.


Key Terms

Pattern — predictable arrangement or change in numbers, shapes, or quantities.

Sequence — ordered list of numbers or mathematical objects.

Term — individual value in a sequence.

Term number — position of a term within a sequence.

Linear pattern — pattern with a constant rate of change.

Non-linear pattern — pattern whose rate of change is not constant.

Common difference — constant difference between consecutive terms of a linear sequence.

First differences — differences between consecutive terms in a sequence.

Rate of change — amount one variable changes relative to another.

Constant rate of change — rate that remains the same throughout a relationship.

Independent variable — variable used as the input or controlled quantity.

Dependent variable — variable whose value depends on another variable.

Linear relationship — relationship between variables having a constant rate of change.

Linear equation — equation representing a linear relationship, commonly written y = mx + b.

Starting value — value of the dependent variable when the independent variable is zero.

Algebraic rule — equation describing how variables or pattern values are related.

Domain — set of input values for which a relationship or model is defined or meaningful.

Prediction — value estimated or calculated from an identified relationship.


Key Takeaways

  • Patterns can be represented using sequences, tables, equations, graphs, and words.
  • A linear pattern has a constant rate of change.
  • In a sequence with consecutive term numbers, a constant first difference indicates a linear pattern.
  • Linear patterns may increase, decrease, or remain constant.
  • A positive rate produces an increasing relationship.
  • A negative rate produces a decreasing relationship.
  • A zero rate produces a constant relationship.
  • Rate of change can be calculated using Δy/Δx.
  • When x-values have unequal intervals, both Δx and Δy must be considered.
  • Linear relationships can often be written as y = mx + b.
  • In y = mx + b, m represents the rate of change and b represents the starting value.
  • An algebraic rule can extend a pattern far beyond the values shown in a table.
  • Linear graphs form straight lines.
  • A predictable pattern is not necessarily linear.
  • Quadratic and exponential patterns are examples of non-linear relationships.
  • Repeated addition or subtraction commonly indicates a linear pattern.
  • Repeated multiplication usually indicates a non-linear pattern.
  • Rates should be interpreted with appropriate units.
  • Real-world linear models may only make sense over a restricted domain.
  • Tables, equations, graphs, and verbal descriptions can all represent the same linear relationship.

Check Your Understanding

  1. Determine whether 4, 9, 14, 19, 24, ... is a linear sequence. If it is, state the common difference.
  2. Determine whether 3, 6, 12, 24, 48, ... is linear. Explain your reasoning.
  3. Find the next three terms in 30, 26, 22, 18, ....
  4. Determine the constant rate of change in the table:
x y
0 6
1 10
2 14
3 18
  1. Determine whether the relationship is linear:
x y
0 2
2 8
5 17
9 29

Show how you calculated the rates.

  1. Write an algebraic rule for the sequence 6, 10, 14, 18, 22, ..., where n = 1 represents the first term.
  2. Use your rule from Question 6 to determine the 50th term.
  3. A relationship has a rate of change of −3 and a starting value of 20. Write an equation in the form y = mx + b.
  4. A taxi charges a starting fee of $7 plus $4 per kilometre. Define variables and write a linear equation relating cost and distance. Explain the meaning of the rate of change.
  5. A tank initially contains 350 L and loses 15 L each minute. Write a linear equation for its volume after t minutes. Determine its volume after 12 minutes.
  6. Compare y = 3x + 8 and y = 5x + 2. Which has the greater rate of change? Which has the greater starting value?
  7. Determine whether 2, 5, 10, 17, 26, ... is linear. Use first differences to justify your answer.
  8. A student says that 5, 10, 20, 40, 80, ... is linear because there is a clear pattern. Explain the student's mistake and identify what type of change is occurring.
  9. A worker begins with a $40 bonus and earns $22 per hour. Create a table for 0 through 5 hours, write the algebraic rule, identify the independent and dependent variables, and explain the meaning of both the rate of change and starting value.
  10. A candle begins at 36 cm tall and burns down at a constant rate of 3 cm per hour. Write a linear equation for its height, determine when the candle reaches 12 cm, and explain why the same linear model should not be used indefinitely.