Linear Relationships and Functions
1. Patterns and Linear Relationships
Learning outcomes
- I can identify linear patterns in tables and sequences.
- I can determine the constant rate of change in a pattern.
- I can extend linear patterns using algebraic rules.
- I can describe relationships between variables.
- I can distinguish linear relationships from non-linear relationships.
Patterns and Linear Relationships
A pattern is a repeated or predictable arrangement of numbers, shapes, or quantities. In mathematics, recognizing patterns helps us predict what comes next and describe how quantities are related.
A linear pattern changes by a constant amount.
Consider the sequence:
4, 7, 10, 13, 16, ...
Each term increases by:
+3
Because the same amount is added each time, this is a linear pattern.
Linear patterns are closely connected to linear equations, tables, graphs, and real-world situations involving a constant rate of change.
Recognizing Patterns in Sequences
A sequence is an ordered list of numbers or other mathematical objects.
For example:
5, 9, 13, 17, 21, ...
Look at the difference between consecutive terms:
9 − 5 = 4
13 − 9 = 4
17 − 13 = 4
21 − 17 = 4
The difference is always:
+4
Therefore, the sequence is linear.
The value 4 is called the common difference.
Constant Difference
A numerical sequence is linear when the difference between consecutive terms is constant.
Consider:
20, 17, 14, 11, 8, ...
Differences:
17 − 20 = −3
14 − 17 = −3
11 − 14 = −3
8 − 11 = −3
The common difference is:
−3
This is still a linear pattern.
A linear pattern can increase or decrease.
Increasing Linear Patterns
Consider:
2, 7, 12, 17, 22, ...
The pattern increases by:
5
each time.
The common difference is:
+5
An increasing linear pattern has a positive rate of change.
Decreasing Linear Patterns
Consider:
30, 26, 22, 18, 14, ...
The pattern decreases by:
4
each time.
The common difference is:
−4
A decreasing linear pattern has a negative rate of change.
Constant Patterns
Consider:
8, 8, 8, 8, 8, ...
The difference between consecutive terms is:
0
This is also a linear pattern because its rate of change is constant.
Its constant rate of change is:
0
Patterns in Tables
Linear relationships can also be identified using tables.
Consider:
| x | y |
|---|---|
| 0 | 2 |
| 1 | 5 |
| 2 | 8 |
| 3 | 11 |
| 4 | 14 |
As x increases by 1, y increases by 3.
Therefore:
rate of change = 3
This table represents a linear relationship.


Rate of Change
The rate of change describes how much one variable changes compared with another variable.
It can be calculated using:
rate of change = change in y / change in x
or:
rate of change = Δy/Δx
The symbol Δ means "change in."
For example, suppose:
x changes from 2 to 5
and:
y changes from 7 to 19
Then:
Δx = 5 − 2 = 3
Δy = 19 − 7 = 12
Therefore:
rate of change = 12/3
rate of change = 4
Constant Rate of Change
A relationship is linear when its rate of change remains constant.
Consider:
| x | y |
|---|---|
| 1 | 7 |
| 2 | 11 |
| 3 | 15 |
| 4 | 19 |
For every increase of 1 in x:
y increases by 4.
Therefore:
Δy/Δx = 4/1 = 4
The rate of change is constant, so the relationship is linear.
When x Does Not Increase by 1
Do not simply look at the change in y unless the change in x is always 1.
Consider:
| x | y |
|---|---|
| 0 | 5 |
| 2 | 11 |
| 4 | 17 |
| 6 | 23 |
Here:
Δx = 2
and:
Δy = 6
Therefore:
rate of change = 6/2
rate of change = 3
The relationship is linear because this rate remains constant.
Unequal x-Intervals
Consider:
| x | y |
|---|---|
| 1 | 5 |
| 3 | 11 |
| 7 | 23 |
| 10 | 32 |
The x-values do not increase by equal amounts, so calculate the rate carefully.
From the first to second row:
rate = (11 − 5)/(3 − 1)
= 6/2
= 3
From the second to third:
rate = (23 − 11)/(7 − 3)
= 12/4
= 3
From the third to fourth:
rate = (32 − 23)/(10 − 7)
= 9/3
= 3
The rate is always 3.
Therefore, the relationship is linear.
Linear Rules
A linear relationship can often be represented using:
y = mx + b
where:
m = constant rate of change
and:
b = starting value when x = 0
This is called a linear equation.
For example:
y = 3x + 2
has:
rate of change = 3
starting value = 2
Connecting a Table to a Rule
Consider:
| x | y |
|---|---|
| 0 | 4 |
| 1 | 7 |
| 2 | 10 |
| 3 | 13 |
| 4 | 16 |
First identify the rate of change.
Each y-value increases by:
3
Therefore:
m = 3
Now look at the value when x = 0:
y = 4
Therefore:
b = 4
The rule is:
y = 3x + 4
Checking the Rule
For:
y = 3x + 4
when x = 2:
y = 3(2) + 4
y = 6 + 4
y = 10
The table gives y = 10 when x = 2.
Therefore, the rule works.
Extending a Pattern Using a Rule
Suppose:
y = 5x + 2
To determine y when x = 10:
y = 5(10) + 2
y = 50 + 2
y = 52
An algebraic rule allows us to find values far beyond those shown in a table.
We do not need to extend the pattern one step at a time.
Sequences and Term Numbers
Sequences can also be described using algebraic rules.
Consider:
5, 8, 11, 14, 17, ...
Let n represent the term number.
| n | Term |
|---|---|
| 1 | 5 |
| 2 | 8 |
| 3 | 11 |
| 4 | 14 |
| 5 | 17 |
The common difference is:
3
A rule for the sequence is:
T = 3n + 2
where T represents the term value.
Checking a Sequence Rule
For:
T = 3n + 2
find the fourth term.
T = 3(4) + 2
T = 12 + 2
T = 14
This agrees with the sequence.
Finding a Sequence Rule
Consider:
7, 12, 17, 22, 27, ...
The common difference is:
5
Start with:
T = 5n + b
Use the first term:
n = 1
T = 7
Therefore:
7 = 5(1) + b
7 = 5 + b
b = 2
So:
T = 5n + 2
Why the Starting Number Is Not Always b
Consider the sequence:
7, 12, 17, 22, ...
The first term is 7, but the equation is:
T = 5n + 2
not:
T = 5n + 7
This happens because the first term corresponds to:
n = 1
not n = 0.
If we extended the pattern backward to term 0:
2, 7, 12, 17, 22, ...
then the value at n = 0 would be 2.
That is the value of b.
Finding Later Terms Efficiently
Suppose:
T = 4n − 1
Find the 50th term.
Substitute:
n = 50
T = 4(50) − 1
T = 200 − 1
T = 199
An algebraic rule is much faster than writing all 50 terms.
Describing Relationships Between Variables
Variables often represent quantities that change together.
Suppose a taxi charges:
- $5 starting fee
- $3 per kilometre
Let:
d = distance travelled in kilometres
C = total cost in dollars
The relationship is:
C = 3d + 5
This tells us:
- each additional kilometre adds $3
- the rate of change is $3/km
- the initial cost is $5
- cost depends on distance
Independent and Dependent Variables
In many relationships, one variable affects another.
The independent variable is the variable we choose or control.
The dependent variable changes in response.
In:
C = 3d + 5
distance d is the independent variable.
Cost C is the dependent variable.
The cost depends on how far the taxi travels.
Real-World Linear Relationship: Hourly Pay
Suppose a worker earns:
$18 per hour
and receives a fixed:
$25 bonus
Let:
h = hours worked
P = total pay
Then:
P = 18h + 25
The rate of change is:
$18/hour
The starting value is:
$25


Building a Table from a Rule
For:
P = 18h + 25
we can construct:
| Hours h | Pay P |
|---|---|
| 0 | $25 |
| 1 | $43 |
| 2 | $61 |
| 3 | $79 |
| 4 | $97 |
Each additional hour increases pay by:
$18
This constant increase confirms that the relationship is linear.
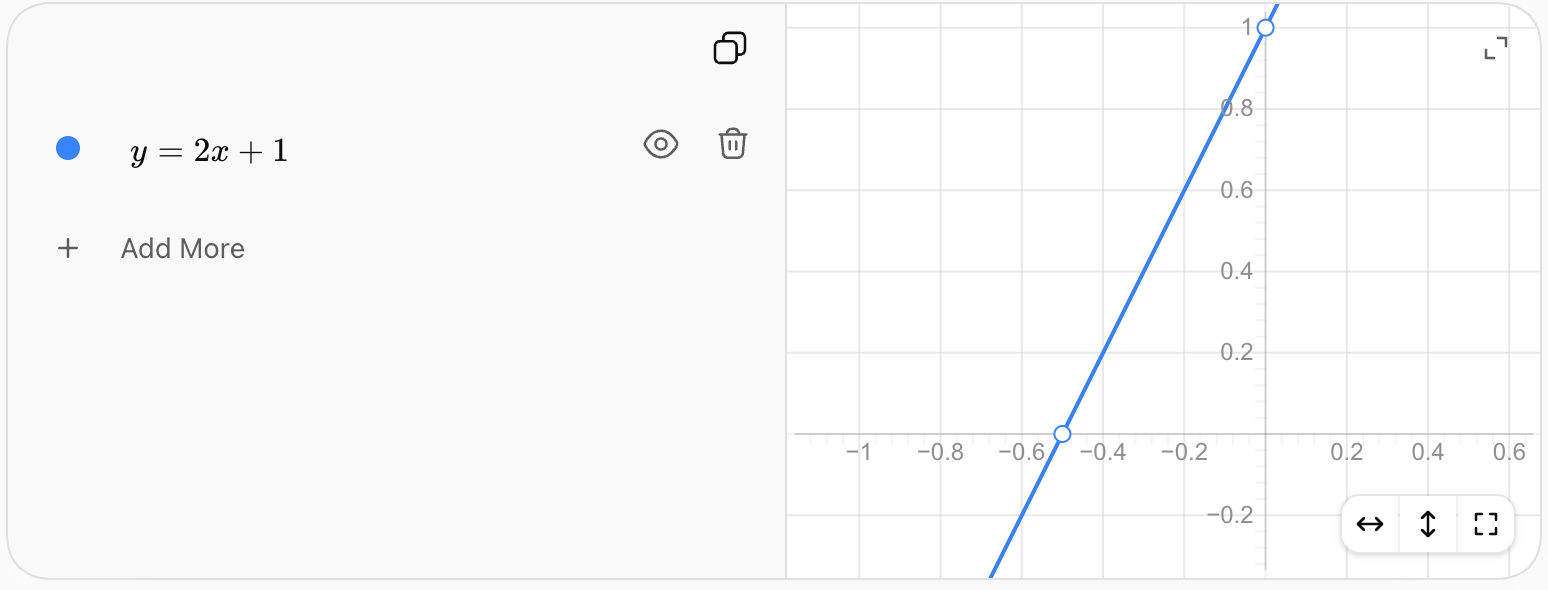
Linear Relationships and Graphs
When a linear relationship is graphed on a coordinate plane, its points lie on a straight line.
For example:
y = 2x + 1
produces:
| x | y |
|---|---|
| 0 | 1 |
| 1 | 3 |
| 2 | 5 |
| 3 | 7 |
| 4 | 9 |
The y-value increases by 2 whenever x increases by 1.