Introduction to Graphing
5. Algebraic Modeling Project
Learning outcomes
- I can create equations to represent real-world situations.
- I can generate tables of values from equations.
- I can graph relationships accurately.
- I can analyze and interpret mathematical models.
- I can communicate findings using equations, graphs, and written explanations.
Algebraic Modeling Project
Introduction to Algebraic Modeling
Mathematics is more than solving equations. It is also a powerful tool for understanding the world around us.
Algebraic modeling is the process of representing real-world situations using variables, equations, tables, and graphs.
A mathematical model allows us to describe relationships, investigate patterns, make predictions, and compare possible solutions.
For example, algebraic models can help us answer questions such as:
-
How much money will I save after several months?
-
Which mobile phone plan offers better value?
-
How far will a vehicle travel at a constant speed?
-
How many products must a business sell to make a profit?
-
How does the amount of water in a tank change over time?
-
How can we predict future costs from existing data?
In an algebraic modeling project, we begin with a real-world problem and develop a mathematical representation of the situation.


The goal is not simply to produce an equation. A successful mathematical model should also be understandable, useful, and appropriate for the situation being investigated.
What Is a Mathematical Model?
A mathematical model is a representation of a real-world system using mathematical relationships.
Models may include:
-
Equations
-
Tables
-
Graphs
-
Diagrams
-
Inequalities
-
Functions
-
Written explanations
Example: Saving Money
Suppose a student already has $50 and saves an additional $10 each week.
After one week:
Savings = 50 + 10 = $60
After two weeks:
Savings = 50 + 20 = $70
After three weeks:
Savings = 50 + 30 = $80
We can describe the situation using an equation:
S = 10w + 50
where:
-
S = total savings in dollars.
-
w = number of weeks.
This equation is a mathematical model.
It allows us to calculate savings for any number of weeks, assuming the student continues saving at the same rate.
Important Observation
A mathematical model simplifies reality so that important relationships can be studied.
The Algebraic Modeling Process
A useful modeling process follows a series of connected stages.
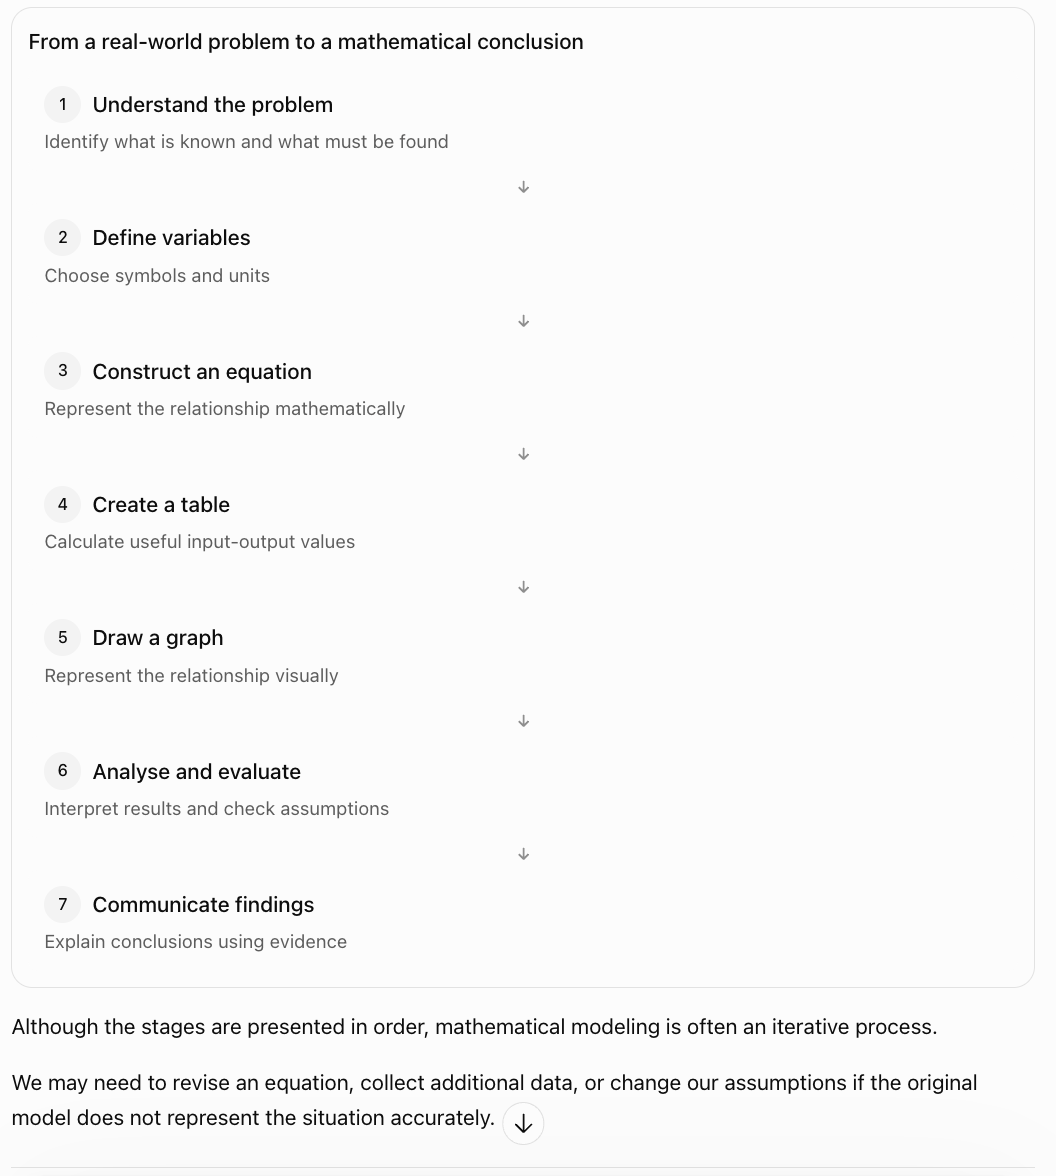
Although the stages are presented in order, mathematical modeling is often an iterative process.
We may need to revise an equation, collect additional data, or change our assumptions if the original model does not represent the situation accurately.
Identifying Variables
Variables represent quantities that can change.
Two important types are independent and dependent variables.
Independent Variable
The independent variable is the input quantity.
It is often represented by x.
Examples include:
-
Time
-
Distance travelled
-
Number of items purchased
-
Number of hours worked
Dependent Variable
The dependent variable is the output quantity.
It is often represented by y.
Examples include:
-
Total cost
-
Earnings
-
Distance travelled
-
Amount of money saved
Example: Buying Notebooks
A notebook costs $4.
The total cost depends on the number of notebooks purchased.
Independent variable: Number of notebooks, n
Dependent variable: Total cost, C
The equation is:
C = 4n
Important Observation
The dependent variable changes according to the value of the independent variable.
Creating Equations from Real-World Situations
One of the most important modeling skills is translating words into algebra.
Example: Gym Membership
A gym charges:
-
A registration fee of $30.
-
A monthly membership fee of $20.
Let:
m = number of months
C = total cost in dollars
The total cost consists of two parts:
Total cost = Monthly cost + Registration fee
Therefore:
C = 20m + 30
Interpretation
The coefficient 20 represents the monthly charge.
The constant 30 represents the initial registration fee.
Important Observation
Many real-world linear models can be written as:
y = mx + b
where:
-
m = rate of change.
-
b = initial value.
Understanding Initial Values and Rates of Change
In the equation:
y = mx + b
the two most important quantities are the slope and y-intercept.
Slope
The slope represents how much the output changes for each unit increase in the input.
y-Intercept
The y-intercept represents the output when the input equals zero.
Worked Example
A water tank initially contains 200 litres of water.
Water drains at a constant rate of 8 litres per minute.
Let:
t = time in minutes
V = volume of water in litres
The equation is:
V = 200 − 8t
Interpretation
-
Initial volume = 200 L.
-
Rate of change = −8 L/min.
-
The negative slope indicates decreasing volume.
Important Observation
A negative rate of change often represents a decrease, such as water loss, cooling, or spending savings.
Creating Tables of Values
Once an equation has been constructed, we can generate a table by substituting different values of the independent variable.
Worked Example: Gym Membership
Equation:
C = 20m + 30
Calculate the cost for 0–5 months.
|
Months (m) |
Calculation |
Total Cost ($) |
|---|---|---|
|
0 |
20(0) + 30 |
30 |
|
1 |
20(1) + 30 |
50 |
|
2 |
20(2) + 30 |
70 |
|
3 |
20(3) + 30 |
90 |
|
4 |
20(4) + 30 |
110 |
|
5 |
20(5) + 30 |
130 |
Important Observation
Each row of the table shows a possible situation described by the equation.
Converting Tables into Ordered Pairs
To graph a relationship, each row can be written as an ordered pair.
For the gym membership model:
(0, 30)
(1, 50)
(2, 70)
(3, 90)
(4, 110)
(5, 130)
The first coordinate represents the number of months.
The second coordinate represents the total cost.
Important Observation
The meaning of each coordinate depends on the variables being modeled.
Graphing a Mathematical Model
A graph provides a visual representation of a mathematical relationship.
Steps for Creating an Accurate Graph
-
Draw a coordinate plane.
-
Label the horizontal axis with the independent variable.
-
Label the vertical axis with the dependent variable.
-
Include appropriate units.
-
Choose a consistent scale.
-
Plot the ordered pairs accurately.
-
Draw the appropriate line or curve.
-
Include a descriptive title.
Example: Gym Membership
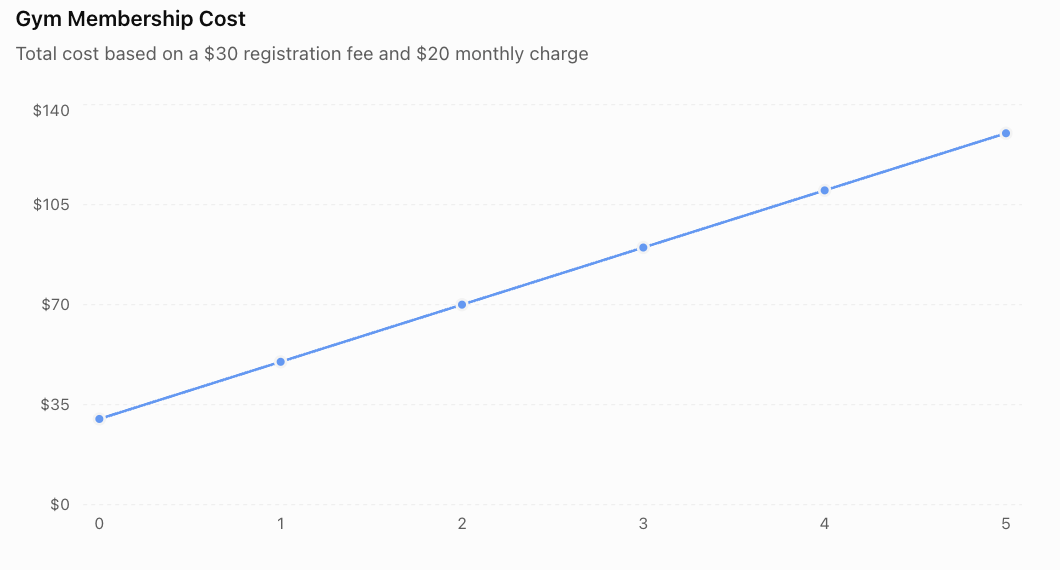
Interpreting the Graph
The graph is a straight line.
The slope is positive because the total cost increases each month.
The y-intercept is $30, representing the registration fee.
Important Observation
A graph makes the pattern of increasing cost easier to recognise.
Choosing Appropriate Graph Scales
The scale of a graph determines how values are displayed.
A good scale should:
-
Include all relevant values.
-
Use consistent intervals.
-
Be easy to read.
-
Avoid unnecessary empty space.
-
Clearly show important changes.
Example
Suppose total costs range from $30 to $130.
A reasonable vertical scale might increase by $20 per major interval.
An unsuitable scale might increase by $1 per major interval, requiring a very large graph.
Important Observation
Poorly chosen scales can make graphs difficult to interpret or create misleading visual impressions.
Interpreting Mathematical Models
A model is useful only if its mathematical results can be explained in the context of the original situation.
Worked Example: Water Tank
Equation:
V = 200 − 8t
where:
-
V = water volume in litres.
-
t = time in minutes.
Question: How Much Water Remains After 10 Minutes?
V = 200 − 8(10)
V = 200 − 80
V = 120 L
Question: When Will the Tank Be Empty?
Set V = 0.
0 = 200 − 8t
8t = 200
t = 25 minutes
Interpretation
If the draining rate remains constant, the tank will be empty after 25 minutes.
Important Observation
The model is meaningful only while the tank contains water.
The physical domain is:
0 ≤ t ≤ 25
Negative water volumes are not physically meaningful.
The Importance of Assumptions
A mathematical model often depends on assumptions.
An assumption is a condition accepted as true for the purpose of simplifying a problem.
Example: Water Tank
The equation:
V = 200 − 8t
assumes that:
-
The initial volume is exactly 200 L.
-
Water drains at a constant rate.
-
No additional water enters the tank.
-
There are no leaks other than the modeled outflow.
If these conditions change, the model may no longer be accurate.
Important Observation
A mathematical model is only as useful as its assumptions and the quality of its data.
Comparing Two Mathematical Models
One of the most useful applications of algebraic modeling is comparing alternatives.
Worked Example: Two Mobile Phone Plans
A customer is choosing between two plans.
Plan A
-
Monthly base fee: $15.
-
Additional cost: $4 per GB of data.
Plan B
-
Monthly base fee: $35.
-
Additional cost: $2 per GB of data.

Step 1: Define Variables
d = data used in GB
C = monthly cost in dollars
Step 2: Write Equations
Plan A:
Cₐ = 4d + 15
Plan B:
Cᵦ = 2d + 35
Step 3: Create a Table
|
Data (GB) |
Plan A ($) |
Plan B ($) |
|---|---|---|
|
0 |
15 |
35 |
|
5 |
35 |
45 |
|
10 |
55 |
55 |
|
15 |
75 |
65 |
|
20 |
95 |
75 |
Step 4: Graph the Relationships
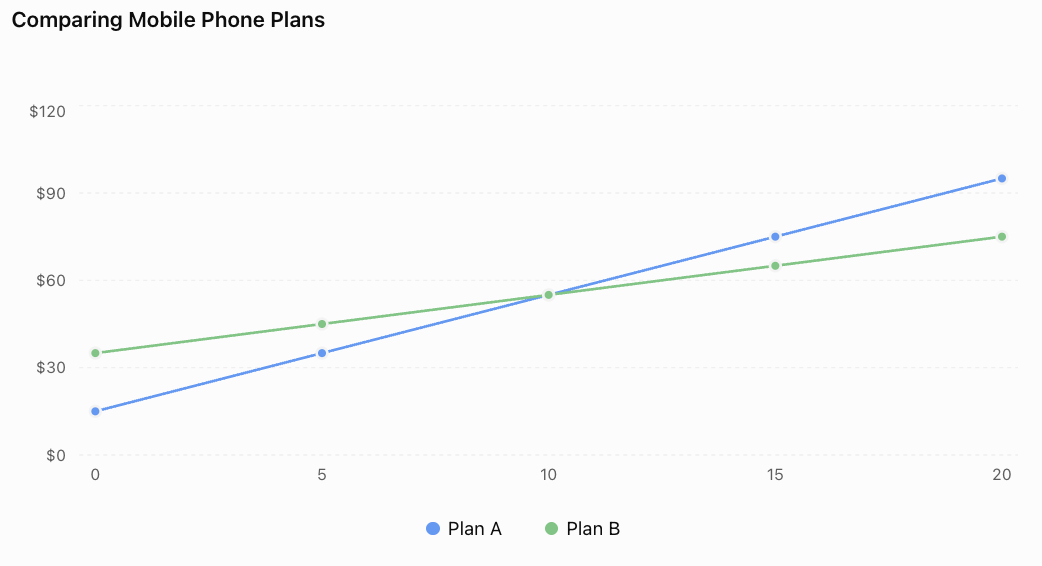
Step 5: Find the Break-Even Point
At the break-even point, both plans have the same cost.
4d + 15 = 2d + 35
2d = 20
d = 10 GB
Substitute:
C = 4(10) + 15
C = $55
Conclusion
-
Plan A is cheaper below 10 GB.
-
Both plans cost the same at 10 GB.
-
Plan B is cheaper above 10 GB.
Important Observation
The intersection of two linear models represents a situation where both produce the same output.
Interpolation and Extrapolation
Mathematical models can be used to estimate unknown values.
Interpolation
Interpolation estimates values within the range of known data.
For example, if a table records costs at 5 GB and 10 GB, a model can estimate the cost at 7 GB.
Extrapolation
Extrapolation estimates values outside the known data range.
For example, a model based on data usage up to 20 GB might be used to predict the cost at 30 GB.
Important Observation
Extrapolation is less reliable when conditions may change outside the observed range.
A mobile provider might introduce additional charges, discounts, or data limits.
Evaluating Model Accuracy
A mathematical model should be checked against real data whenever possible.
Example: Predicted and Actual Sales
A shop predicts weekly sales using:
S = 20w + 100
where:
-
S = predicted sales.
-
w = number of weeks.
Suppose the actual sales are:
|
Week |
Predicted Sales |
Actual Sales |
|---|---|---|
|
0 |
100 |
102 |
|
1 |
120 |
118 |
|
2 |
140 |
145 |
|
3 |
160 |
157 |
|
4 |
180 |
184 |
The model is reasonably close to the observed data, but it is not exact.
Calculating Prediction Error
For week 2:
Predicted sales = 140
Actual sales = 145
Error = Actual − Predicted
Error = 145 − 140
Error = 5
The model underestimated sales by 5 units.
Important Observation
Differences between predicted and observed values help us evaluate the accuracy of a model.
Residuals and Model Evaluation
A residual is the difference between an observed value and the value predicted by a model.
Residual = Observed value − Predicted value
Example
A model predicts a temperature of 28°C.
The actual measured temperature is 30°C.
Residual = 30 − 28
Residual = +2°C
A positive residual means the observed value is higher than predicted.
A negative residual means the observed value is lower than predicted.
Important Observation
Patterns in residuals can indicate that a model does not adequately describe the data.
For example, consistently curved residual patterns may suggest that a nonlinear model would be more appropriate.
Linear and Nonlinear Models
Not every real-world relationship is linear.
Linear Model
A linear model has a constant rate of change.
Example:
C = 5n + 20
The cost increases by $5 for each additional item.
Nonlinear Model
A nonlinear model has a changing rate of change.
Example:
A = s²
The area of a square depends on the square of its side length.
|
Side Length (cm) |
Area (cm²) |
|---|---|
|
1 |
1 |
|
2 |
4 |
|
3 |
9 |
|
4 |
16 |
|
5 |
25 |
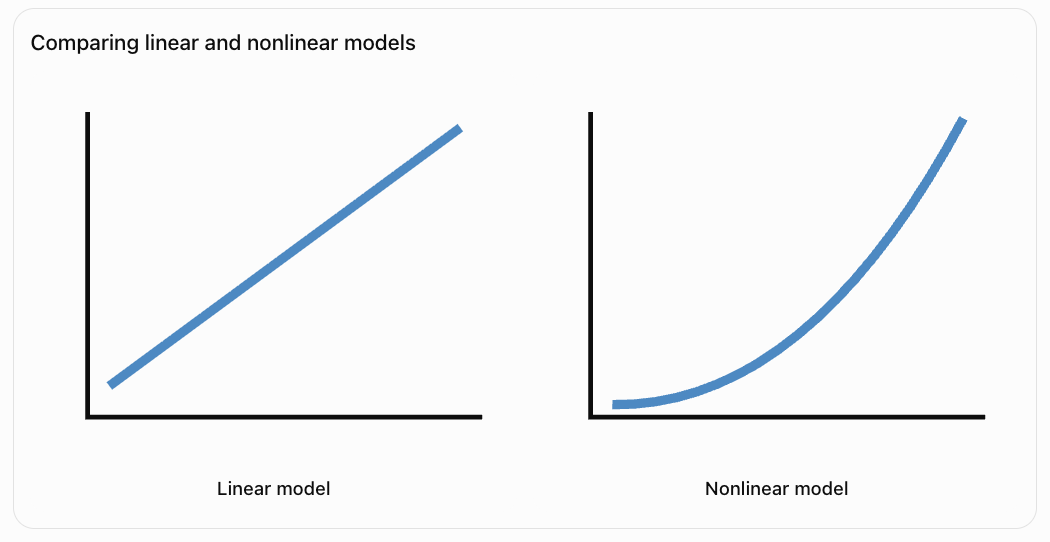
Important Observation
The type of equation should match the behaviour of the real-world situation.
Modeling with Inequalities
Some real-world problems involve restrictions rather than exact values.
Example: Budgeting
A student has $100 to spend on notebooks.
Each notebook costs $8.
Let n = number of notebooks.
The total cost must not exceed $100.
8n ≤ 100
Solving:
n ≤ 12.5
Because notebooks are purchased in whole numbers:
Maximum number of notebooks = 12
Important Observation
Inequalities are useful for modeling budgets, limits, capacities, and other constraints.
Modeling with Multiple Constraints
Some situations involve several restrictions.
Example: School Event
A school is planning a trip.
Each student ticket costs $12.
The school has a budget of $360.
The bus can carry a maximum of 25 students.
Let n = number of students.
Budget constraint:
12n ≤ 360
Therefore:
n ≤ 30
Bus capacity constraint:
n ≤ 25
Both constraints must be satisfied.
Conclusion
Maximum number of students = 25
Important Observation
A valid mathematical solution must satisfy every relevant constraint.
Mathematical Modeling in Science
Mathematical models are widely used to describe scientific relationships.
Example: Constant Speed
For motion at constant speed:
d = vt
where:
-
d = distance.
-
v = speed.
-
t = time.
If v = 6 m/s:
d = 6t

Table
|
Time (s) |
Distance (m) |
|---|---|
|
0 |
0 |
|
2 |
12 |
|
4 |
24 |
|
6 |
36 |
|
8 |
48 |
Interpretation
The slope of the distance-time graph is 6 m/s.
The model assumes the object travels at a constant speed.
Important Observation
Scientific models connect mathematical equations to measurable physical quantities.
Mathematical Modeling in Business
Businesses use mathematical models to predict costs, revenue, and profit.
Example
A company sells reusable water bottles.
Selling price per bottle = $15
Variable production cost per bottle = $6
Fixed costs = $180
Revenue Model
R = 15n
Cost Model
C = 6n + 180
Profit Model
Profit = Revenue − Cost
P = 15n − (6n + 180)
P = 9n − 180
Break-Even Point
Set profit equal to zero.
0 = 9n − 180
9n = 180
n = 20
The company must sell 20 bottles to break even.
Important Observation
Algebraic models help businesses determine how many products must be sold before profit begins.
Communicating Mathematical Findings
A successful modeling project should communicate more than calculations.
A complete explanation should include:
-
The real-world problem.
-
Definitions of variables.
-
The mathematical equation.
-
A table of values.
-
An accurately labelled graph.
-
Calculations and predictions.
-
Interpretation of slope and intercepts.
-
Assumptions and limitations.
-
A clear conclusion.
Example of a Mathematical Conclusion
A student investigates a savings plan described by:
S = 15w + 40
A suitable conclusion would be:
"The model shows that the student begins with $40 and saves an additional $15 each week. The graph is linear because the savings increase at a constant rate. After 12 weeks, the predicted savings are $220. This prediction assumes the student continues saving the same amount each week."
Important Observation
Mathematical communication should explain what the numbers mean, not simply present the numbers.
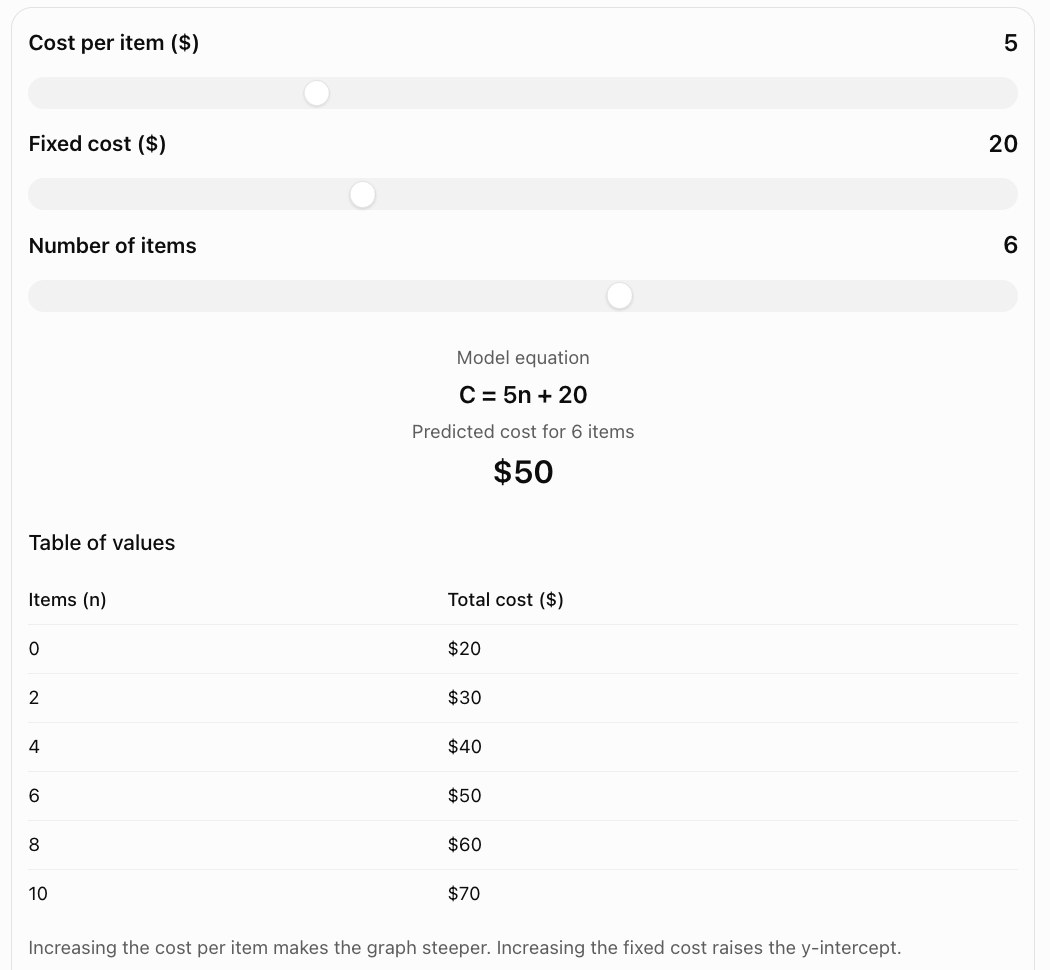
Interactive Algebraic Model Explorer
Explore a simple cost model by adjusting the cost per item and fixed starting cost.
Common Mistakes
Using variables without defining them
Every variable should have a clear meaning and appropriate units.
Confusing fixed costs and variable costs
Fixed costs do not depend on the quantity produced, while variable costs change with quantity.
Writing an incorrect equation
Check that the equation matches the information given in the problem.
Reversing independent and dependent variables
The independent variable is usually placed on the x-axis.
Creating inaccurate tables
Substitute values carefully and check calculations.
Using inconsistent graph scales
Graph intervals should be evenly spaced and clearly labelled.
Ignoring units
Mathematical results should include appropriate units.
Interpreting slope incorrectly
Slope represents the rate of change, not necessarily the starting value.
Ignoring realistic restrictions
Negative quantities or fractional people may not make sense in a practical model.
Assuming every model is linear
Some real-world relationships require nonlinear equations.
Extrapolating too far
Predictions outside the observed range may be unreliable.
Presenting calculations without explanations
A mathematical model should be interpreted in the context of the problem.
Key Terms
-
Algebraic Modeling: Representing real-world situations using algebraic relationships.
-
Mathematical Model: Mathematical representation of a real-world system.
-
Variable: Symbol representing a quantity that can change.
-
Independent Variable: Input quantity.
-
Dependent Variable: Output quantity.
-
Equation: Mathematical statement expressing equality.
-
Linear Equation: Equation representing a straight-line relationship.
-
Nonlinear Equation: Equation representing a relationship without constant rate of change.
-
Slope: Rate of change of a linear relationship.
-
y-Intercept: Output value when the input equals zero.
-
Initial Value: Starting quantity in a model.
-
Fixed Cost: Cost that remains unchanged as output changes within a specified range.
-
Variable Cost: Cost that changes with production or usage.
-
Table of Values: Organised list of related input and output values.
-
Ordered Pair: Pair of values written (x, y).
-
Graph: Visual representation of a mathematical relationship.
-
Domain: Set of allowed input values.
-
Range: Set of possible output values.
-
Constraint: Restriction placed on a mathematical model.
-
Assumption: Condition accepted as true when constructing a model.
-
Interpolation: Estimating values within a known data range.
-
Extrapolation: Estimating values outside a known data range.
-
Prediction: Estimate produced using a mathematical model.
-
Residual: Difference between an observed value and a predicted value.
-
Revenue: Money received from sales.
-
Profit: Revenue minus total cost.
-
Break-Even Point: Point where revenue equals cost.
-
Model Accuracy: How closely model predictions match real observations.
-
Model Limitation: Condition restricting the usefulness or accuracy of a model.
-
Mathematical Communication: Explaining mathematical ideas and results clearly using equations, graphs, tables, and written reasoning.
Key Takeaways
-
Algebraic modeling connects mathematics to real-world situations.
-
Models can include equations, tables, graphs, and written explanations.
-
Variables should be clearly defined.
-
Linear models have constant rates of change.
-
The slope represents the rate at which the output changes.
-
The y-intercept often represents an initial value.
-
Tables allow us to calculate and organise model values.
-
Graphs provide visual representations of relationships.
-
Intersections can represent break-even points or equal costs.
-
Models can be used to make predictions.
-
Realistic constraints must be considered.
-
Assumptions affect model accuracy.
-
Predictions should be checked against available evidence.
-
A successful model must be mathematically correct and meaningful in context.
-
Clear communication is an essential part of mathematical modeling.
Check Your Understanding
Creating Equations
-
What is algebraic modeling?
-
Why are variables important in mathematical models?
-
A student saves $8 each week and begins with $25. Write an equation for total savings.
-
A taxi charges $5 plus $3 per kilometre. Write an equation for the total fare.
-
A tank contains 150 L and loses 6 L per minute. Write an equation for the remaining water.
Creating Tables
-
Create a table for y = 2x + 3 when x = 0, 1, 2, 3, 4.
-
Create a table for C = 5n + 20 when n = 0, 2, 4, 6.
-
Explain how a table can be used to generate graph points.
-
What is an ordered pair?
-
Why should tables include units?
Graphing and Interpreting
-
What does the slope represent in y = 4x + 10?
-
What does the y-intercept represent in a cost model?
-
A graph shows total cost increasing by $6 per item. What is the slope?
-
What does the intersection of two cost graphs represent?
-
Why should graph axes be labelled?
Evaluating Models
-
What is an assumption?
-
Why should realistic constraints be considered?
-
What is the difference between interpolation and extrapolation?
-
How can a model be checked for accuracy?
-
Why is written explanation important in a mathematical project?
Answer Key
|
Question |
Answer |
|---|---|
|
1 |
Representing real-world situations mathematically |
|
2 |
They represent quantities that change |
|
3 |
S = 8w + 25 |
|
4 |
C = 3d + 5 |
|
5 |
V = 150 − 6t |
|
6 |
y = 3, 5, 7, 9, 11 |
|
7 |
C = 20, 30, 40, 50 |
|
8 |
Each row provides an ordered pair |
|
9 |
Pair of related values written (x, y) |
|
10 |
To identify measurement quantities |
|
11 |
Output increases by 4 per unit increase in x |
|
12 |
Initial or fixed cost |
|
13 |
6 dollars per item |
|
14 |
Equal costs at the same input |
|
15 |
To identify quantities and units |
|
16 |
Condition accepted as true for modeling |
|
17 |
To ensure solutions are realistic |
|
18 |
Interpolation estimates within the data range; extrapolation estimates beyond it |
|
19 |
Compare predictions with observed data |
|
20 |
To explain the meaning and limitations of results |
Extended Challenge
1. A company charges $12 per month plus $5 per service. Write an equation for total monthly cost.
2. A water tank contains 240 L and drains at 12 L/min. Determine when it becomes empty.
3. A business sells products for $18 each. Fixed costs are $300 and variable costs are $8 per item. Write equations for revenue, cost, and profit.
4. Determine the break-even quantity for Question 3.
5. Two companies charge C₁ = 4x + 25 and C₂ = 6x + 5. Determine when their costs are equal.
6. A student saves $15 per week, beginning with $60. How many weeks are required to reach $300?
7. A model predicts 120 customers, but 135 customers actually visit. Calculate the residual.
8. A rectangle has width x and length x + 3. Write an equation for its area.
9. Explain why the model in Question 8 is nonlinear.
10. Explain why a model may produce mathematically correct results that are unrealistic in the real world.
Extended Challenge Answers
|
Question |
Answer |
|---|---|
|
1 |
C = 5s + 12, where s is number of services |
|
2 |
20 minutes |
|
3 |
R = 18n; C = 8n + 300; P = 10n − 300 |
|
4 |
30 items |
|
5 |
x = 10; both cost $65 |
|
6 |
16 weeks |
|
7 |
+15 customers |
|
8 |
A = x(x + 3) = x² + 3x |
|
9 |
The equation contains x² and has a changing rate of change |
|
10 |
Models may ignore physical constraints or depend on unrealistic assumptions |
Final Project: Planning a School Fundraising Event
A school wants to raise money by selling tickets to a student concert.
The organisers must decide how many tickets need to be sold to cover costs and generate a profit.
Project Information
The event has the following costs:
-
Venue rental: $250
-
Equipment rental: $150
-
Advertising: $100
-
Additional cost per attendee: $2
Each ticket sells for $12.
Part A: Understanding the Situation
-
Identify the fixed costs.
-
Calculate the total fixed cost.
-
Identify the variable cost per attendee.
-
Identify the selling price per ticket.
-
Define appropriate variables.
Part B: Constructing Equations
-
Write an equation for total revenue.
-
Write an equation for total cost.
-
Write an equation for profit.
-
Explain the meaning of the slope in the revenue model.
-
Explain the meaning of the y-intercept in the cost model.
Part C: Creating Tables
-
Create a table for 0, 20, 40, 60, 80, and 100 tickets sold.
-
Calculate revenue for each quantity.
-
Calculate cost for each quantity.
-
Calculate profit for each quantity.
Part D: Graphing the Models
-
Draw a coordinate plane.
-
Label the x-axis Number of Tickets Sold.
-
Label the y-axis Amount ($).
-
Plot the revenue model.
-
Plot the cost model.
-
Identify the intersection.
Part E: Analysing Results
-
Determine the break-even number of tickets.
-
Calculate the profit from selling 80 tickets.
-
Calculate the profit from selling 120 tickets.
-
Determine the minimum number of tickets required to earn at least $500 profit.
-
Explain how the results could help the school plan the event.
Part F: Communicating Findings
Prepare a short mathematical report that includes:
-
A description of the fundraising problem.
-
Definitions of variables.
-
Revenue, cost, and profit equations.
-
A completed table of values.
-
A graph comparing revenue and cost.
-
Calculations showing the break-even point.
-
A recommendation for a realistic ticket-sales target.
-
An explanation of assumptions and limitations.
Project Answer Check
Fixed Costs
250 + 150 + 100 = $500
Revenue Equation
R = 12n
Cost Equation
C = 2n + 500
Profit Equation
P = R − C
P = 12n − (2n + 500)
P = 10n − 500
Completed Table
|
Tickets Sold |
Revenue ($) |
Cost ($) |
Profit ($) |
|---|---|---|---|
|
0 |
0 |
500 |
−500 |
|
20 |
240 |
540 |
−300 |
|
40 |
480 |
580 |
−100 |
|
60 |
720 |
620 |
100 |
|
80 |
960 |
660 |
300 |
|
100 |
1200 |
700 |
500 |
Break-Even Point
Set revenue equal to cost.
12n = 2n + 500
10n = 500
n = 50 tickets
The school must sell 50 tickets to break even.
Profit from 80 Tickets
P = 10(80) − 500
P = $300
Profit from 120 Tickets
P = 10(120) − 500
P = $700
Tickets Required for $500 Profit
10n − 500 ≥ 500
10n ≥ 1000
n ≥ 100
The school must sell at least 100 tickets.
Evaluating the Model
The model assumes that:
-
Every ticket sells for $12.
-
Every attendee incurs an additional cost of $2.
-
Fixed costs remain unchanged.
-
All tickets sold correspond to paying attendees.
-
The venue can accommodate the expected number of students.
If the venue has a maximum capacity of 90 students, a profit of $500 would not be achievable under the existing pricing model.
Example Conclusion
The algebraic model shows that the concert must sell at least 50 tickets to cover its costs. Selling 80 tickets would generate a profit of $300, while selling 100 tickets would generate $500. The school should aim to sell at least 100 tickets if the venue capacity allows. The model is useful for planning, but actual results may differ if expenses change or ticket sales are lower than expected.
Final Reflection
Algebraic modeling connects mathematical knowledge with practical decision-making.
By creating equations, generating tables, constructing graphs, and interpreting results, we can investigate complex situations using clear mathematical reasoning.
A successful modeling project should not simply produce calculations. It should explain what the calculations mean, evaluate the assumptions involved, and communicate useful conclusions.
The most important principle is that mathematics becomes especially powerful when equations, tables, graphs, and written explanations are used together to understand real-world problems.