Introduction to Graphing
4. Slope as Rate of Change
Learning outcomes
- I can explain slope as a measure of rate of change.
- I can calculate slope from graphs and tables.
- I can compare the steepness of different lines.
- I can interpret slope in real-world contexts.
- I can explain how slope relates to linear relationships.
Slope as Rate of Change
Introduction
Imagine two cyclists travelling along a straight road.
One cyclist travels 10 metres every second, while the other travels 5 metres every second.
Both cyclists are moving at constant speeds, but the first cyclist covers distance twice as quickly.
If we graph distance against time, both cyclists produce straight lines. However, the first cyclist's line is steeper.
This illustrates one of the most important ideas in mathematics:
Slope measures the rate at which one quantity changes compared with another.
Slope is used to describe relationships involving speed, cost, temperature, population, height, and many other quantities.


What Is Slope?
The slope of a line measures how steep the line is and the direction in which it changes.
Slope is also called the gradient.
It describes how much the vertical coordinate changes compared with the horizontal coordinate.
Slope is represented by the letter m.
For a straight line:
Slope = Vertical change / Horizontal change
This is often remembered as:
Slope = Rise / Run
where:
-
Rise is the change in the y-coordinate.
-
Run is the change in the x-coordinate.
Example
Suppose a line rises 6 units while moving 3 units to the right.
Slope = 6/3
m = 2
This means that y increases by 2 units for every increase of 1 unit in x.
Important Observation
Slope describes a relationship between two changes, rather than the location of a single point.
Understanding Rise and Run
To calculate slope from a graph, identify two points on the line and determine the vertical and horizontal changes between them.
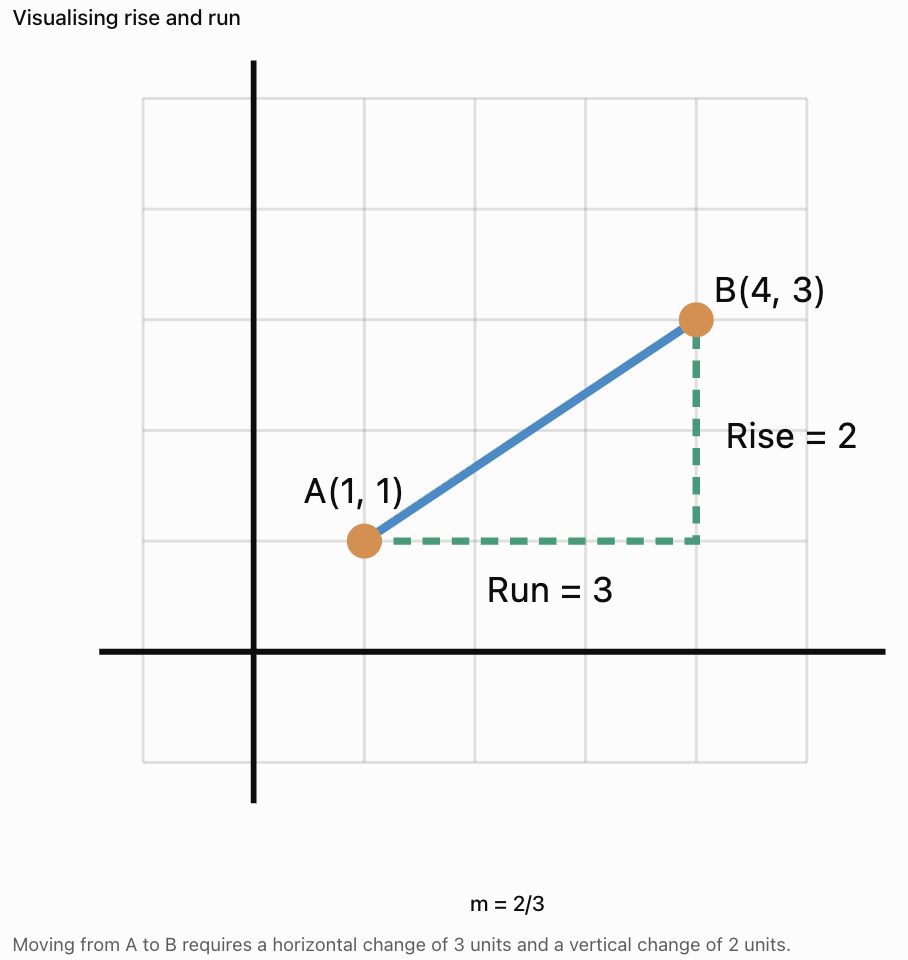
Calculation
Rise = 3 − 1 = 2
Run = 4 − 1 = 3
Slope = 2/3
m = 2/3 ≈ 0.67
Important Observation
Slope is a ratio. It does not have to be a whole number.
Calculating Slope from Two Points
If two points on a line are known, slope can be calculated using their coordinates.
Formula
m = (y₂ − y₁)/(x₂ − x₁)
where:
-
(x₁, y₁) is the first point.
-
(x₂, y₂) is the second point.
The denominator must not equal zero.
Worked Example
Find the slope of the line passing through:
A = (2, 3)
B = (6, 11)
Step 1: Identify the Coordinates
x₁ = 2
y₁ = 3
x₂ = 6
y₂ = 11
Step 2: Substitute
m = (11 − 3)/(6 − 2)
m = 8/4
m = 2
Interpretation
For every increase of 1 in x, y increases by 2.
Calculating Negative Slope
Slope can also be negative.
Worked Example
Find the slope between:
A = (1, 8)
B = (5, 2)
Step 1: Apply the Formula
m = (2 − 8)/(5 − 1)
m = −6/4
m = −3/2 = −1.5
Interpretation
For every increase of 1 in x, y decreases by 1.5.
Important Observation
A negative slope indicates a decreasing relationship as x increases.
Positive, Negative, Zero, and Undefined Slope
There are four important slope classifications.
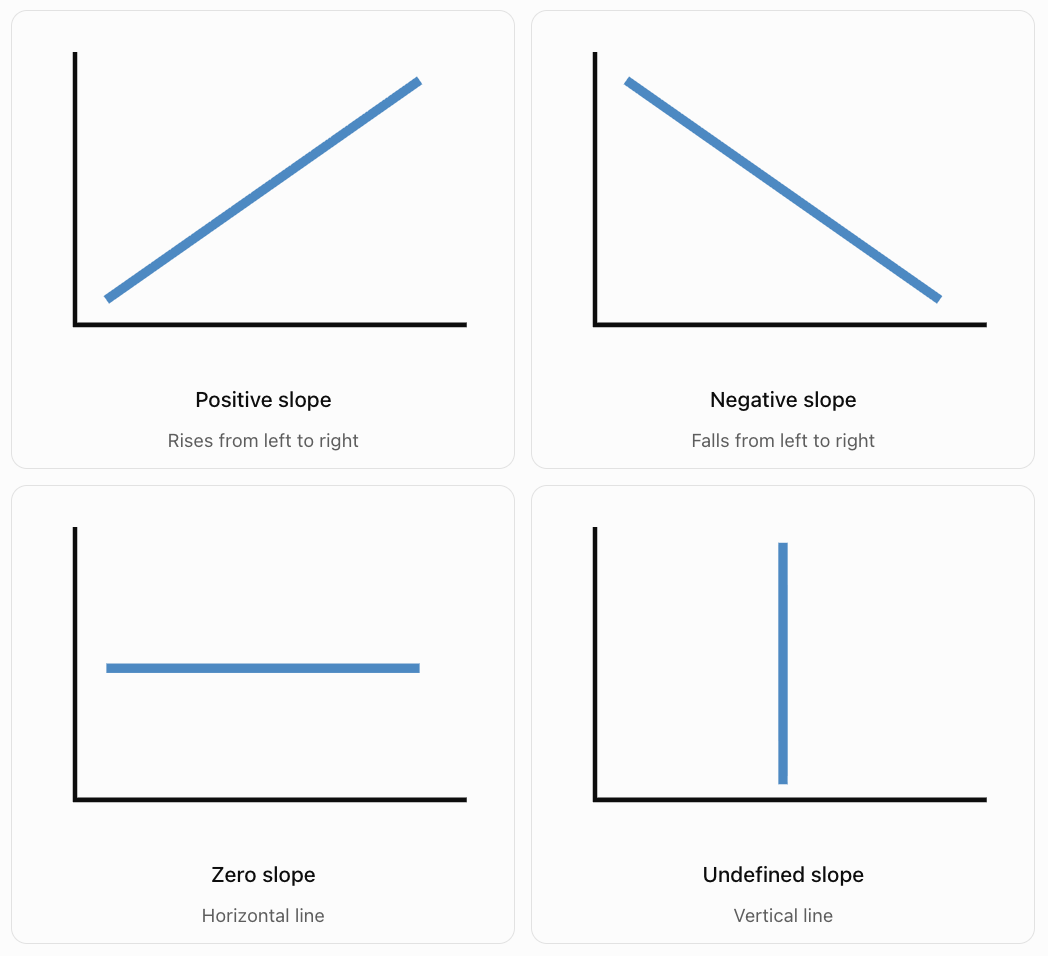
Positive Slope
A line rises from left to right.
Example:
y = 3x + 2
Slope = 3
Negative Slope
A line falls from left to right.
Example:
y = −2x + 5
Slope = −2
Zero Slope
A horizontal line has no vertical change.
Example:
y = 4
Slope = 0
Undefined Slope
A vertical line has no horizontal change.
Example:
x = 3
Slope = Undefined
Why Is Vertical Slope Undefined?
Slope = Rise / Run
For a vertical line:
Run = 0
Division by zero is undefined.
Therefore, a vertical line has an undefined slope.
Calculating Slope from a Table
Slope can be calculated using values in a table.
Worked Example
|
x |
y |
|---|---|
|
0 |
2 |
|
1 |
5 |
|
2 |
8 |
|
3 |
11 |
|
4 |
14 |
Step 1: Examine the Changes
As x increases by 1, y increases by 3.
Step 2: Calculate Slope
m = Δy/Δx
m = 3/1
m = 3
Important Observation
For a linear relationship, the ratio Δy/Δx remains constant between any two distinct points.
Tables with Unequal x-Intervals
Sometimes x-values do not increase by 1.
We must calculate the change in both variables.
Example
|
x |
y |
|---|---|
|
0 |
5 |
|
2 |
11 |
|
4 |
17 |
|
6 |
23 |
Calculation
Change in y = 11 − 5 = 6
Change in x = 2 − 0 = 2
Slope = 6/2
m = 3
Important Observation
Do not assume the slope is simply the difference between consecutive y-values.
Always compare the change in y with the corresponding change in x.
Recognising Constant Rate of Change
A linear relationship has a constant rate of change.
Example
|
Time (s) |
Distance (m) |
|---|---|
|
0 |
0 |
|
2 |
10 |
|
4 |
20 |
|
6 |
30 |
|
8 |
40 |
For each increase of 2 seconds, distance increases by 10 metres.
Slope = 10/2
m = 5 m/s
The slope is constant.
Important Observation
A constant rate of change is the defining feature of a linear relationship.
Comparing the Steepness of Lines
Slope describes how steep a line is.
For lines drawn using the same scales on both axes:
-
Larger absolute slope means a steeper line.
-
Smaller absolute slope means a less steep line.
Example
Consider three equations:
A: y = x
B: y = 2x
C: y = 4x
Their slopes are:
-
A: m = 1
-
B: m = 2
-
C: m = 4
Line C is the steepest.
Line A is the least steep.
Important Observation
The absolute value of slope determines steepness, while the sign determines whether the line rises or falls.
For example:
m = 4 and m = −4
have equal steepness but opposite directions.
Comparing Positive and Negative Slopes
Consider:
A: y = 3x + 1
B: y = −3x + 1
Both lines have slopes with absolute value 3.
Therefore, they have equal steepness when plotted using the same axis scales.
However:
-
Line A rises from left to right.
-
Line B falls from left to right.
Important Observation
A negative slope is not automatically less steep than a positive slope.
Compare absolute values when discussing steepness.
Slope and Linear Equations
Linear equations are often written in slope-intercept form:
y = mx + b
where:
-
m = slope.
-
b = y-intercept.
Example
Consider:
y = 4x + 3
The slope is:
m = 4
The y-intercept is:
b = 3
Interpretation
The line crosses the y-axis at (0, 3).
For every increase of 1 in x, y increases by 4.
Important Observation
In slope-intercept form, the coefficient of x gives the slope directly.
Slope and the y-Intercept
The slope and y-intercept describe different features of a line.
Slope
Describes how quickly y changes as x changes.
y-Intercept
Describes the value of y when x = 0.
Example
y = 5x + 20
Slope = 5
y-intercept = 20
This could represent a person who begins with $20 and saves $5 each week.
Interpretation
-
Starting savings = $20.
-
Weekly increase = $5.
Important Observation
The slope describes the rate of change, while the intercept describes the initial value.
Slope as Speed
One of the most important scientific applications of slope is motion.
On a distance-time graph:
Slope = Change in distance / Change in time
For motion in one direction at constant speed, this gives speed.

Worked Example
A cyclist travels 60 metres in 12 seconds.
Slope = 60/12
Slope = 5 m/s
Interpretation
The cyclist travels 5 metres every second.
Important Observation
A steeper distance-time line represents a greater speed when both axes use the same scales.
On a position-time graph, the slope represents velocity, which can be positive or negative.
Comparing the Speeds of Two Objects
Two cyclists travel at constant speeds.
Cyclist A
|
Time (s) |
Distance (m) |
|---|---|
|
0 |
0 |
|
2 |
12 |
|
4 |
24 |
|
6 |
36 |
Cyclist B
|
Time (s) |
Distance (m) |
|---|---|
|
0 |
0 |
|
2 |
8 |
|
4 |
16 |
|
6 |
24 |
Calculating the Slopes
Cyclist A:
m = 12/2 = 6 m/s
Cyclist B:
m = 8/2 = 4 m/s
Comparison
Cyclist A is travelling faster.
Cyclist A's distance-time graph is steeper.
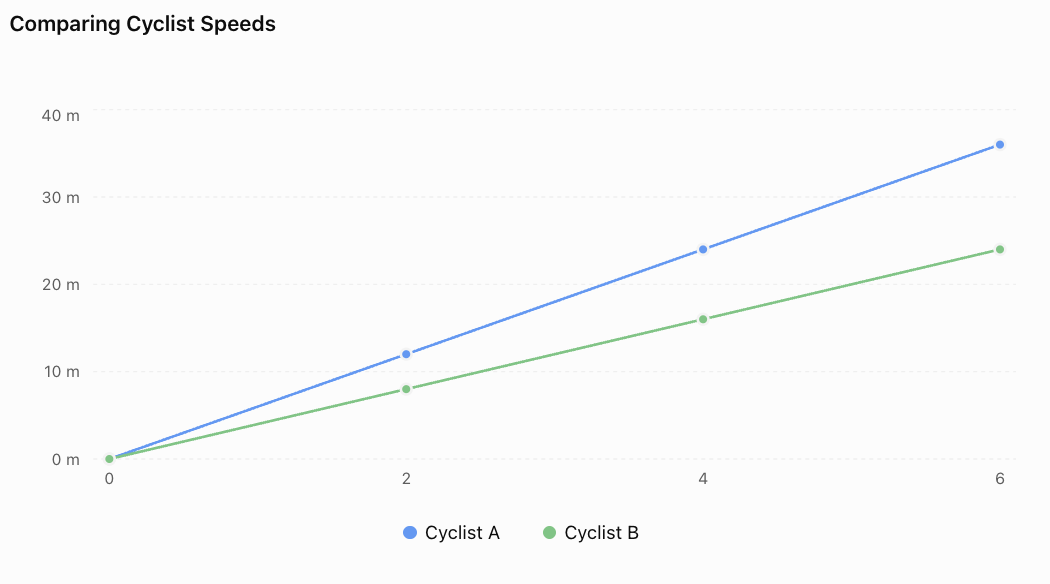
Important Observation
The graph with the greater positive slope represents the cyclist travelling faster.
Slope as a Cost per Unit
Slope can represent how much a cost changes when a quantity increases.
Example: Taxi Fare
A taxi company charges:
-
Starting fee: $4.
-
Additional charge: $3 per kilometre.
The equation is:
C = 3d + 4
where:
-
C = cost in dollars.
-
d = distance in kilometres.
Interpretation
Slope = 3 dollars per kilometre.
For every additional kilometre, the fare increases by $3.
Important Observation
Slope units are determined by dividing the units of the dependent variable by the units of the independent variable.
Here:
Slope units = dollars/km
Slope as a Rate of Heating
Scientists often use temperature-time graphs to describe heating and cooling.

Worked Example
Water temperature increases from 20°C to 50°C in 6 minutes.
Calculation
Slope = (50 − 20)/(6 − 0)
Slope = 30/6
Slope = 5°C/min
Interpretation
The water temperature increases at an average rate of 5°C per minute over the interval.
Important Observation
A positive slope indicates heating.
A negative slope indicates cooling.
A zero slope indicates constant temperature.
Slope as Population Growth
Slope can represent the rate at which a population changes.
Example
A town's population increases from 2,000 to 2,600 people over 3 years.
Slope = (2600 − 2000)/3
Slope = 600/3
Slope = 200 people/year
Interpretation
The average population increase is 200 people per year.
Important Observation
A constant population growth rate produces a linear model, although real populations often grow nonlinearly over longer periods.
Slope in Business and Finance
Businesses use slope to analyse costs, revenue, and profits.
Example
A company produces notebooks.
Its total production cost is:
C = 2n + 100
where:
-
C = total cost.
-
n = number of notebooks.
Interpretation
Slope = 2
Each additional notebook increases the total cost by $2.
y-intercept = 100
The fixed cost is $100.
Important Observation
Slope can represent marginal cost in a simple linear cost model.
Finding Slope from a Real-World Graph
Suppose a water tank is being drained.
The volume decreases from 150 L to 90 L over 10 minutes.
Step 1: Identify the Points
(0, 150)
(10, 90)
Step 2: Calculate Slope
m = (90 − 150)/(10 − 0)
m = −60/10
m = −6 L/min
Interpretation
The tank loses water at a rate of 6 litres per minute.
Important Observation
The negative sign indicates a decrease in water volume.
Parallel Lines and Slope
Two distinct nonvertical lines are parallel if they have the same slope.
Example
Line A:
y = 2x + 1
Line B:
y = 2x − 4
Both lines have slope 2.
Therefore, they are parallel.
Important Observation
Parallel lines have the same rate of change but may have different y-intercepts.
Distinct vertical lines are also parallel, even though their slopes are undefined.
Perpendicular Lines and Slope
Two nonvertical lines with nonzero slopes are perpendicular if their slopes are negative reciprocals.
Example
Line A has slope:
m₁ = 2
A perpendicular line has slope:
m₂ = −1/2
Rule
m₁ × m₂ = −1
Important Observation
A horizontal line and a vertical line are also perpendicular.
Slope and Linear Versus Nonlinear Relationships
A linear relationship has a constant slope.
A nonlinear relationship has a changing rate of change.
Example: Linear
y = 3x + 2
The slope is always 3.
Example: Nonlinear
y = x²
The slope changes depending on the position along the curve.
Comparison
|
Linear Relationship |
Nonlinear Relationship |
|---|---|
|
Constant rate of change |
Changing rate of change |
|
Straight-line graph |
Often curved graph |
|
Same slope throughout |
Slope varies |
|
Example: y = 2x + 1 |
Example: y = x² |
Important Observation
Constant slope is one of the most important ways to recognise a linear relationship.
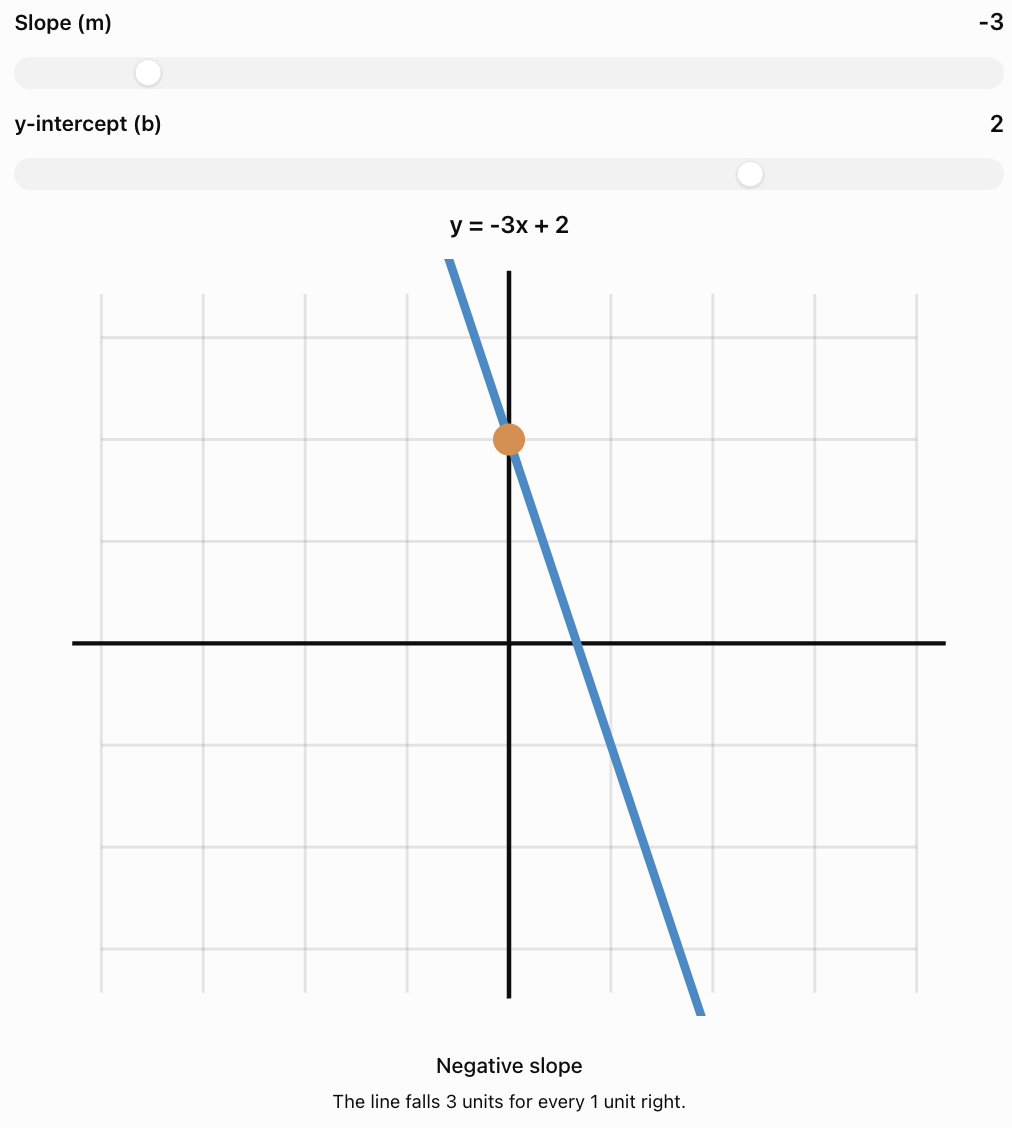
Interactive Slope Explorer
Adjust the slope and y-intercept to investigate how the equation and graph change.
Common Mistakes
Confusing rise and run
Slope is vertical change divided by horizontal change.
Reversing the subtraction order
When calculating slope, subtract coordinates in the same order in both numerator and denominator.
Ignoring negative signs
Negative slope indicates a decreasing relationship.
Assuming negative slopes are less steep
Steepness depends on absolute slope.
Using only the change in y
Slope must account for the change in x.
Forgetting units
Real-world slopes should include appropriate units.
Confusing slope and y-intercept
Slope represents rate of change; the y-intercept represents the starting value.
Assuming every graph has a constant slope
Nonlinear graphs have changing slopes.
Treating vertical slope as zero
Vertical lines have undefined slope.
Assuming every increasing graph is linear
An increasing relationship may be nonlinear if its rate of change is not constant.
Key Terms
-
Slope: Measure of a line's steepness and rate of change.
-
Gradient: Another name for slope.
-
Rate of Change: Change in one quantity relative to another.
-
Rise: Vertical change between two points.
-
Run: Horizontal change between two points.
-
Positive Slope: Slope of a line that rises from left to right.
-
Negative Slope: Slope of a line that falls from left to right.
-
Zero Slope: Slope of a horizontal line.
-
Undefined Slope: Slope of a vertical line.
-
Linear Relationship: Relationship with constant rate of change.
-
Nonlinear Relationship: Relationship with changing rate of change.
-
Slope-Intercept Form: Equation written y = mx + b.
-
y-Intercept: Point where a line crosses the y-axis.
-
x-Intercept: Point where a line crosses the x-axis.
-
Independent Variable: Input quantity, usually x.
-
Dependent Variable: Output quantity, usually y.
-
Constant Rate of Change: Equal changes in one variable produce proportional changes in another.
-
Absolute Value: Distance of a number from zero, ignoring sign.
-
Parallel Lines: Lines in the same plane that never intersect.
-
Perpendicular Lines: Lines that intersect at right angles.
-
Distance-Time Graph: Graph showing distance as a function of time.
-
Position-Time Graph: Graph showing position as a function of time.
-
Average Rate of Change: Change in output divided by change in input over an interval.
-
Steepness: Degree to which a line rises or falls relative to the horizontal axis.
Key Takeaways
-
Slope measures the rate of change of a linear relationship.
-
Slope is calculated as rise divided by run.
-
The slope formula is m = (y₂ − y₁)/(x₂ − x₁).
-
Positive slope indicates an increasing relationship.
-
Negative slope indicates a decreasing relationship.
-
Horizontal lines have zero slope.
-
Vertical lines have undefined slope.
-
Greater absolute slope means greater steepness when the axis scales are comparable.
-
Slope can be calculated from graphs, tables, equations, and coordinates.
-
Linear relationships have constant slope.
-
Slope often represents speed, cost per unit, growth rate, or another practical quantity.
-
The units of slope are output units divided by input units.
-
In y = mx + b, m is the slope and b is the y-intercept.
-
Parallel nonvertical lines have equal slopes.
-
Perpendicular lines with defined nonzero slopes have negative reciprocal slopes.
-
Understanding slope helps us analyse and predict real-world changes.
Check Your Understanding
Understanding Slope
-
What does slope measure?
-
What is meant by rise and run?
-
Write the formula for calculating slope using two points.
-
What does a negative slope indicate?
-
What is the slope of a horizontal line?
Calculating Slope
-
Find the slope between (1, 2) and (4, 8).
-
Find the slope between (2, 7) and (6, 3).
-
Find the slope between (−3, 1) and (3, 5).
-
Find the slope of y = 4x + 7.
-
Find the slope of y = −2x − 5.
Comparing Slopes
-
Which line is steeper: m = 2 or m = 5?
-
Which line is steeper: m = −6 or m = 3?
-
What can you conclude about two distinct nonvertical lines with the same slope?
-
What is the slope of a line perpendicular to a line with slope 4?
-
Explain why a vertical line has undefined slope.
Interpreting Real-World Slopes
-
A cyclist travels 45 metres in 9 seconds at constant speed. What is the slope of the distance-time graph?
-
A water tank loses 40 litres in 8 minutes at a constant rate. What is the slope of the volume-time graph?
-
A worker earns $15 per hour. What does the slope of the earnings-time graph represent?
-
A temperature-time graph has a slope of −3°C/min. Explain its meaning.
-
Why is a constant slope important when identifying a linear relationship?
Answer Key
|
Question |
Answer |
|---|---|
|
1 |
Rate of change and steepness of a line |
|
2 |
Rise is vertical change; run is horizontal change |
|
3 |
m = (y₂ − y₁)/(x₂ − x₁) |
|
4 |
y decreases as x increases |
|
5 |
0 |
|
6 |
2 |
|
7 |
−1 |
|
8 |
2/3 |
|
9 |
4 |
|
10 |
−2 |
|
11 |
m = 5 |
|
12 |
m = −6 |
|
13 |
They are parallel |
|
14 |
−1/4 |
|
15 |
Horizontal change is zero, requiring division by zero |
|
16 |
5 m/s |
|
17 |
−5 L/min |
|
18 |
Earnings increase by $15 for each hour worked |
|
19 |
Temperature decreases by 3°C per minute |
|
20 |
A linear relationship has the same rate of change throughout |
Extended Challenge
1. Calculate the slope between A(−4, 7) and B(2, −5).
2. A line passes through (3, 8) and (7, 20). Determine its slope and equation.
3. A table contains the following values. Determine whether the relationship is linear and calculate its slope.
|
x |
y |
|---|---|
|
0 |
12 |
|
2 |
8 |
|
4 |
4 |
|
6 |
0 |
4. A straight line passes through (−2, 5) and (4, 5). Find its slope and equation.
5. Determine the slope of a line perpendicular to y = −3x + 2.
6. A vehicle's position changes from 80 m to 20 m over 12 seconds. Calculate its average velocity.
7. A company has fixed costs of $250 and an additional production cost of $8 per item. Write an equation and interpret its slope.
8. Two lines have slopes −2/3 and 4/5. Which is steeper?
9. A water tank initially contains 180 L. Its volume decreases linearly to 60 L after 15 minutes. Write an equation for the remaining volume.
10. Explain why changing the y-intercept of a line does not change its slope.
Extended Challenge Answers
|
Question |
Answer |
|---|---|
|
1 |
−2 |
|
2 |
m = 3; y = 3x − 1 |
|
3 |
Linear; m = −2 |
|
4 |
m = 0; y = 5 |
|
5 |
1/3 |
|
6 |
−5 m/s |
|
7 |
C = 8n + 250; each item adds $8 |
|
8 |
m = 4/5, because 0.8 is greater than 2/3 |
|
9 |
V = 180 − 8t, for 0 ≤ t ≤ 22.5 |
|
10 |
Changing the intercept shifts the line vertically without changing its rate of change |
Final Investigation: Comparing Rates of Change
Three students conduct investigations involving movement, temperature, and water volume.
Each investigation produces a linear relationship.
Investigation A: Motion
A toy car travels along a straight track.
|
Time (s) |
Distance (m) |
|---|---|
|
0 |
0 |
|
2 |
6 |
|
4 |
12 |
|
6 |
18 |
|
8 |
24 |
Investigation B: Heating
A container of water is heated.
|
Time (min) |
Temperature (°C) |
|---|---|
|
0 |
20 |
|
2 |
28 |
|
4 |
36 |
|
6 |
44 |
|
8 |
52 |
Investigation C: Draining Water
Water drains from a tank.
|
Time (min) |
Volume (L) |
|---|---|
|
0 |
100 |
|
2 |
90 |
|
4 |
80 |
|
6 |
70 |
|
8 |
60 |
Part A: Calculating Slopes
-
Calculate the slope of Investigation A.
-
State the units of this slope.
-
Explain what the slope represents.
-
Calculate the slope of Investigation B.
-
State the units of this slope.
-
Calculate the slope of Investigation C.
-
Explain why the slope of Investigation C is negative.
Part B: Creating Graphs
-
Draw a separate coordinate graph for each investigation.
-
Label the horizontal and vertical axes.
-
Choose appropriate scales.
-
Plot the ordered pairs.
-
Draw straight lines through the points.
-
Identify which graphs have positive slopes.
-
Identify which graph has a negative slope.
Part C: Writing Equations
-
Write an equation describing the toy car's distance.
-
Write an equation describing the water temperature.
-
Write an equation describing the tank's remaining water volume.
-
Use the equations to predict the values after 10 units of time, using the appropriate time units for each investigation.
Part D: Evaluating Relationships
-
Explain why all three relationships are linear.
-
Explain why it is not meaningful to compare the numerical steepness of these three graphs without considering their different units and axis scales.
Investigation Answer Check
Investigation A
Slope = (24 − 0)/(8 − 0)
m = 3 m/s
Equation:
d = 3t
After 10 seconds:
d = 3 × 10 = 30 m
Investigation B
Slope = (52 − 20)/(8 − 0)
m = 4°C/min
Equation:
T = 4t + 20
After 10 minutes:
T = 4(10) + 20 = 60°C
Investigation C
Slope = (60 − 100)/(8 − 0)
m = −5 L/min
Equation:
V = 100 − 5t
After 10 minutes:
V = 100 − 5(10) = 50 L
Final Reflection
Slope provides a mathematical way to describe how quickly quantities change.
It can be calculated from graphs, tables, equations, and coordinates, and it has important meanings in real-world situations.
Understanding slope allows us to compare rates of change, recognise linear relationships, interpret scientific data, and make predictions.
The central principle is that a linear relationship has a constant rate of change, represented by the slope of its straight-line graph.