Data, Probability, and Decision Making
5. Capstone Data Project
Learning outcomes
- I can design and conduct a complete statistical study.
- I can collect, organize, and analyze data independently.
- I can apply statistical and probability concepts to real-world questions.
- I can communicate findings using graphs, tables, and statistical summaries.
- I can evaluate the strengths and limitations of my investigation.
Capstone Data Project
A capstone data project brings together the major ideas of statistics and probability in one complete investigation.
Instead of being given a finished data set and being told what calculation to perform, you take responsibility for the entire statistical process:
Question → Plan → Collect → Organize → Analyze → Interpret → Conclude → Evaluate → Communicate
The goal is not simply to calculate a mean or create a graph. The goal is to use data to answer a meaningful real-world question and to explain how strongly the evidence supports your conclusion.


A successful capstone project demonstrates that you can think statistically.
Choosing a Real-World Question
A good project begins with a question that can be investigated using data.
Possible areas include:
- school life
- sports
- transportation
- environment
- technology
- entertainment
- exercise
- consumer behaviour
- weather
- study habits
- sleep
- games and probability
A statistical question should anticipate variation.
For example:
Non-statistical question:
"What time does our school begin?"
There is one fixed answer.
Statistical question:
"How much time do students at our school spend travelling to school?"
Different students will have different travel times, so data must be collected and analysed.
Characteristics of a Strong Project Question
A useful research question should be:
Specific — It clearly states what is being investigated.
Measurable — Data can realistically be collected.
Statistical — Variation in the results is expected.
Manageable — The investigation can be completed with available time and resources.
Relevant — The answer has some meaningful interpretation.
Instead of:
"Are phones bad?"
a stronger question might be:
"Is there an association between daily recreational screen time and reported sleep duration among students in our grade?"
This identifies two measurable variables:
- daily recreational screen time
- sleep duration
Possible Capstone Questions
A project might investigate questions such as:
- How long does it typically take students to travel to school?
- Is there an association between sleep duration and reported tiredness?
- Which method of transportation is most common among students?
- Is there a relationship between height and arm span?
- Do older students spend more time on homework?
- Is there an association between weekly exercise time and resting heart rate?
- How accurately can students estimate one minute?
- Does reaction time differ between dominant and non-dominant hands?
- Is there an association between study time and test performance?
- Are the outcomes of a particular spinner or dice game consistent with its theoretical probabilities?
The question determines what type of data must be collected and which statistical tools are appropriate.
Writing a Research Question
Suppose you are interested in sleep.
A weak question might be:
"How much do people sleep?"
A stronger question is:
"How many hours of sleep do Grade 10 students at our school report getting on a typical school night?"
An even more analytical question might be:
"Is there an association between reported sleep duration and reported recreational screen time among Grade 10 students at our school?"
The final question identifies:
- the population
- the variables
- the type of relationship being investigated
Planning Before Collecting Data
A common mistake is to begin collecting data immediately.
Instead, first create an investigation plan.
Your plan should identify:
- research question
- purpose of the investigation
- population
- sample
- sampling method
- variables
- type of each variable
- method of data collection
- units
- possible sources of bias
- ethical considerations
- planned statistical analysis
- graphs that may be appropriate
Planning helps prevent problems that may be impossible to correct later.
Population and Sample
The population is the complete group you want to understand.
The sample is the smaller group from which you actually collect data.
For example:
Research question:
"How many hours do students at our school sleep on school nights?"
Population:
all students at the school
Sample:
120 selected students
We analyse the sample and then decide what the evidence suggests about the larger population.


Selecting a Representative Sample
A representative sample should reasonably reflect the population being studied.
Suppose your school contains students in Grades 7–12.
If you survey only:
students in your mathematics class
your sample may not represent the entire school.
A better approach might involve randomly selecting students from several grades.
Possible sampling methods include:
- simple random sampling
- systematic sampling
- stratified sampling
Convenience sampling may be easier, but it often creates greater risk of bias.
Sample Size
Generally, a larger sample provides more information than a very small sample.
Imagine estimating the average travel time of 2,000 students.
A sample of:
5 students
provides little evidence.
A carefully selected sample of:
200 students
would generally provide much stronger evidence.
However:
sample size cannot repair serious bias.
Surveying 1,000 members of the basketball program would still be a poor way to estimate the average height of all students if basketball players differ systematically from the school population.
Identifying Your Variables
A variable is a characteristic that can take different values.
Suppose the research question is:
"Is there an association between sleep duration and recreational screen time?"
The variables are:
sleep duration
and:
recreational screen time
Both are numerical variables.
Other investigations may involve categorical variables.
For example:
usual transportation method
might have categories such as:
- bus
- car
- train
- bicycle
- walking
Categorical, Discrete, and Continuous Data
Before collecting data, identify the type of each variable.
Categorical Data
Examples:
- favourite subject
- transportation method
- device type
- preferred sport
Discrete Numerical Data
Usually produced by counting.
Examples:
- number of siblings
- number of books read
- number of goals scored
Continuous Numerical Data
Usually produced by measurement.
Examples:
- height
- mass
- temperature
- travel time
- reaction time
The type of variable influences which graphs and statistics should be used.
Collecting Data
Data may be collected using:
- surveys
- questionnaires
- observations
- experiments
- measurements
- existing databases
- published data sets
The collection method should match the research question.
If you want to investigate student opinions, a survey may be appropriate.
If you want to investigate reaction time, an experiment may be better.
If you want to study historical temperatures, an existing reliable database may be appropriate.
Designing Good Survey Questions
Questions should be clear and neutral.
Poor question:
"Don't you agree that students spend far too much time on homework?"
This is leading.
Better:
"Approximately how much time did you spend on homework last night?"
Even better, if typical behaviour is the target:
"On a typical school night, approximately how many minutes do you spend completing homework?"
Every participant should interpret the question as similarly as possible.
Collecting Measurements
If your project involves measurements, establish a consistent procedure.
For example, when measuring reaction time:
- use the same test
- use the same device where possible
- give everyone the same instructions
- use the same units
- conduct the same number of trials
- record results to the same precision
Consistency makes comparisons more meaningful.
Repeated Measurements
Some quantities naturally vary from trial to trial.
Suppose a student's reaction times are:
245 ms
232 ms
251 ms
238 ms
241 ms
Using several trials provides more information than using one measurement.
You might calculate the mean:
(245 + 232 + 251 + 238 + 241) / 5
= 241.4 ms
Repeated trials can help reduce the influence of an unusually fast or slow individual measurement.
Organizing the Data
Raw data should be organized systematically.
A spreadsheet might contain:
| Student | Sleep |
Screen Time |
Grade |
|---|---|---|---|
| A | 7.5 | 2.0 | 10 |
| B | 6.0 | 4.5 | 10 |
| C | 8.0 | 1.5 | 10 |
| D | 6.5 | 3.5 | 10 |
| E | 7.0 | 2.5 | 10 |
Each:
row represents an observation
and each:
column represents a variable.
This structure makes analysis much easier.
Cleaning the Data
Before performing calculations, check the data.
Look for:
- missing values
- impossible values
- duplicated observations
- inconsistent units
- typing errors
- unusual values
- inconsistent category names
Suppose most sleep values are between:
5 and 10 hours
but one entry says:
75 hours
The value may actually have been intended as:
7.5 hours
Do not silently change it. Investigate the error if possible and document any correction.
Organizing Categorical Data
Categorical data can be summarized using frequency tables.
Suppose 40 students report their main transportation method:
| Method | Frequency |
|---|---|
| Bus | 14 |
| Train | 10 |
| Car | 8 |
| Walk | 6 |
| Bicycle | 2 |
Total:
40 students
Relative frequency for bus:
14/40 = 0.35
= 35%
Relative frequencies are especially useful when comparing groups of different sizes.
Choosing Appropriate Statistical Tools
Different questions require different analyses.
| Investigation | Useful Tools |
|---|---|
| Typical value | Mean, median, mode |
| Variation | Range, IQR |
| Categorical comparison | Frequencies, percentages, bar graph |
| Numerical distribution | Histogram, box plot |
| Change over time | Line graph |
| Relationship between two numerical variables | Scatter plot |
| Comparing groups | Centre, spread, box plots |
| Random outcomes | Probability, expected frequency, expected value |
The statistical method should be chosen because it helps answer the research question.
Measures of Centre
The three common measures of centre are:
mean
median
mode
For the data:
5, 6, 6, 7, 8, 10
Mean:
(5 + 6 + 6 + 7 + 8 + 10)/6
= 42/6
= 7
Median:
(6 + 7)/2
= 6.5
Mode:
6
Each statistic describes the data differently.
Choosing Between Mean and Median
Consider:
20, 22, 23, 24, 25, 26, 90
The value 90 is unusually high.
Mean:
230/7 ≈ 32.9
Median:
24
The median provides a better description of the typical value in this example because the mean is strongly affected by the extreme observation.
A good capstone project does not simply calculate statistics—it explains why particular statistics are appropriate.
Measures of Spread
Measures of centre should often be accompanied by measures of variability.
Useful measures include:
range = maximum − minimum
and:
IQR = Q₃ − Q₁
Suppose two groups both have a median of 70.
Group A:
68, 69, 70, 71, 72
Group B:
40, 55, 70, 85, 100
The same centre does not mean the distributions are similar.
Group B has much greater spread.
Examining Distributions
A distribution should be examined for:
- centre
- spread
- shape
- clusters
- gaps
- outliers
Common distribution shapes include:
- approximately symmetric
- skewed right
- skewed left
- bimodal


Recognizing the shape can help determine which summaries are most appropriate.
Creating Effective Graphs
Graphs should help the reader understand the evidence.
Possible choices include:
Bar graph — categorical comparisons
Histogram — distribution of numerical data
Box plot — centre, quartiles, spread, and comparison of distributions
Line graph — change over time
Scatter plot — relationship between two numerical variables
A graph should have:
- a descriptive title
- clearly labelled axes
- appropriate units
- sensible scales
- readable categories
Bar Graph Example
Suppose students report their preferred way of reviewing for a test:
| Method | Students |
|---|---|
| Practice questions | 18 |
| Notes | 11 |
| Videos | 7 |
| Flashcards | 4 |
A bar graph would make the comparison easy to see.
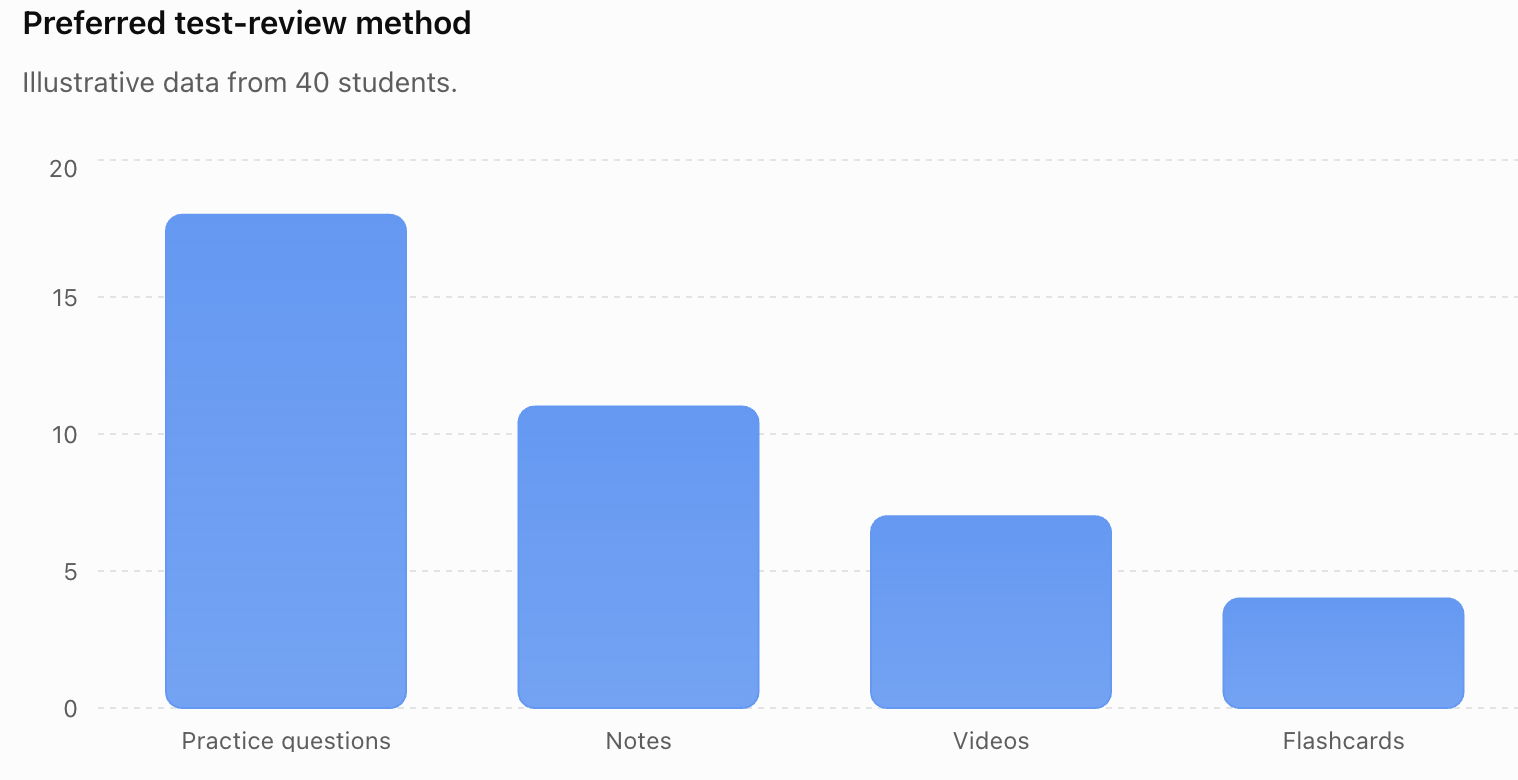
The graph should then be interpreted in words.
For example:
Practice questions were the most commonly selected review method, chosen by 18 of the 40 students.
Histograms
A histogram is useful for examining the distribution of numerical measurements.
For example, travel times could be grouped into intervals:
0–9 minutes
10–19 minutes
20–29 minutes
30–39 minutes
40–49 minutes
50–59 minutes
A histogram can reveal:
- typical values
- spread
- skewness
- clusters
- gaps
- possible outliers


Box Plots
Box plots are especially useful when comparing groups.
For example, you might compare:
sleep duration for Grade 9 students
with:
sleep duration for Grade 11 students
A box plot can show differences in:
- median
- IQR
- overall spread
- possible outliers


A strong analysis describes these differences numerically rather than simply saying that the graphs "look different."
Investigating Relationships with Scatter Plots
Suppose your project asks:
"Is there an association between study time and test score?"
Collect paired data:
| Study Time |
Test Score (%) |
|---|---|
| 1.0 | 58 |
| 1.5 | 62 |
| 2.0 | 68 |
| 2.5 | 67 |
| 3.0 | 75 |
| 3.5 | 79 |
| 4.0 | 83 |
| 4.5 | 87 |
A scatter plot helps reveal the relationship.
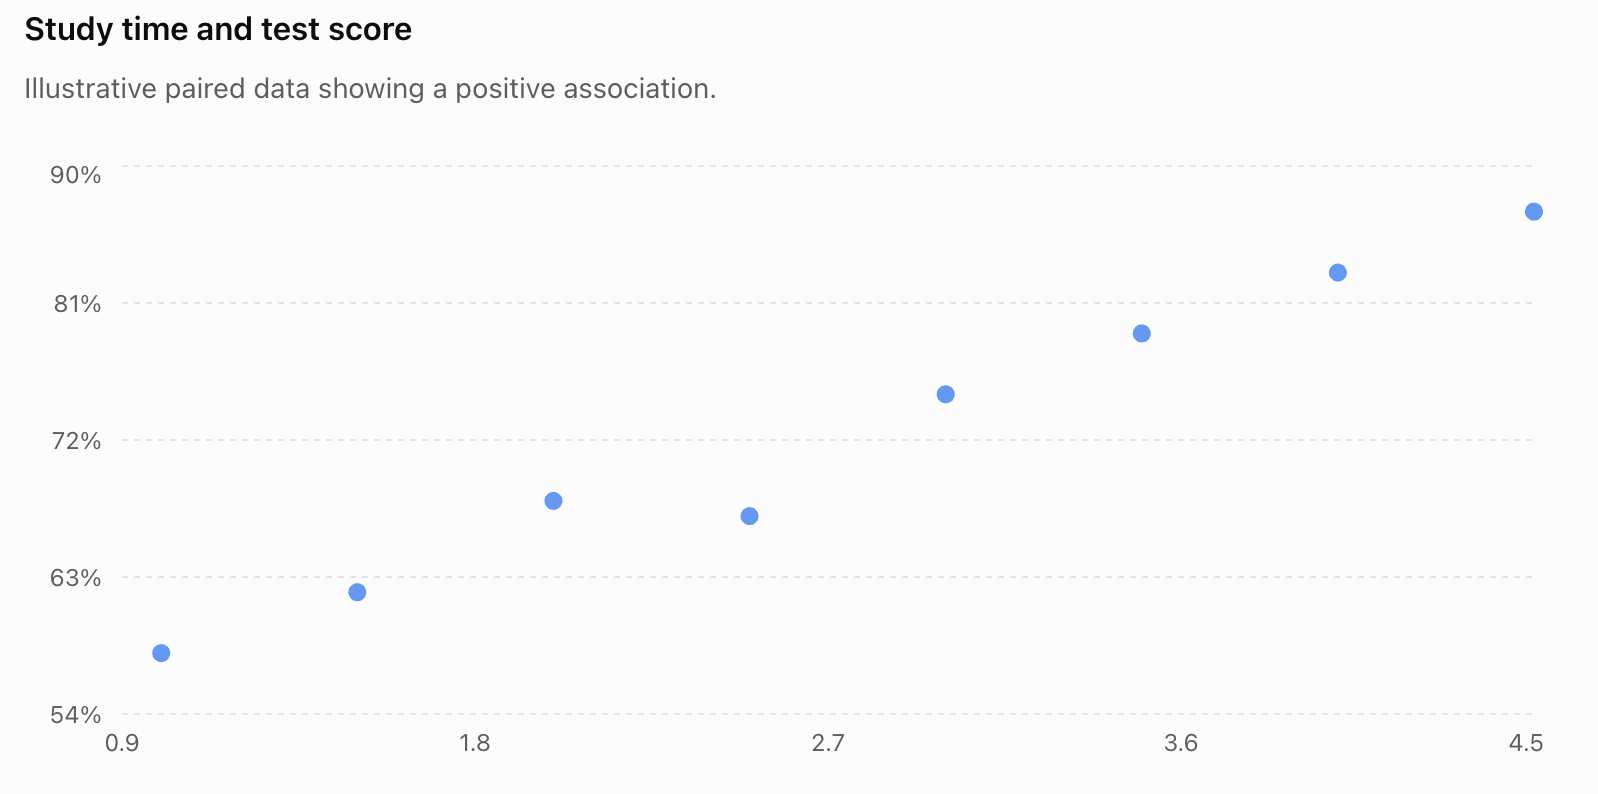
The data show a positive association:
students who studied longer tended to have higher scores in this illustrative data set.
But this does not automatically establish causation.
Correlation and Causation
Suppose your data show:
more sleep ↔ higher test scores
You should not automatically conclude:
more sleep caused higher test scores.
Other variables may include:
- study habits
- stress
- attendance
- health
- workload
- motivation
If your investigation is observational, a more appropriate conclusion is:
"Greater reported sleep duration was associated with higher test scores in the sample."
This describes what the evidence actually shows.
Using Probability in a Capstone Project
A capstone investigation can also focus on probability.
For example:
"Does this spinner behave according to its theoretical probabilities?"
Suppose a spinner has four equal sections.
The theoretical probability of each colour is:
1/4 = 25%
If it is spun 200 times, the expected frequency for each colour is:
200 × 1/4 = 50
Students can compare theoretical and experimental results.


Theoretical and Experimental Probability
Suppose 200 spins produce:
| Colour | Theoretical | Observed |
|---|---|---|
| Red | 50 | 54 |
| Blue | 50 | 46 |
| Green | 50 | 52 |
| Yellow | 50 | 48 |
The results are not exactly equal.
That is expected because of random variation.
Experimental probability for red:
54/200 = 0.27 = 27%
Theoretical probability:
25%
The difference alone does not prove that the spinner is biased.
Expected Value Investigations
Another possible project is to design or evaluate a game.
Suppose a game costs:
$2 to play
Possible outcomes are:
| Outcome | Probability | Prize |
|---|---|---|
| A | 1/10 | $10 |
| B | 2/10 | $3 |
| C | 7/10 | $0 |
Expected winnings:
E(X) = 10(1/10) + 3(2/10) + 0(7/10)
= 1 + 0.60
= $1.60
Expected net gain:
1.60 − 2.00
= −$0.40
Therefore, the player expects to lose:
$0.40 per play in the long run.
This could form the basis of an investigation into whether a game is mathematically fair.
Comparing Theoretical Predictions with Data
Probability projects can combine theory and experimentation.
For example:
- Calculate theoretical probabilities.
- Predict expected frequencies.
- Conduct the experiment.
- Record observed frequencies.
- Calculate experimental probabilities.
- Compare theoretical and experimental results.
- Explain differences using random variation.
- Evaluate whether the number of trials was sufficient.
This connects probability directly with statistical investigation.
Looking for Outliers
An outlier should be investigated rather than automatically removed.
Suppose most travel times are:
15–50 minutes
but one student reports:
180 minutes
Possible explanations include:
- the student genuinely travels a very long distance
- the student misunderstood the question
- the value was entered incorrectly
- unusual circumstances affected the journey
The correct response is not simply:
"Delete the outlier."
Instead ask:
Why is it unusual, and how does it affect the analysis?
Comparing Results With and Without an Outlier
Consider:
10, 12, 13, 14, 15, 16, 18, 80
Mean:
178/8 = 22.25
Median:
(14 + 15)/2 = 14.5
The value 80 has strongly increased the mean.
If 80 is a genuine observation, this is important information about the distribution.
The median may provide a better measure of a typical value, but the unusual observation should still be discussed.
Drawing Evidence-Based Conclusions
A conclusion should answer the original research question using actual evidence.
Weak conclusion:
"Students don't sleep much."
Better conclusion:
"The median reported sleep duration among the 120 sampled students was 6.9 hours, while the mean was 6.8 hours."
Stronger:
"The median reported sleep duration among the 120 sampled students was 6.9 hours. About 68% reported fewer than eight hours, suggesting that sleep durations below eight hours were common in this sample."
The conclusion becomes stronger because it refers directly to evidence.
Separate Results from Interpretation
It is useful to distinguish between:
Result:
"The median travel time was 31 minutes."
and:
Interpretation:
"This suggests that a typical student in the sample spent about half an hour travelling to school."
and:
Conclusion:
"The sample therefore provides evidence that travel times of approximately 30 minutes are typical among the students represented by the investigation."
These statements are related, but they perform different roles.
Avoid Overgeneralization
Suppose you survey 30 students from one Grade 10 class.
Your evidence applies directly to:
those 30 students.
It may provide some information about other Grade 10 students, but the ability to generalize depends on how representative the sample is.
It would be inappropriate to claim:
"Teenagers everywhere sleep 6.8 hours."
The conclusion must remain within the limits of the evidence.
Communicating Findings with Tables
Tables are useful when readers need exact values.
For example:
| Statistic | Sleep Duration |
|---|---|
| Sample size | 120 |
| Mean | 6.8 h |
| Median | 6.9 h |
| Q₁ | 6.2 h |
| Q₃ | 7.5 h |
| IQR | 1.3 h |
| Minimum | 4.5 h |
| Maximum | 9.5 h |
A table gives precise numerical information.
A graph can then help readers see the overall pattern.
Communicating Findings with Graphs
A good graph should be:
accurate
clearly labelled
easy to interpret
appropriate for the data
directly relevant to the research question
Avoid:
- unnecessary 3-D effects
- misleading scales
- missing units
- excessive decoration
- too many unrelated graphs
The goal is communication, not decoration.
Combining Graphs and Statistical Summaries
Strong statistical communication often combines several forms of evidence.
For example:
Histogram
Shows the shape of the distribution.
Median
Describes a typical value.
IQR
Describes the spread of the middle half.
Sample size
Shows how much data were collected.
Written interpretation
Explains what these results mean.
No single graph or statistic usually tells the complete story.
Writing the Final Report
A complete capstone report can be organized into the following sections.
Research Question
Clearly state what you investigated.
Background and Purpose
Explain why the question is interesting or useful.
Method
Explain:
- population
- sample
- sampling method
- variables
- collection procedure
Data
Present organized data or an appropriate summary.
Analysis
Include appropriate:
- graphs
- tables
- measures of centre
- measures of spread
- percentages
- probability calculations
- comparisons
- relationships
Findings
Describe the important patterns.
Conclusion
Answer the research question using evidence.
Evaluation
Discuss strengths, weaknesses, uncertainty, and improvements.
Evaluating Strengths
A strong investigation might have:
- a clearly defined research question
- an appropriate sample
- sufficient data
- consistent measurements
- neutral survey questions
- appropriate statistical calculations
- suitable graphs
- conclusions supported by evidence
- transparent reporting
Do not simply write:
"My project was good."
Identify specific strengths.
For example:
"A strength of the investigation was the use of stratified sampling across six grade levels, which reduced the risk that one grade would dominate the sample."
Evaluating Limitations
Every real investigation has limitations.
Possible limitations include:
- small sample size
- convenience sampling
- voluntary response
- non-response
- inaccurate measurements
- self-reported data
- unclear survey questions
- limited time
- missing data
- uncontrolled variables
- measurement precision
- unusual observations
- restricted population
A limitation should explain how it could affect the conclusion.
Weak:
"The sample was small."
Better:
"Only 25 students participated, so random differences between individuals may have had a relatively large effect on the sample statistics."
Self-Reported Data
Many student investigations use self-reported information.
For example:
"How many hours did you sleep last night?"
A participant may:
- forget
- estimate incorrectly
- round the answer
- misunderstand the question
- report what seems socially acceptable
Therefore, self-reported data should often be identified as a limitation.
Bias
Bias is a systematic influence that can move results away from an accurate representation of the population.
Possible forms include:
- selection bias
- voluntary response bias
- non-response bias
- wording bias
- measurement bias


Identifying bias is not simply a criticism of the project.
It demonstrates understanding of the quality of the evidence.
Random Variation Versus Bias
These ideas should not be confused.
Random variation causes unpredictable differences from sample to sample.
Bias systematically pushes results in a particular direction.
Increasing sample size generally helps reduce sampling variability.
However, simply collecting more observations does not necessarily remove bias.
A sample of 10,000 badly selected people can still be biased.
Reliability and Validity
Reliability asks:
Would the method give reasonably consistent results if repeated?
Validity asks:
Does the method actually measure what we intended to investigate?
For example, suppose we want to measure physical fitness using only student height.
Height can be measured very reliably.
But height is not a valid measure of overall fitness.
A strong project considers both reliability and validity.
Uncertainty
Statistical conclusions are rarely perfectly certain.
Sources of uncertainty include:
- sampling variation
- measurement error
- random processes
- missing data
- model assumptions
Appropriate statistical language includes:
"The data suggest..."
"The sample provides evidence that..."
"There appears to be an association..."
"Within this sample..."
This is not weak writing. It accurately represents what statistical evidence can establish.
Improving the Investigation
After identifying a limitation, propose a realistic improvement.
| Limitation | Possible Improvement |
|---|---|
| Sample too small | Collect data from more participants |
| Convenience sample | Use random or stratified sampling |
| Leading question | Rewrite using neutral language |
| Measurement inconsistency | Standardize the procedure |
| One measurement per person | Use repeated measurements |
| Missing groups | Include participants from those groups |
| Self-reported measurements | Use direct measurement where practical |
| Short investigation period | Collect data over a longer period |
Good evaluation connects each weakness to a practical improvement.
A Complete Example
Question
Is there an association between sleep duration and recreational screen time among Grade 10 students?
Plan
Population:
Grade 10 students at the school.
Sample:
80 students selected from several Grade 10 classes.
Variables:
- reported sleep duration in hours
- reported recreational screen time in hours
Collection
Students complete an anonymous questionnaire.
Organization
Responses are entered into a spreadsheet with one student per row.
Analysis
Calculate:
- mean and median sleep duration
- mean and median screen time
- range and IQR
- scatter plot
- possible correlation pattern
Possible Finding
Students reporting higher screen time tend to report somewhat lower sleep duration.
Appropriate Conclusion
"The sample showed a negative association between reported recreational screen time and reported sleep duration."
Inappropriate Conclusion
"Phones cause students to sleep less."
The investigation is observational and cannot establish that causal claim by itself.
Limitations
- self-reported data
- possible non-response
- other variables were not controlled
- data came from one school
- screen-time estimates may be inaccurate
Improvements
Future investigations could use:
- larger samples
- data from several schools
- device-recorded screen time
- sleep tracking
- additional variables such as workload or exercise
This turns a simple data collection exercise into a complete statistical investigation.
Capstone Project Workflow
A practical workflow is:
Choose a meaningful statistical question.
Plan the population, sample, variables, and method.
Predict what you think the data might show, if appropriate.
Collect the data carefully.
Check the data for errors and missing values.
Organize the data into useful tables.
Calculate appropriate statistical summaries.
Visualize the data using suitable graphs.
Analyze patterns, differences, distributions, or relationships.
Interpret what those patterns mean.
Conclude using evidence.
Evaluate strengths, limitations, uncertainty, and bias.
Improve the investigation by suggesting realistic changes.
Present the findings clearly.


Suggested Capstone Project Checklist
Before submitting a project, check that you can answer yes to most of these questions:
- Is my research question clearly stated?
- Is it genuinely statistical?
- Have I identified my population?
- Have I explained how my sample was selected?
- Have I identified my variables?
- Did I collect relevant data?
- Did I organize and check my data?
- Did I use appropriate statistical summaries?
- Did I choose appropriate graphs?
- Are my graphs correctly labelled?
- Did I interpret the graphs rather than simply include them?
- Did I answer the original research question?
- Did I support my conclusion with numerical evidence?
- Did I distinguish correlation from causation?
- Did I discuss possible bias?
- Did I identify limitations?
- Did I suggest realistic improvements?
- Are my conclusions no stronger than the evidence allows?
Common Mistakes
Starting without a clear research question
Collecting random data and deciding what to investigate afterward often produces a weak project.
Collecting data that do not answer the question
Every variable should have a purpose.
Using a biased sample
Convenient data are not necessarily representative data.
Using every possible statistical calculation
More calculations do not automatically create a better analysis. Choose statistics that help answer the question.
Choosing inappropriate graphs
Match the graph to the type of data and the purpose of the analysis.
Reporting graphs without interpreting them
Explain what the patterns actually mean.
Ignoring spread
Two groups can have similar averages but very different variability.
Deleting outliers automatically
Investigate unusual observations before deciding how to treat them.
Confusing association with causation
Observational data generally cannot establish causation by themselves.
Making claims beyond the population studied
A small sample from one school does not necessarily represent all teenagers.
Hiding inconvenient results
A statistical investigation should report the evidence honestly, even when the results do not support the original prediction.
Ignoring limitations
Recognizing limitations strengthens the investigation because it demonstrates critical statistical reasoning.
Key Terms
Capstone project — a culminating investigation that combines multiple skills and concepts into a complete study.
Statistical investigation — a systematic process of answering a question using data.
Research question — the specific question an investigation attempts to answer.
Population — the complete group about which conclusions are intended.
Sample — the subset of the population from which data are collected.
Representative sample — a sample that reasonably reflects important characteristics of the population.
Variable — a characteristic that can take different values.
Categorical data — observations classified into groups or categories.
Numerical data — observations represented by numerical measurements or counts.
Frequency — the number of times an outcome or category occurs.
Relative frequency — the proportion of observations belonging to an outcome or category.
Mean — the sum of numerical observations divided by their number.
Median — the middle observation in ordered data.
Mode — the most frequently occurring value or category.
Range — the difference between the maximum and minimum.
Interquartile range (IQR) — Q₃ − Q₁, describing the spread of the middle 50% of observations.
Distribution — the overall pattern of values in a data set.
Outlier — an observation unusually distant from the rest of the data.
Correlation — a statistical association between variables.
Expected frequency — the number of occurrences predicted from a probability model over a specified number of trials.
Expected value — the probability-weighted average numerical outcome of a random process.
Bias — a systematic influence that can distort results.
Random variation — natural unpredictable differences produced by sampling or random processes.
Reliability — the consistency of measurements or procedures.
Validity — the extent to which an investigation measures what it intends to measure.
Limitation — a feature of an investigation that restricts the strength or generalizability of its conclusions.
Key Takeaways
- A capstone data project combines the complete statistical investigation process in one independent study.
- Strong investigations begin with specific, measurable statistical questions.
- Planning should occur before data collection.
- The population, sample, sampling method, and variables should be clearly identified.
- Representative sampling is important when making conclusions about a population.
- Data should be collected consistently and checked before analysis.
- Statistical tools should be selected according to the question and type of data.
- Measures of centre describe typical values, while measures of spread describe variability.
- Graphs and tables should clarify the evidence rather than simply decorate the presentation.
- Scatter plots can reveal associations, but association alone does not establish causation.
- Probability investigations can compare theoretical probabilities, expected outcomes, and experimental results.
- Conclusions should answer the original question and refer directly to numerical or graphical evidence.
- Strong conclusions acknowledge uncertainty.
- Limitations should explain how weaknesses could affect the results.
- Improvements should directly address identified limitations.
- A successful capstone project demonstrates not only the ability to calculate statistics but the ability to use data to reason, evaluate evidence, and communicate a justified conclusion.
Check Your Understanding
- Explain why a capstone data project should begin with a research question rather than simply collecting interesting data.
- Rewrite "Are teenagers unhealthy?" as a specific statistical question that could realistically be investigated.
- A student wants to investigate travel time among all students at a school but surveys only 20 students from their homeroom. Identify a limitation and suggest an improvement.
- Explain why increasing the size of a strongly biased sample does not necessarily solve the problem.
- For each variable, classify it as categorical, discrete numerical, or continuous numerical: transportation method, number of siblings, height, favourite subject, daily screen time.
- A data set contains 12, 14, 15, 16, 16, 17, 18, 82. Explain why the mean and median may give very different impressions of a typical value.
- Explain when you would choose a bar graph, histogram, box plot, and scatter plot.
- Two groups have the same median but very different IQRs. What does this tell you about the groups?
- A scatter plot shows that students who report more exercise also report higher happiness scores. Write an appropriate statistical conclusion that does not incorrectly claim causation.
- A spinner is designed so that P(red) = 0.40. Calculate the expected number of red results in 500 spins. Explain why the actual number does not have to equal this value exactly.
- A student finds an unexpected outlier and immediately deletes it. Explain why this is poor statistical practice.
- Explain the difference between random variation and bias. Which problem can usually be reduced by increasing the sample size?
- Design a capstone investigation involving two numerical variables. State your research question, population, sample, variables, collection method, appropriate graph, and at least two statistical summaries you would use.
- Suppose your results do not support your original prediction. Explain what you should do when writing the final report.
- Imagine that you have completed your capstone project. Write an outline for the final presentation showing how you would communicate your question, method, data, graphs, statistical analysis, conclusion, strengths, limitations, and possible improvements.