Data, Probability, and Decision Making
| 站点: | Young Education |
| 课程: | Data and Probability Foundations |
| 图书: | Data, Probability, and Decision Making |
| 打印: | Guest user |
| 日期: | 2026年11月9日 星期一 16:39 |
1. Making Predictions from Data
Learning outcomes
- I can identify trends and patterns in data.
- I can use data to make predictions.
- I can evaluate the reliability of predictions.
- I can explain limitations of forecasting.
- I can justify predictions using evidence from data.
Making Predictions from Data
Data can help us understand what has happened in the past and make informed predictions about what might happen in the future.
A prediction is an estimate of an unknown or future value based on available information.
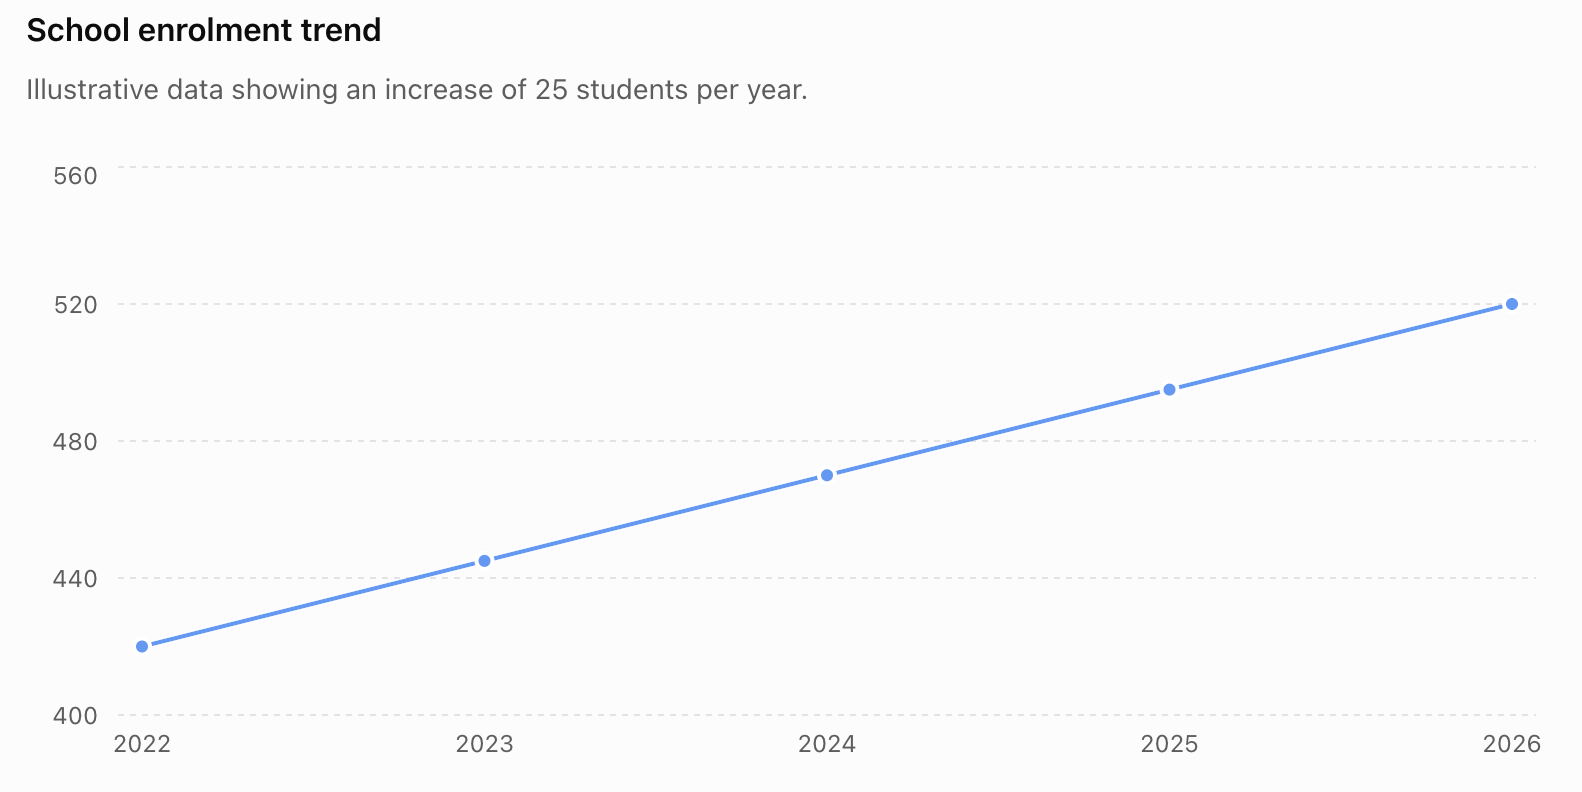
For example, suppose a school's enrolment has been:
| Year | Students |
|---|---|
| 2022 | 420 |
| 2023 | 445 |
| 2024 | 470 |
| 2025 | 495 |
| 2026 | 520 |
The number of students has increased by approximately 25 each year. If this pattern continues, we might predict:
2027 enrolment ≈ 545 students
This prediction is supported by the observed trend. However, it is still a prediction—not a guarantee.
Identifying Trends
A trend is the general direction in which data change.
Three common trends are:
Increasing trend — values generally increase.
Decreasing trend — values generally decrease.
No clear trend — values fluctuate without a consistent overall direction.
For example:
12, 15, 19, 22, 26
shows an increasing trend.
80, 73, 69, 61, 55
shows a decreasing trend.
20, 35, 18, 32, 21
does not show a simple consistent trend.
Trends Do Not Need to Be Perfect
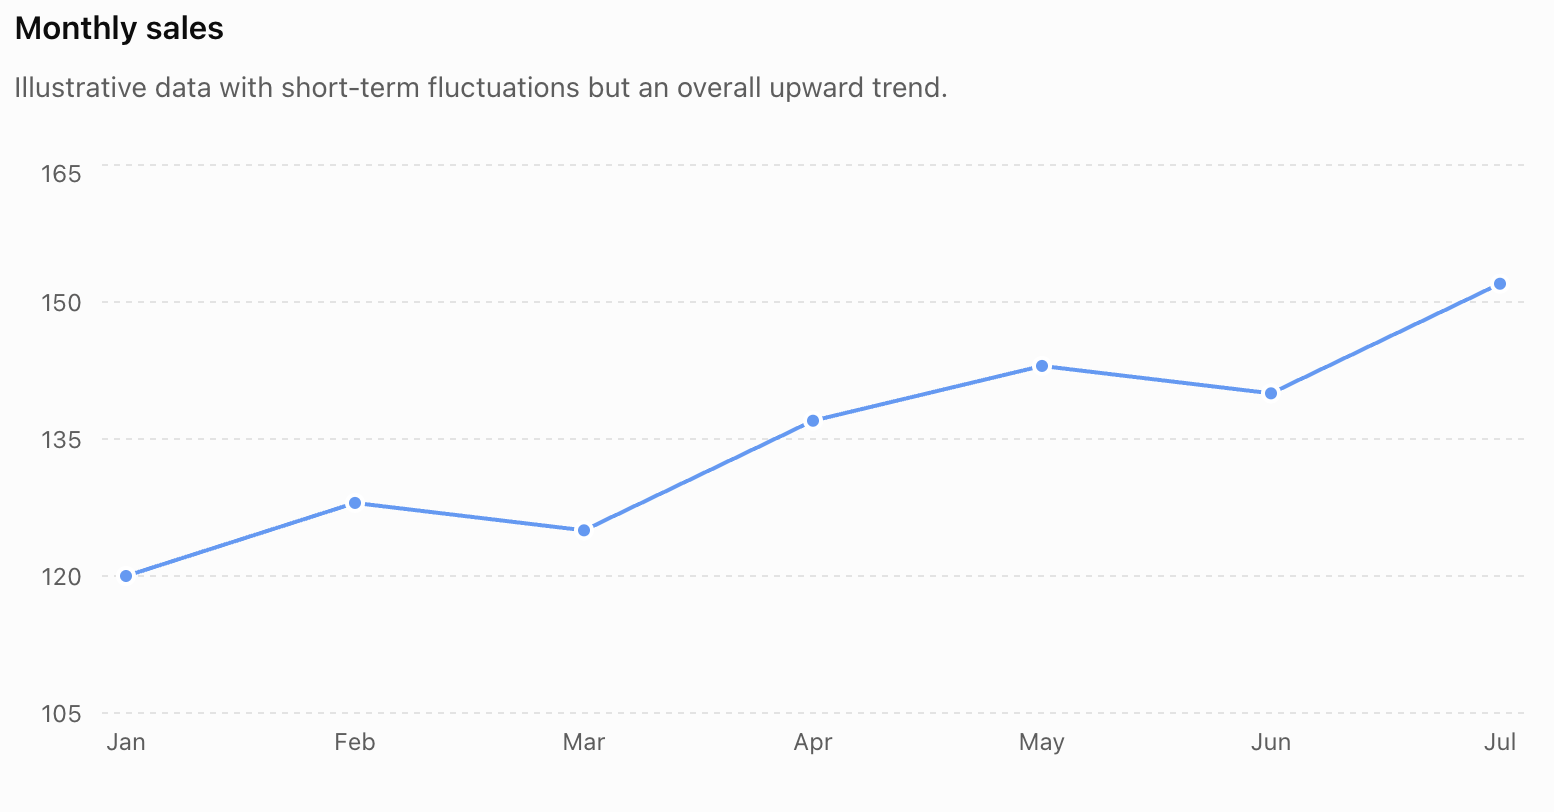
Real data rarely follow a perfectly smooth pattern.
Consider:
| Month | Sales |
|---|---|
| January | 120 |
| February | 128 |
| March | 125 |
| April | 137 |
| May | 143 |
| June | 140 |
| July | 152 |
Sales occasionally decrease, but the overall trend is upward.
We should therefore distinguish between short-term fluctuations and the broader pattern.
Patterns in Data
A pattern is a recognizable structure or regularity in data.
Patterns can include:
- constant increases or decreases
- repeating cycles
- seasonal changes
- proportional relationships
- accelerating growth
- slowing growth
- clusters
- unusual values
- relationships between variables
Recognizing the type of pattern helps us decide how predictions should be made.
Constant Change
Consider:
5, 8, 11, 14, 17
The difference between consecutive values is always:
+3
If the pattern continues, the next value would be:
20
This is a linear pattern because the change is constant.
Percentage Growth
Some quantities increase by a percentage rather than by a constant amount.
Suppose a population increases by 5% each year.
If the current population is 20,000:
Next year:
20,000 × 1.05 = 21,000
The following year:
21,000 × 1.05 = 22,050
The amount added becomes larger each year.
This produces an exponential pattern rather than a linear one.
Cyclical and Seasonal Patterns
Some patterns repeat.
For example, electricity consumption might rise every summer because of air-conditioning use and then fall during cooler months.
Retail sales may rise each December and fall in January.
This is a seasonal pattern.
If we ignored the seasonal cycle and simply extended a short-term increase, our prediction could be misleading.
Scatter Plots and Relationships
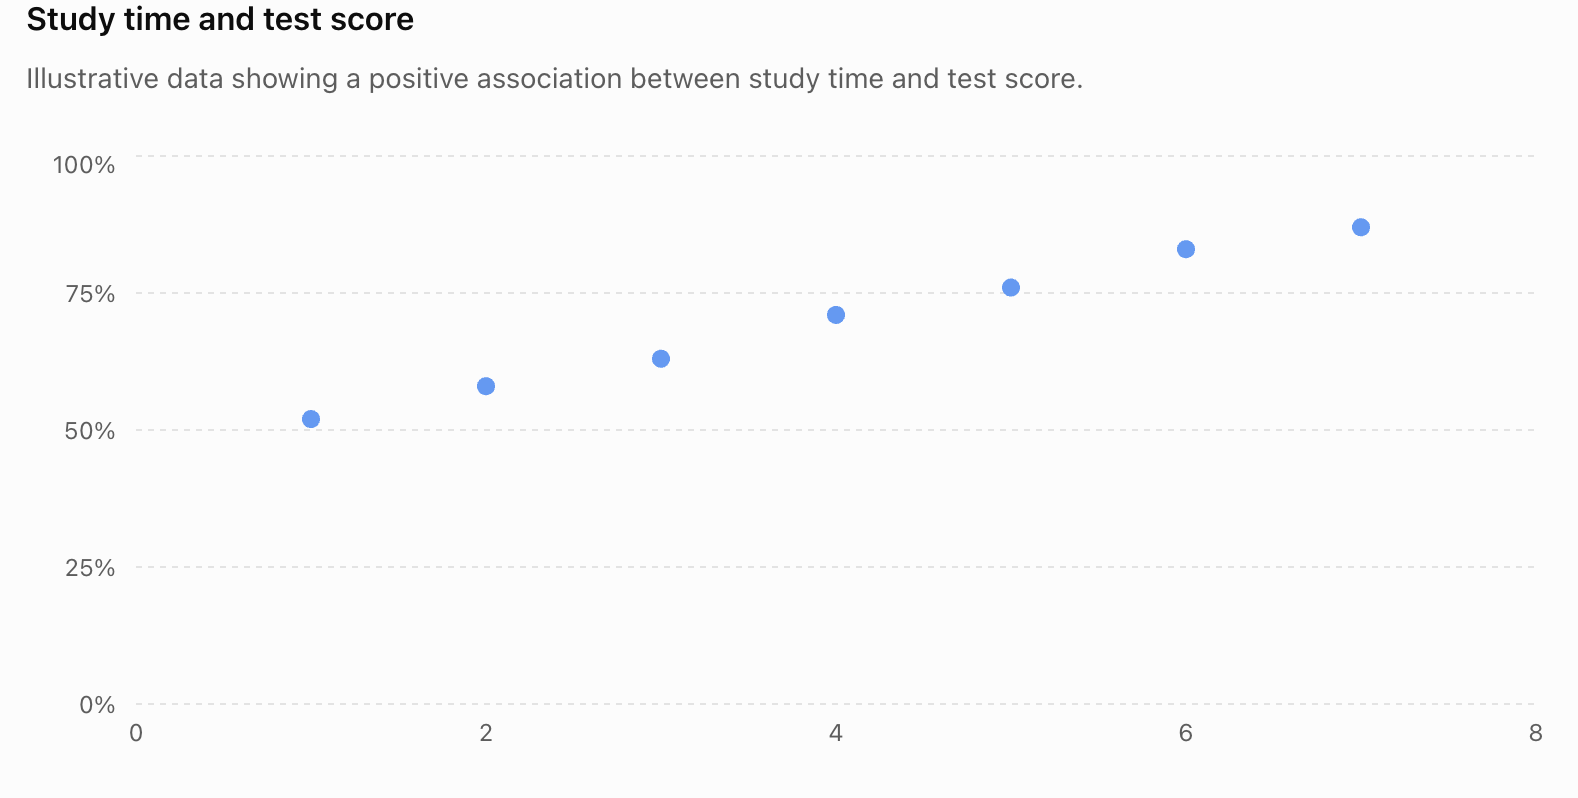
When data involve two numerical variables, a scatter plot can help reveal whether they are related.
For example, consider hours studied and test scores.
| Hours Studied | Test Score (%) |
|---|---|
| 1 | 52 |
| 2 | 58 |
| 3 | 63 |
| 4 | 71 |
| 5 | 76 |
| 6 | 83 |
| 7 | 87 |
2. Probability and Fairness
Learning outcomes
- I can determine whether a game or activity is fair.
- I can calculate expected outcomes.
- I can explain how probability affects fairness.
- I can design fair games and activities.
- I can evaluate fairness using mathematical reasoning.
Probability and Fairness
Probability provides a mathematical way to decide whether a game, competition, or random activity is fair.
In a simple two-player chance game, we often call the game fair when both players have the same probability of winning. More generally, when prizes, costs, or different outcomes are involved, fairness can be analysed using expected value: neither side should have a long-term mathematical advantage if the game is financially fair.
For example, suppose two players toss a fair coin.
- Player A wins if the coin lands heads.
- Player B wins if the coin lands tails.
Since:
P(heads) = 1/2
and:
P(tails) = 1/2
each player has the same probability of winning.
Therefore, the game is fair.
Probability and Fairness
For equally likely outcomes:
P(event) = number of favourable outcomes / total number of possible outcomes
A probability is always between:
0 and 1
where:
P(event) = 0 means impossible.
P(event) = 1 means certain.
For a fair six-sided die:
P(1) = P(2) = P(3) = P(4) = P(5) = P(6) = 1/6

Equal probabilities of individual outcomes do not automatically mean that every game using the die is fair. The rules determine which outcomes cause each player to win.
A Simple Fair Dice Game
Suppose:
- Player A wins if an odd number is rolled.
- Player B wins if an even number is rolled.
The possible outcomes are:
{1, 2, 3, 4, 5, 6}
Player A wins with:
{1, 3, 5}
Therefore:
P(A wins) = 3/6 = 1/2
Player B wins with:
{2, 4, 6}
Therefore:
P(B wins) = 3/6 = 1/2
Both players have equal probabilities of winning.
Therefore:
the game is fair.
An Unfair Dice Game
Now change the rules:
- Player A wins by rolling 1, 2, 3, or 4.
- Player B wins by rolling 5 or 6.
Then:
P(A wins) = 4/6 = 2/3
and:
P(B wins) = 2/6 = 1/3
Player A is twice as likely to win.
Therefore:
the game is unfair.
Notice that the die itself is still fair. It is the rules of the game that create the unfairness.
Fair Random Devices
A random device is fair when its intended basic outcomes are equally likely.
Examples include:
- a balanced coin
- a properly constructed six-sided die
- a spinner divided into equal sections
- well-shuffled identical cards
For a spinner divided into four equal sections:
P(each section) = 1/4 = 25%


If the sections are unequal in size, their probabilities will generally not be equal.
That does not necessarily make a game unfair, however. The rules and rewards could compensate for the unequal probabilities.
Fairness Is About the Whole Game
Consider a spinner with:
- red probability = 1/2
- blue probability = 1/4
- green probability = 1/4
If:
- Player A wins on red
- Player B wins on blue or green
then:
P(A wins) = 1/2
and:
P(B wins) = 1/4 + 1/4 = 1/2
The spinner has unequal colour probabilities, but the game is fair between the two players.
This illustrates an important principle:
Fairness depends on the probabilities created by the complete rules, not simply on whether every individual outcome is equally likely.
Theoretical Probability
Theoretical probability is calculated from the mathematical structure of an experiment.
For a fair die:
P(rolling a 6) = 1/6
This probability does not mean that exactly one of every six rolls must be a 6.
It describes what we expect over many trials.
Experimental Probability
Experimental probability is calculated from actual results:
experimental probability = number of times event occurs / total number of trials
Suppose a die is rolled 60 times and 6 appears 13 times.
Then:
experimental P(6) = 13/60 ≈ 0.217
The theoretical probability is:
P(6) = 1/6 ≈ 0.167
These values are different.
That does not automatically mean the die is unfair.
Random variation is expected, especially with relatively small numbers of trials.
Short-Term Results Can Look Unfair
Suppose two people play a perfectly fair coin-toss game ten times.
Player A might win seven games.
Player B might win three.
That result does not prove that the game was unfair.
Fairness means that both players had equal probabilities before each game—not that they must win exactly the same number of times.
As the number of trials becomes very large, experimental proportions often tend to move closer to their theoretical probabilities. This is connected to the law of large numbers.
Expected Outcomes
Probability can be used to calculate how many times we expect an event to occur.
The basic relationship is:
expected frequency = probability × number of trials
Suppose a fair die is rolled 600 times.
The probability of rolling a 6 is:
1/6
Therefore:
expected number of 6s = 1/6 × 600
= 100
We expect approximately 100 sixes.
This does not mean there must be exactly 100.
Expected Outcome Example
A coin is tossed 200 times.
What is the expected number of heads?
P(heads) = 1/2
Therefore:
expected heads = 1/2 × 200
= 100
We would expect approximately 100 heads.
Results such as 96 heads or 107 heads would not be surprising.
Two-Stage Expected Outcomes
Suppose two fair coins are tossed.
The possible equally likely outcomes are:
HH, HT, TH, TT
There are four possibilities.
The probability of two heads is:
P(HH) = 1/4
If the experiment is repeated 200 times:
expected HH outcomes = 1/4 × 200
= 50
So we expect approximately 50 cases of two heads.


Expected Value
When different outcomes have different numerical rewards, we can calculate expected value.
For outcomes x₁, x₂, x₃, ... with probabilities P₁, P₂, P₃, ...:
E(X) = x₁P₁ + x₂P₂ + x₃P₃ + ...
In simpler words:
expected value = sum of (outcome value × probability)
Expected value describes the average result we would expect per play in the long run.
Expected Value Example
Suppose a game works like this:
- win $6 with probability 1/4
- win $2 with probability 1/2
- win $0 with probability 1/4
The expected winnings are:
E(X) = 6(1/4) + 2(1/2) + 0(1/4)
= 1.50 + 1.00
= $2.50
Therefore, the average expected payout is:
$2.50 per game
If the game costs exactly $2.50 to play, its expected net value to the player is:
$2.50 − $2.50 = $0
In the financial expected-value sense, the game is fair.
Expected Net Gain
For games involving a cost to play:
expected net gain = expected winnings − cost to play
If:
expected net gain = 0
the game is financially fair.
If:
expected net gain > 0
the game favours the player.
If:
expected net gain < 0
the game favours the organiser.
Example: Is the Game Fair?
A game costs $2 to play.
The possible prizes are:
| Outcome | Probability | Prize |
|---|---|---|
| Large prize | 0.05 | $10 |
| Small prize | 0.20 | $3 |
| No prize | 0.75 | $0 |
Expected winnings:
E(X) = 10(0.05) + 3(0.20) + 0(0.75)
= 0.50 + 0.60
= $1.10
But the player pays:
$2.00
Therefore:
expected net gain = 1.10 − 2.00
= −$0.90
On average, the player would expect to lose 90 cents per play in the long run.
Therefore:
the game is not financially fair to the player.
Expected Value Does Not Predict One Game
Suppose the expected value of a game is:
−$0.90
This does not mean a player loses exactly 90 cents every time.
One player might win $10.
Another might win $3.
Another might win nothing.
Expected value describes the long-run average, not the result of an individual play.
This distinction is essential.
Comparing Two Games
Consider two games using a fair die.
Game A
Win $3 if you roll a 6.
Otherwise win $0.
Expected winnings:
E(A) = 3(1/6) + 0(5/6)
= $0.50
Game B
Win $1 if you roll an even number.
Otherwise win $0.
Probability of an even number:
3/6 = 1/2
Therefore:
E(B) = 1(1/2) + 0(1/2)
= $0.50
Although the games have very different rules, they have the same expected payout.
If both cost $0.50 to play, both are financially fair.
Probability Trees
When a game has several stages, a probability tree can help calculate the probabilities of combined outcomes.
For independent events, probabilities along a path are multiplied.
Suppose a fair coin is tossed twice.
Probability of HH:
P(HH) = 1/2 × 1/2 = 1/4
Probability of HT:
P(HT) = 1/2 × 1/2 = 1/4
Similarly:
P(TH) = 1/4
P(TT) = 1/4


Probability trees are especially useful when a game's fairness depends on combinations of several random events.
Fairness with Two Dice
Suppose two fair dice are rolled.
Player A wins if the total is 7.
Player B wins if the total is 8.
At first glance, the game may seem fair because each player is assigned one total.
But the totals are not equally likely.
There are 6 ways to make 7:
1 + 6
2 + 5
3 + 4
4 + 3
5 + 2
6 + 1
Therefore:
P(total 7) = 6/36 = 1/6
There are 5 ways to make 8:
2 + 6
3 + 5
4 + 4
5 + 3
6 + 2
Therefore:
P(total 8) = 5/36
Player A has the advantage.
The game is unfair.
Why Dice Totals Are Not Equally Likely
With two dice, there are:
6 × 6 = 36
equally likely ordered outcomes.
But different totals can be produced in different numbers of ways.
For example:
total 2 → 1 way
total 3 → 2 ways
total 4 → 3 ways
...
total 7 → 6 ways
...
total 12 → 1 way


Therefore, a game assigning one player a total of 7 and another a total of 12 would be extremely unfair.
Fairness with Spinners
Spinners are useful for designing probability games because probabilities can be changed by changing the sizes or numbers of sections.
For a spinner divided into eight equal sections:
If four sections are red:
P(red) = 4/8 = 1/2
If two are blue:
P(blue) = 2/8 = 1/4
If one is yellow:
P(yellow) = 1/8
If one is green:
P(green) = 1/8


The designer can use these probabilities to create either a fair or an unfair game.
Designing a Fair Spinner Game
Suppose an eight-section spinner contains:
- 4 red sections
- 2 blue sections
- 1 green section
- 1 yellow section
We could create this game:
Player A wins on red.
Player B wins on blue, green, or yellow.
Then:
P(A wins) = 4/8
= 1/2
and:
P(B wins) = (2 + 1 + 1)/8
= 4/8
= 1/2
Therefore, the game is fair.
The individual colours are not equally likely, but the players' total winning probabilities are equal.
Designing Fair Rewards for Unequal Probabilities
Fairness does not always require equal winning probabilities if the rewards are different.
Suppose:
- Event A occurs with probability 1/2 and pays $2.
- Event B occurs with probability 1/4 and pays $4.
Compare their expected payouts:
For A:
1/2 × $2 = $1
For B:
1/4 × $4 = $1
The less likely event has the larger reward.
This principle is often used when designing games with different prize levels.
Designing a Fair Game Using Expected Value
Suppose you want to design a game that costs:
$2 to play
A fair game should have:
expected winnings = $2
Suppose a spinner has four equally likely sections:
- $0
- $1
- $2
- unknown prize x
Then:
E(X) = 1/4(0) + 1/4(1) + 1/4(2) + 1/4(x)
For fairness:
E(X) = 2
So:
(0 + 1 + 2 + x)/4 = 2
3 + x = 8
x = 5
Therefore, the fourth prize should be:
$5
The expected payout becomes:
(0 + 1 + 2 + 5)/4
= 8/4
= $2
which matches the $2 cost.
Changing Rules to Make a Game Fair
Suppose a die game originally has:
- Player A wins on 1, 2, 3, or 4.
- Player B wins on 5 or 6.
The probabilities are:
P(A) = 4/6
P(B) = 2/6
One way to make the game fair is to change the rules:
- Player A wins on odd numbers.
- Player B wins on even numbers.
Now:
P(A) = 3/6 = 1/2
P(B) = 3/6 = 1/2
The game has become fair without changing the die.
Experimental Testing of Fairness
Suppose we design a spinner that should give:
P(A) = 1/2
P(B) = 1/2
We test it 20 times and obtain:
A wins 13 times.
B wins 7 times.
Experimental probabilities:
P(A) = 13/20 = 0.65
P(B) = 7/20 = 0.35
Does this prove the game is unfair?
No.
Twenty trials are not enough to expect perfect agreement with theoretical probability.
We should perform many more trials before concluding that the physical spinner itself might be biased.
Theoretical Fairness Versus Practical Fairness
A game can be mathematically fair in its rules but practically unfair if the random device is biased.
For example:
A coin game may have rules that give heads to Player A and tails to Player B.
Mathematically:
P(A) = P(B) = 1/2
But if the physical coin or tossing method strongly favours one outcome, the actual game may not behave as expected.
Therefore, evaluating fairness can involve both:
- theoretical probability
- experimental evidence
Randomness Does Not Mean Equal Results
A common misunderstanding is:
"If a game is fair, both players should win the same number of times."
That is not correct.
Fairness concerns the probability of winning, not a guarantee about actual results.
In a fair game, one player might win several times in a row simply because of random variation.
The Gambler's Fallacy
Suppose a fair coin lands heads five times in a row.
Someone might say:
"Tails is now more likely because it is due."
If each toss is independent, this is false.
The next toss still has:
P(heads) = 1/2
P(tails) = 1/2
Previous independent outcomes do not force future outcomes to "balance out" immediately.
This mistaken reasoning is called the gambler's fallacy.
Expected Value and Long-Term Advantage
Suppose a game has expected net value:
−$0.20 per play
One game may not seem important.
But after 1,000 plays:
expected total net result = 1,000(−$0.20)
= −$200
This explains why even a small probability advantage can become significant over many repetitions.
The expected value gives us a way to measure the game's long-term mathematical advantage.
Fair Does Not Mean Risk-Free
Consider two financially fair games.
Game A
- 50% chance of winning $1
- 50% chance of losing $1
Expected value:
E(A) = 0.5(1) + 0.5(−1)
= $0
Game B
- 50% chance of winning $100
- 50% chance of losing $100
Expected value:
E(B) = 0.5(100) + 0.5(−100)
= $0
Both games have expected value zero.
Both are mathematically fair in that sense.
But Game B involves much greater risk and variability.
Therefore, expected value tells us about long-term average fairness, not how risky a game feels to an individual player.
Evaluating a Game Systematically
When deciding whether a game is fair:
Identify all possible outcomes.
Make sure no outcomes are missing.
Determine the probability of each outcome.
Do not assume outcomes are equally likely unless there is a reason.
Identify which outcomes benefit each player.
Combine probabilities where necessary.
Include prizes and costs.
If different outcomes have different values, calculate expected value.
Compare the players' advantages.
For a simple win/lose game, compare winning probabilities.
For a prize game, compare expected net values.
Consider experimental evidence.
If a physical device is involved, repeated trials can help determine whether it behaves as expected.
State a justified conclusion.
Explain mathematically why the game is fair or unfair.
Example of a Complete Fairness Evaluation
A game costs $3.
A fair six-sided die is rolled.
- Roll 1: win $12
- Roll 2 or 3: win $3
- Roll 4, 5, or 6: win $0
Calculate expected winnings:
E(X) = 12(1/6) + 3(2/6) + 0(3/6)
= 2 + 1 + 0
= $3
The game costs:
$3
Therefore:
expected net gain = 3 − 3
= $0
So the game is financially fair in terms of expected value.
A player may still win or lose on an individual play, but neither the player nor organiser has a long-term expected monetary advantage.
Probability in Real Games
Probability and expected value are important when analysing:
- board games
- card games
- dice games
- carnival games
- prize draws
- raffles
- sports rules
- simulations
- insurance models
- business decisions
Carnival-style games are particularly useful examples because a game can appear attractive while its probabilities and payouts strongly favour the organiser.


The important mathematical question is not:
"Can I win?"
Instead, ask:
"What is the probability of each outcome, and what is its value?"
Common Mistakes
Assuming equal-looking choices have equal probabilities
Two labels on a spinner do not necessarily have the same probability if their sections have different sizes.
Assuming every dice total is equally likely
With two dice, a total of 7 is much more likely than a total of 2 or 12.
Judging fairness from one game
A fair game can still produce an uneven result in a small number of trials.
Confusing expected value with guaranteed value
An expected value of $2 does not mean the player receives $2 every time.
Ignoring the cost of playing
A $5 expected payout is not favourable if the game costs $8.
Ignoring outcomes with zero payoff
They still contribute to the probability distribution and must be included.
Assuming a rare outcome automatically makes a game unfair
A rare outcome can have a larger reward that compensates for its lower probability.
Using experimental probability from too few trials
Small samples can differ considerably from theoretical probability because of random variation.
Falling for the gambler's fallacy
Independent events do not become more or less likely simply because of previous outcomes.
Key Terms
Probability — a numerical measure of how likely an event is to occur.
Outcome — one possible result of a probability experiment.
Sample space — the complete set of possible outcomes.
Event — one or more outcomes of interest.
Fair game — a game in which the rules do not give one participant an unintended mathematical advantage; in monetary games, fairness is commonly assessed by expected net value.
Unfair game — a game whose probabilities, rules, or rewards give one side a mathematical advantage.
Theoretical probability — probability calculated from a mathematical model.
Experimental probability — probability estimated from observed results.
Expected frequency — the predicted number of occurrences of an event over a specified number of trials.
Expected value — the probability-weighted average numerical outcome over many repetitions.
Expected net gain — expected winnings minus the cost of participating.
Independent events — events for which the occurrence of one does not change the probability of the other.
Probability tree — a branching diagram showing possible sequences of events and their probabilities.
Random variation — natural differences between actual results and theoretical expectations.
Law of large numbers — the principle that experimental proportions tend to approach theoretical probabilities as the number of independent trials becomes very large under suitable conditions.
Gambler's fallacy — the mistaken belief that previous independent random outcomes change what is "due" next.
Key Takeaways
- Probability can be used to determine whether games and activities are mathematically fair.
- In a simple two-player chance game with equal rewards, equal probabilities of winning generally produce a fair game.
- A fair random device does not automatically create a fair game; the rules also matter.
- Unequal individual outcome probabilities can still be combined to produce a fair game.
- Expected frequency is calculated using probability × number of trials.
- Expected value is calculated by multiplying each outcome's value by its probability and adding the results.
- A financially fair game has an expected net gain of 0.
- A rare event can have a larger reward and still form part of a fair game.
- Expected value describes a long-run average, not what must happen in one play.
- Experimental results will not usually match theoretical probabilities exactly.
- Short runs of wins or losses do not necessarily indicate an unfair game.
- With repeated trials, experimental proportions tend to become more stable.
- Games can be made fair by adjusting probabilities, rules, costs, or rewards.
- A strong evaluation of fairness considers all possible outcomes, their probabilities, their rewards or costs, and the assumptions behind the probability model.
Check Your Understanding
- A fair coin is tossed. Player A wins on heads and Player B wins on tails. Explain why the game is fair.
- A fair die is rolled. Player A wins on 1, 2, 3, or 4. Player B wins on 5 or 6. Calculate each player's probability of winning and determine whether the game is fair.
- Design new rules for the die in Question 2 that give both players the same probability of winning.
- A spinner has eight equal sections: four red, two blue, one yellow, and one green. Player A wins on red. Player B wins on any other colour. Determine whether the game is fair.
- A fair die is rolled 300 times. Calculate the expected number of times a 5 should appear.
- Two fair coins are tossed 400 times. Calculate the expected number of times two heads should occur.
- A game has a 1/4 probability of paying $8 and a 3/4 probability of paying $0. Calculate the expected payout.
- The game in Question 7 costs $2 to play. Calculate the expected net gain and determine whether the game is financially fair.
- A game costs $3. A player has a 1/2 probability of winning $4, a 1/4 probability of winning $2, and a 1/4 probability of winning nothing. Calculate the expected winnings and determine whether the game is fair.
- A game uses two dice. Player A wins if the total is 7 and Player B wins if the total is 12. Explain why assigning one total to each player does not make the game fair.
- A theoretically fair spinner is tested 20 times. Player A wins 14 times and Player B wins 6 times. Explain why this result alone does not prove that the spinner is unfair.
- A fair coin has landed heads six consecutive times. A student claims that tails must now be more likely. Evaluate the student's reasoning.
- A four-section spinner has equally likely prizes of $0, $2, $4, and x dollars. The game costs $3 to play. Determine x so that the game is financially fair.
- Design your own fair game using a six-sided die. State the rules and use probabilities or expected value to prove mathematically that your game is fair.
- A carnival game advertises a large jackpot and claims, "Everyone has a chance to win, so the game is fair." Explain why having some chance of winning is not enough to establish mathematical fairness.
3. Statistics in the Media
Learning outcomes
- I can identify statistical claims in media reports.
- I can recognize misleading graphs and statistics.
- I can evaluate the quality of statistical evidence.
- I can identify sources of bias in reported data.
- I can critically analyze statistical information.
Statistics in the Media
Statistics appear constantly in news reports, advertisements, social media posts, political claims, health stories, sports coverage, and business reports.
A headline might claim:
"Sales increased by 50%."
"9 out of 10 people prefer Product A."
"People who do X are twice as likely to experience Y."
These statements sound precise because they contain numbers. However, the presence of a statistic does not automatically make a claim reliable.
Statistical information must be examined critically.
A useful question is:
What evidence actually supports this claim?
Statistical Claims
A statistical claim is a statement based on numerical data or statistical analysis.
Examples include:
- "72% of customers were satisfied."
- "The average household spends $400 per month on transportation."
- "Students who studied longer achieved higher test scores."
- "Unemployment decreased by 10%."
- "Four out of five surveyed participants preferred Option A."
Each statement raises additional questions.
For example:
Who was surveyed?
How many people were surveyed?
How were they selected?
How was the question worded?
What does "average" mean?
Compared with what?
Was the study observational or experimental?
Without this information, a statistic may be difficult to evaluate properly.
Statistics Can Be Correct but Misleading
A statistical statement does not have to be mathematically false to be misleading.
Suppose a company's sales increase from:
100 units to 150 units
The company can correctly say:
"Sales increased by 50%."
But suppose the previous year's sales had fallen from 1,000 to 100 because the company temporarily closed most of its stores.
The 50% increase is mathematically correct, but without context it may create a misleading impression about the company's overall performance.
This is why statistical literacy involves more than checking calculations.
We must also examine context.
Reading Beyond the Headline
Media headlines are designed to attract attention.
A headline might say:
"New Study Finds Exercise Doubles Your Chances of Success!"
Before accepting this claim, we would want to know:
- What was measured?
- How was "success" defined?
- How many people participated?
- How were participants selected?
- What was the original probability?
- Was the study experimental or observational?
- Could another variable explain the result?
A strong statistical reader separates the headline from the evidence.
Absolute Change and Relative Change
One common source of misleading statistical reporting is the difference between absolute change and relative change.
Suppose a rate increases from:
2% to 3%
The absolute increase is:
3% − 2% = 1 percentage point
The relative increase is:
(3 − 2) / 2 × 100%
= 50%
Therefore, both statements are mathematically correct:
"The rate increased by 1 percentage point."
and:
"The rate increased by 50%."
However, they create very different impressions.
Whenever a report gives a large percentage increase, ask:
Increase from what original value?
"Twice as Likely"
Suppose the probability of an event changes from:
1 in 10,000
to:
2 in 10,000
The second probability is twice the first.
So a headline could correctly state:
"Risk doubles."
But the absolute change is only:
1 additional case per 10,000
Both pieces of information matter.
A responsible statistical interpretation considers both relative risk and absolute risk.
Percent Versus Percentage Points
These terms are not interchangeable.
Suppose support for a proposal rises from:
40% to 50%
The increase is:
10 percentage points
The percentage increase relative to the original value is:
(50 − 40) / 40 × 100%
= 25%
Therefore:
40% → 50%
is a:
10 percentage-point increase
but a:
25% relative increase
Confusing these quantities can exaggerate or minimize changes.
Misleading Graphs
Graphs can communicate large amounts of information quickly.
They can also create misleading impressions through:
- truncated axes
- inconsistent scales
- distorted pictures
- unequal intervals
- inappropriate graph types
- missing labels
- selective time periods
- exaggerated three-dimensional effects
The numbers may even be correct while the visual presentation is misleading.
Truncated Axes
Consider two products with satisfaction scores:
Product A = 92%
Product B = 96%
The difference is:
4 percentage points
A bar graph with a vertical axis from:
0% to 100%
would show a relatively small difference.
But suppose the graph starts at:
90%
Now Product B's bar can appear several times taller than Product A's visible bar, even though the actual scores differ by only four percentage points. Truncating a bar chart's y-axis can therefore exaggerate visual differences.


Always examine the axis before interpreting the apparent size of a difference.
Does Every Graph Need to Start at Zero?
Not necessarily.
For bar graphs, starting at zero is particularly important because the length of each bar represents its magnitude.
For some line graphs, scientific measurements, or situations involving small but important changes, a non-zero starting point may be appropriate.
However, the scale must be clearly shown so readers understand what they are seeing.
The problem is not simply:
"The axis does not start at zero."
The better question is:
"Does the scale create a misleading impression of the size of the change?"
Changing the Scale
Even when an axis begins at zero, its maximum value can affect how dramatic a trend appears.
A graph ranging from:
0 to 100
can make a change from 40 to 50 appear substantial.
A graph ranging from:
0 to 10,000
would make the same change appear almost invisible.
Neither scale necessarily changes the underlying numbers.
But the visual impression changes.
This is why readers should examine:
- minimum values
- maximum values
- intervals
- units
rather than relying only on the visual shape.
Unequal Intervals
Suppose a time axis shows:
2020, 2021, 2022, 2026, 2027
but each year is placed the same distance apart.
This visually treats the four-year interval from 2022 to 2026 as if it were only one year.
That can distort the apparent rate of change.
Axis intervals should accurately represent the quantities they describe unless the graph clearly indicates otherwise.
Distorted Pictographs
Pictures can also exaggerate differences.
Suppose one company sold twice as many phones as another.
If an icon representing the second company is made:
twice as tall and twice as wide
its area becomes approximately:
2 × 2 = 4 times as large
The picture can therefore make a twofold difference look like a fourfold difference.
This violates the principle that the visual representation should be proportional to the data.


Three-Dimensional Graphs
Three-dimensional bars and pie charts may look impressive, but perspective can distort comparisons.
Objects closer to the viewer may appear larger.
Some parts of the graph may hide others.
A simple two-dimensional graph is often easier to interpret accurately.
Good statistical graphics should prioritize:
clarity over decoration.
Cherry-Picking Data
Cherry-picking occurs when only selected data are presented because they support a particular conclusion.
Suppose a company's profits are:
| Year | Profit |
|---|---|
| 2021 | $10 million |
| 2022 | $8 million |
| 2023 | $6 million |
| 2024 | $5 million |
| 2025 | $6 million |
| 2026 | $7 million |
A report beginning with 2024 could say:
"Profits have risen by 40%!"
because:
(7 − 5) / 5 × 100% = 40%
That is true.
But looking from 2021 to 2026 shows:
$10 million → $7 million
which tells a very different story.
Choosing the starting and ending points can strongly affect the message.
Ask Why Those Dates Were Chosen
When examining a time-series graph, ask:
Why does the graph begin here?
Why does it end here?
What happened immediately before or after the displayed period?
A carefully selected time window can turn:
- a long-term decline into an apparent increase
- a temporary spike into apparent rapid growth
- a normal seasonal change into an apparent crisis
Context matters.
Mean, Median, and Mode
The word average can also be misleading because several different measures of centre exist.
The mean is:
mean = sum of values / number of values
The median is the middle value when the data are ordered.
The mode is the most frequently occurring value.
These can be very different when data are skewed.
An "Average" Income Example
Suppose five people earn:
$30,000
$32,000
$34,000
$36,000
$368,000
The mean is:
(30,000 + 32,000 + 34,000 + 36,000 + 368,000) / 5
= $100,000
The median is:
$34,000
A headline saying:
"Average income is $100,000"
could create a misleading impression of what a typical person earns.
The mean is mathematically correct, but it is strongly affected by the very high income.
Sample and Population
A population is the complete group we want information about.
A sample is the smaller group from which data are actually collected.
For example:
Population:
all 1,500 students at a school
Sample:
150 students surveyed
We often use the sample to make conclusions about the population.
For this to work well, the sample should reasonably represent the population.
Sample Size
Consider a headline:
"80% of teenagers prefer Product A."
That sounds impressive.
But suppose only:
5 teenagers
were surveyed.
Four preferred Product A.
Then:
4/5 × 100% = 80%
The percentage is correct, but the sample is far too small to support a strong claim about teenagers generally.
Always ask:
How large was the sample?
Representative Samples
A large sample can still be poor if it is not representative.
Suppose a school wants to determine whether students support replacing the football field with a larger library.
The school surveys:
500 members of the school football program
Even though 500 is a large sample, it may not represent the entire school.
The method used to choose participants matters as much as the number of participants.
Selection Bias
Selection bias occurs when the way participants are selected makes some members of the population more likely to be included than others.
For example, a newspaper asks:
"Should our city build more bicycle lanes?"
but surveys only people attending a cycling event.
The results may accurately describe those participants while poorly representing the city's entire population.

Voluntary Response Bias
Suppose a website asks:
"Click here to tell us whether you love or hate the new school timetable."
People with particularly strong opinions may be more likely to respond.
People who do not care may ignore the survey.
This creates voluntary response bias.
The results may therefore overrepresent extreme opinions.
Non-Response Bias
Suppose researchers randomly select 1,000 people for a survey, but only 200 respond.
The original selection may have been excellent.
However, if the 800 non-respondents differ systematically from the 200 respondents, the final results can still be biased.
This is called non-response bias.
Undercoverage
Undercoverage occurs when some groups in the population have little or no chance of being included.
For example, conducting an online-only survey may underrepresent people with limited internet access.
The resulting sample may not accurately represent the target population.
Wording Bias
The wording of a question can influence responses.
Compare:
Question A:
"Do you support the proposed school schedule?"
with:
Question B:
"Do you support the unnecessarily long school schedule that will reduce students' free time?"
Question B contains emotionally loaded language.
A reliable survey should use neutral wording whenever possible.
Leading Questions
A leading question encourages respondents toward a particular answer.
For example:
"Don't you agree that the new recycling program is an excellent idea?"
This wording suggests what the "correct" response should be.
A more neutral question would be:
"Do you support or oppose the new recycling program?"
Who Conducted the Study?
The source of statistical information matters.
Suppose a headline states:
"Study finds Product X is the most effective product available."
We should ask:
Who funded the study?
If the manufacturer of Product X funded it, that does not automatically make the research false.
But it does create a possible conflict of interest that should be considered when evaluating the evidence.
Primary and Secondary Sources
A primary source presents the original research or data.
Examples include:
- research papers
- government databases
- original survey reports
- official statistical publications
A secondary source reports or interprets information from somewhere else.
Examples include:
- newspaper articles
- television reports
- blogs
- social media posts
When possible, checking the original source helps determine whether the media report accurately represents the evidence.
Correlation and Causation
Suppose data show that people who exercise more tend to report better health.
This is a correlation or association.
It does not automatically prove:
Exercise caused every observed difference in health.
Other variables may also matter.
For example:
- age
- diet
- income
- existing health
- access to healthcare
- lifestyle
A correlation identifies a relationship.
A causal claim requires stronger evidence.

Confounding Variables
A confounding variable is another variable related to both variables being studied that can help explain an observed association.
For example, suppose:
ice-cream sales increase
and:
sunburn cases increase
at the same time.
It would be unreasonable to conclude that ice cream causes sunburn.
A likely confounding variable is:
hot, sunny weather
which can increase both ice-cream consumption and sun exposure.
Identifying possible confounding variables is an important part of critically evaluating statistical claims.
Observational Studies
In an observational study, researchers observe what happens without assigning treatments.
For example, researchers might compare people who voluntarily drink coffee with people who do not.
Observational studies can identify associations.
However, other differences between the groups may help explain the result.
Therefore, causal conclusions from observational studies require particular caution.
Experiments
In a well-designed experiment, researchers deliberately apply treatments and compare outcomes.
A strong experiment may include:
- random assignment
- a control group
- consistent procedures
- sufficient sample size
- blinding where appropriate
Random assignment helps distribute other variables between groups and can provide stronger evidence about cause and effect.
Statistical Significance
Media reports sometimes say a result was:
"statistically significant."
This does not necessarily mean:
- the effect was large
- the effect was important
- the result is guaranteed
- the study was perfectly designed
Statistical significance generally indicates that the observed result would be relatively unlikely under a specified null model, according to the statistical test and threshold being used.
A small effect can be statistically significant, especially with a large sample.
Therefore, readers should also consider the size and practical importance of the effect.
Practical Significance
Suppose a study finds that a new method improves average test scores from:
80.0% to 80.2%
With a sufficiently large sample, the difference might potentially be statistically detectable.
But we should still ask:
Is a 0.2 percentage-point improvement educationally important?
This is a question of practical significance.
Statistical evidence should be interpreted in context.
Margin of Error
Opinion polls often report a margin of error.
Suppose a poll reports:
Candidate A = 48%
Candidate B = 46%
with a margin of error of approximately:
±3 percentage points
The observed difference is only two percentage points.
It would therefore be inappropriate to confidently claim that Candidate A definitely has greater population support based on those estimates alone.
The estimates contain sampling uncertainty.
Sample Estimates Are Not Exact Population Values
If 52% of a sample chooses Option A, this does not necessarily mean exactly 52% of the entire population would choose it.
Samples vary.
Another randomly selected sample could produce:
50%
or:
54%
or another nearby result.
Statistical methods help us describe this uncertainty rather than pretending sample estimates are exact.
Missing Denominators
A statistic can sound dramatic when the denominator is omitted.
Consider:
"Cases increased by 100!"
That statement is difficult to interpret.
An increase from:
10 to 110
is very different from an increase from:
1,000,000 to 1,000,100.
Always ask:
100 out of how many?
Rates, percentages, and population sizes often provide necessary context.
Counts Versus Rates
Suppose City A has:
1,000 reported incidents
and City B has:
500 reported incidents
It might seem that City A has a larger problem.
But suppose:
City A population = 2,000,000
City B population = 100,000
Rates provide a more meaningful comparison.
City A:
1,000 / 2,000,000 × 100,000
= 50 incidents per 100,000 people
City B:
500 / 100,000 × 100,000
= 500 incidents per 100,000 people
City B actually has the much higher rate.
Percentages Without Counts
Consider:
"90% of users reported improvement."
This sounds strong.
But compare:
9 out of 10 users
with:
9,000 out of 10,000 users
Both are 90%.
The percentage is identical, but the amount of evidence is very different.
Good statistical reporting should provide enough information to understand both the proportion and the sample size.
Missing Data
Missing observations can also influence conclusions.
Suppose a survey is sent to 10,000 customers.
Only 500 respond.
Of those respondents:
90% report satisfaction.
A headline might state:
"90% of customers are satisfied."
But the evidence actually shows:
90% of the customers who responded were satisfied.
If satisfied customers were more likely to respond, the headline could overstate satisfaction among all customers.
Outliers and Selective Reporting
An outlier is an unusually high or low observation.
Outliers can affect statistics such as the mean.
However, researchers should not simply remove inconvenient observations because they weaken a desired conclusion.
There should be a legitimate methodological reason for excluding data.
Similarly, reporting only analyses that support a preferred conclusion can create reporting bias.
Graphs Should Show Data Honestly
A trustworthy graph should generally have:
- clearly labelled axes
- clearly stated units
- appropriate scales
- proportional visual elements
- meaningful categories
- consistent intervals
- an appropriate graph type
- enough context to understand the data
A graph should help the reader understand the data rather than manipulate the reader's impression.


Evaluating Statistical Evidence
When evaluating evidence in a media report, consider four broad areas.
Source
Who produced the information?
Data
Where did the numbers come from?
Method
How were the data collected and analysed?
Claim
Does the conclusion actually follow from the evidence?
A trustworthy-looking graph does not eliminate the need to ask these questions.
Questions About the Source
Ask:
- Who conducted the study?
- Who funded it?
- Is the original source available?
- Is the organization qualified to conduct the research?
- Is there a possible conflict of interest?
- Does the media report accurately represent the original findings?
The identity of the source does not automatically prove or disprove a claim, but it helps us assess credibility and possible bias.
Questions About the Sample
Ask:
- What population is being studied?
- How large is the sample?
- How were participants selected?
- Is the sample representative?
- Who was excluded?
- How many people failed to respond?
A precise calculation from a biased sample can still produce a misleading conclusion.
Questions About the Measurement
Ask:
- What exactly was measured?
- How was it measured?
- Were the questions neutral?
- Were measurements taken consistently?
- Were important variables ignored?
- Were definitions changed during the study?
If a report says:
"People are happier,"
we should ask:
How was happiness measured?
Questions About the Analysis
Ask:
- Was mean, median, or another statistic used?
- Why was that statistic appropriate?
- Are outliers affecting the result?
- Are percentages being reported without sample sizes?
- Are relative changes being presented without absolute changes?
- Are uncertainty and margins of error reported?
- Were only favourable results selected?
Questions About the Conclusion
Finally ask:
Does the evidence actually support the claim being made?
A study showing correlation should not automatically produce a headline claiming causation.
A small sample should not support sweeping conclusions about millions of people.
A small percentage-point change should not be presented as a dramatic transformation without context.
The strength of the conclusion should match the strength of the evidence.
A Media Claim Example
Suppose an advertisement states:
"Product A improves performance by 200%!"
Before accepting the claim, investigate.
Suppose the average score increased from:
1 point to 3 points
The increase is:
3 − 1 = 2
Relative increase:
2/1 × 100%
= 200%
The percentage is mathematically correct.
But we still need to know:
- What does one point represent?
- How important is a two-point difference?
- How many participants were tested?
- Was there a control group?
- Who funded the study?
- Was the result replicated?
The percentage alone is not enough.
Another Media Claim Example
Headline:
"Students Who Use Tablets Score 15% Higher."
Possible interpretation:
Tablet use improves scores.
But other explanations might include:
- schools with more resources provide more tablets
- those schools may also have smaller classes
- students may have greater access to tutoring
- family income may differ
- the students may have been different before tablet use began
Without stronger evidence, the safest conclusion may be:
Tablet use was associated with higher scores in the observed data.
That is different from saying:
Tablets caused the higher scores.
Social Media Statistics
Social media makes critical statistical thinking particularly important.
A graphic may contain:
- professional-looking charts
- percentages
- scientific terminology
- logos
- references to a "study"
None of these automatically guarantees reliability.
Before sharing a statistical claim, consider finding the original source and checking whether the graphic accurately represents it.
Comparing Two Reports
Imagine two headlines about the same data.
Headline A:
"Support for Proposal Surges by 25%!"
Headline B:
"Support Rises from 40% to 50%."
Both may describe the same change.
Headline A emphasizes the relative increase:
(50 − 40)/40 × 100%
= 25%
Headline B reports the actual percentages and reveals that the change was:
10 percentage points
The second headline provides more immediate context.
This does not make the first mathematically false, but it demonstrates how presentation influences interpretation.
A Critical Statistics Checklist
When encountering statistics in media, ask:
- What exactly is the claim?
- What is the original source?
- Who collected the data?
- Who funded the research?
- What population is being discussed?
- How large was the sample?
- How was the sample selected?
- Could selection, response, or wording bias be present?
- Are percentages given with actual counts?
- Are relative changes given with starting values?
- Are the graph's axes and scales appropriate?
- Has the time period been selectively chosen?
- Is correlation being presented as causation?
- Are uncertainty and limitations acknowledged?
- Does the evidence actually justify the headline?
Common Mistakes
Assuming numbers cannot be misleading
Correct numbers can still be presented without important context.
Looking only at the graph's shape
Always read the axis labels, units, and scale.
Ignoring the starting value
A "100% increase" could mean 1 became 2.
Confusing percent with percentage points
An increase from 20% to 30% is 10 percentage points but a 50% relative increase.
Assuming a large sample is automatically representative
A large biased sample is still biased.
Ignoring non-response
The people who answer a survey may differ from those who do not.
Assuming correlation proves causation
Other variables or reverse causation may explain an association.
Assuming "statistically significant" means "important"
Statistical detectability and practical importance are different ideas.
Accepting "average" without asking which average
Mean and median can tell very different stories.
Ignoring the source
Always consider who collected, funded, analysed, and reported the data.
Treating one statistic as the whole story
Good statistical interpretation considers context, uncertainty, methodology, and alternative explanations.
Key Terms
Statistical claim — a statement supported or presented using numerical data.
Population — the entire group about which a conclusion is intended.
Sample — the subset of the population actually studied.
Representative sample — a sample whose relevant characteristics reasonably reflect the population.
Sampling bias — systematic distortion caused by how a sample is selected.
Selection bias — bias caused when some members of a population have a greater chance of being selected.
Voluntary response bias — bias caused when people choose whether to participate, often overrepresenting strong opinions.
Non-response bias — bias arising when people who do not respond differ meaningfully from those who do.
Undercoverage — failure to adequately include some groups in the population.
Wording bias — influence caused by the way survey questions are phrased.
Cherry-picking — selectively presenting data that support a desired conclusion while ignoring other relevant data.
Truncated axis — an axis that begins or ends in a way that can visually exaggerate or minimize differences.
Absolute change — the numerical difference between two values.
Relative change — change expressed relative to the original value.
Percentage point — the arithmetic difference between two percentages.
Correlation — a statistical association between variables.
Causation — a relationship in which a change in one variable produces a change in another.
Confounding variable — an additional variable that may help explain an observed association.
Margin of error — a measure describing sampling uncertainty around an estimate under a specified statistical method.
Statistical significance — evidence, under a statistical model and testing procedure, that an observed result would be relatively unlikely under the null hypothesis.
Practical significance — whether the size of an effect is meaningful in the real-world context.
Outlier — an observation unusually distant from the general pattern of the data.
Conflict of interest — a situation in which personal, financial, or organizational interests could influence research or reporting.
Key Takeaways
- Statistics in media should be examined critically rather than accepted simply because they contain numbers.
- A statistic can be mathematically correct while still creating a misleading impression.
- Always consider the source, sample, method, context, and conclusion.
- Relative changes should be interpreted alongside the original values and absolute changes.
- Percent changes and percentage-point changes are different.
- Truncated axes and distorted scales can exaggerate or minimize differences.
- Cherry-picked time periods can dramatically change the apparent story.
- Mean and median can produce very different descriptions of skewed data.
- A large sample is useful only if it reasonably represents the population.
- Selection bias, voluntary response bias, non-response bias, undercoverage, and wording bias can distort results.
- Correlation does not by itself establish causation.
- Confounding variables can create or help explain apparent relationships.
- Statistical significance does not necessarily mean that an effect is large or practically important.
- Percentages should be interpreted alongside sample sizes whenever possible.
- Strong statistical reporting acknowledges uncertainty and limitations.
- The strength of a media claim should not exceed the strength of the evidence supporting it.
Check Your Understanding
- A headline states, "Sales increased by 100%!" Sales actually increased from 5 units to 10 units. Explain why the headline is mathematically correct but could still be misleading.
- Support for a proposal rises from 30% to 36%. Calculate both the percentage-point increase and the relative percentage increase.
- A bar graph compares values of 94 and 97 but begins its vertical axis at 93. Explain how this could affect a reader's interpretation.
- A website reports that 80% of students prefer online homework, but only five students were surveyed. Evaluate the quality of this evidence.
- A school surveys 600 members of its athletics teams about whether more money should be spent on sports facilities. Explain why the sample may be biased even though it is large.
- Explain the difference between selection bias and voluntary response bias.
- A survey asks, "Don't you agree that our excellent new school timetable should be kept?" Identify the problem with this question.
- Five employees earn $30,000, $32,000, $35,000, $38,000, and $365,000. Determine the mean and median. Which would better represent a typical employee's income? Explain.
- A report states that people who exercise more frequently have lower stress levels. Explain why this result alone does not prove that exercise caused the difference.
- Ice-cream sales and sunburn cases both increase during summer. Identify a possible confounding variable and explain its role.
- A poll reports Candidate A at 48% and Candidate B at 46%, with a margin of error of ±3 percentage points. Explain why the statement "Candidate A is definitely ahead" is too strong.
- A company's profits fell for four consecutive years and then increased for two years. Its advertisement displays only the last two years and says, "Profits continue their strong upward trend." Identify the statistical reporting problem.
- A study reports that a treatment increased success from 1% to 2%. Explain the difference between saying "success increased by one percentage point" and "success increased by 100%."
- A social-media post says, "9 out of 10 people recommend this product." List at least four pieces of information you would want before deciding whether this is strong evidence.
- Find or imagine a statistical claim from a news article, advertisement, or social-media post. Evaluate it by considering the source, sample, method, graph or numerical presentation, possible bias, uncertainty, and whether the conclusion is justified by the evidence.
4. Data Investigations
Learning outcomes
- I can plan a statistical investigation.
- I can collect and organize relevant data.
- I can analyze data using appropriate statistical tools.
- I can draw evidence-based conclusions.
- I can present findings clearly and effectively.


5. Capstone Data Project
Learning outcomes
- I can design and conduct a complete statistical study.
- I can collect, organize, and analyze data independently.
- I can apply statistical and probability concepts to real-world questions.
- I can communicate findings using graphs, tables, and statistical summaries.
- I can evaluate the strengths and limitations of my investigation.
Capstone Data Project
A capstone data project brings together the major ideas of statistics and probability in one complete investigation.
Instead of being given a finished data set and being told what calculation to perform, you take responsibility for the entire statistical process:
Question → Plan → Collect → Organize → Analyze → Interpret → Conclude → Evaluate → Communicate
The goal is not simply to calculate a mean or create a graph. The goal is to use data to answer a meaningful real-world question and to explain how strongly the evidence supports your conclusion.


A successful capstone project demonstrates that you can think statistically.
Choosing a Real-World Question
A good project begins with a question that can be investigated using data.
Possible areas include:
- school life
- sports
- transportation
- environment
- technology
- entertainment
- exercise
- consumer behaviour
- weather
- study habits
- sleep
- games and probability
A statistical question should anticipate variation.
For example:
Non-statistical question:
"What time does our school begin?"
There is one fixed answer.
Statistical question:
"How much time do students at our school spend travelling to school?"
Different students will have different travel times, so data must be collected and analysed.
Characteristics of a Strong Project Question
A useful research question should be:
Specific — It clearly states what is being investigated.
Measurable — Data can realistically be collected.
Statistical — Variation in the results is expected.
Manageable — The investigation can be completed with available time and resources.
Relevant — The answer has some meaningful interpretation.
Instead of:
"Are phones bad?"
a stronger question might be:
"Is there an association between daily recreational screen time and reported sleep duration among students in our grade?"
This identifies two measurable variables:
- daily recreational screen time
- sleep duration
Possible Capstone Questions
A project might investigate questions such as:
- How long does it typically take students to travel to school?
- Is there an association between sleep duration and reported tiredness?
- Which method of transportation is most common among students?
- Is there a relationship between height and arm span?
- Do older students spend more time on homework?
- Is there an association between weekly exercise time and resting heart rate?
- How accurately can students estimate one minute?
- Does reaction time differ between dominant and non-dominant hands?
- Is there an association between study time and test performance?
- Are the outcomes of a particular spinner or dice game consistent with its theoretical probabilities?
The question determines what type of data must be collected and which statistical tools are appropriate.
Writing a Research Question
Suppose you are interested in sleep.
A weak question might be:
"How much do people sleep?"
A stronger question is:
"How many hours of sleep do Grade 10 students at our school report getting on a typical school night?"
An even more analytical question might be:
"Is there an association between reported sleep duration and reported recreational screen time among Grade 10 students at our school?"
The final question identifies:
- the population
- the variables
- the type of relationship being investigated
Planning Before Collecting Data
A common mistake is to begin collecting data immediately.
Instead, first create an investigation plan.
Your plan should identify:
- research question
- purpose of the investigation
- population
- sample
- sampling method
- variables
- type of each variable
- method of data collection
- units
- possible sources of bias
- ethical considerations
- planned statistical analysis
- graphs that may be appropriate
Planning helps prevent problems that may be impossible to correct later.
Population and Sample
The population is the complete group you want to understand.
The sample is the smaller group from which you actually collect data.
For example:
Research question:
"How many hours do students at our school sleep on school nights?"
Population:
all students at the school
Sample:
120 selected students
We analyse the sample and then decide what the evidence suggests about the larger population.


Selecting a Representative Sample
A representative sample should reasonably reflect the population being studied.
Suppose your school contains students in Grades 7–12.
If you survey only:
students in your mathematics class
your sample may not represent the entire school.
A better approach might involve randomly selecting students from several grades.
Possible sampling methods include:
- simple random sampling
- systematic sampling
- stratified sampling
Convenience sampling may be easier, but it often creates greater risk of bias.
Sample Size
Generally, a larger sample provides more information than a very small sample.
Imagine estimating the average travel time of 2,000 students.
A sample of:
5 students
provides little evidence.
A carefully selected sample of:
200 students
would generally provide much stronger evidence.
However:
sample size cannot repair serious bias.
Surveying 1,000 members of the basketball program would still be a poor way to estimate the average height of all students if basketball players differ systematically from the school population.
Identifying Your Variables
A variable is a characteristic that can take different values.
Suppose the research question is:
"Is there an association between sleep duration and recreational screen time?"
The variables are:
sleep duration
and:
recreational screen time
Both are numerical variables.
Other investigations may involve categorical variables.
For example:
usual transportation method
might have categories such as:
- bus
- car
- train
- bicycle
- walking
Categorical, Discrete, and Continuous Data
Before collecting data, identify the type of each variable.
Categorical Data
Examples:
- favourite subject
- transportation method
- device type
- preferred sport
Discrete Numerical Data
Usually produced by counting.
Examples:
- number of siblings
- number of books read
- number of goals scored
Continuous Numerical Data
Usually produced by measurement.
Examples:
- height
- mass
- temperature
- travel time
- reaction time
The type of variable influences which graphs and statistics should be used.
Collecting Data
Data may be collected using:
- surveys
- questionnaires
- observations
- experiments
- measurements
- existing databases
- published data sets
The collection method should match the research question.
If you want to investigate student opinions, a survey may be appropriate.
If you want to investigate reaction time, an experiment may be better.
If you want to study historical temperatures, an existing reliable database may be appropriate.
Designing Good Survey Questions
Questions should be clear and neutral.
Poor question:
"Don't you agree that students spend far too much time on homework?"
This is leading.
Better:
"Approximately how much time did you spend on homework last night?"
Even better, if typical behaviour is the target:
"On a typical school night, approximately how many minutes do you spend completing homework?"
Every participant should interpret the question as similarly as possible.
Collecting Measurements
If your project involves measurements, establish a consistent procedure.
For example, when measuring reaction time:
- use the same test
- use the same device where possible
- give everyone the same instructions
- use the same units
- conduct the same number of trials
- record results to the same precision
Consistency makes comparisons more meaningful.
Repeated Measurements
Some quantities naturally vary from trial to trial.
Suppose a student's reaction times are:
245 ms
232 ms
251 ms
238 ms
241 ms
Using several trials provides more information than using one measurement.
You might calculate the mean:
(245 + 232 + 251 + 238 + 241) / 5
= 241.4 ms
Repeated trials can help reduce the influence of an unusually fast or slow individual measurement.
Organizing the Data
Raw data should be organized systematically.
A spreadsheet might contain:
| Student | Sleep |
Screen Time |
Grade |
|---|---|---|---|
| A | 7.5 | 2.0 | 10 |
| B | 6.0 | 4.5 | 10 |
| C | 8.0 | 1.5 | 10 |
| D | 6.5 | 3.5 | 10 |
| E | 7.0 | 2.5 | 10 |
Each:
row represents an observation
and each:
column represents a variable.
This structure makes analysis much easier.
Cleaning the Data
Before performing calculations, check the data.
Look for:
- missing values
- impossible values
- duplicated observations
- inconsistent units
- typing errors
- unusual values
- inconsistent category names
Suppose most sleep values are between:
5 and 10 hours
but one entry says:
75 hours
The value may actually have been intended as:
7.5 hours
Do not silently change it. Investigate the error if possible and document any correction.
Organizing Categorical Data
Categorical data can be summarized using frequency tables.
Suppose 40 students report their main transportation method:
| Method | Frequency |
|---|---|
| Bus | 14 |
| Train | 10 |
| Car | 8 |
| Walk | 6 |
| Bicycle | 2 |
Total:
40 students
Relative frequency for bus:
14/40 = 0.35
= 35%
Relative frequencies are especially useful when comparing groups of different sizes.
Choosing Appropriate Statistical Tools
Different questions require different analyses.
| Investigation | Useful Tools |
|---|---|
| Typical value | Mean, median, mode |
| Variation | Range, IQR |
| Categorical comparison | Frequencies, percentages, bar graph |
| Numerical distribution | Histogram, box plot |
| Change over time | Line graph |
| Relationship between two numerical variables | Scatter plot |
| Comparing groups | Centre, spread, box plots |
| Random outcomes | Probability, expected frequency, expected value |
The statistical method should be chosen because it helps answer the research question.
Measures of Centre
The three common measures of centre are:
mean
median
mode
For the data:
5, 6, 6, 7, 8, 10
Mean:
(5 + 6 + 6 + 7 + 8 + 10)/6
= 42/6
= 7
Median:
(6 + 7)/2
= 6.5
Mode:
6
Each statistic describes the data differently.
Choosing Between Mean and Median
Consider:
20, 22, 23, 24, 25, 26, 90
The value 90 is unusually high.
Mean:
230/7 ≈ 32.9
Median:
24
The median provides a better description of the typical value in this example because the mean is strongly affected by the extreme observation.
A good capstone project does not simply calculate statistics—it explains why particular statistics are appropriate.
Measures of Spread
Measures of centre should often be accompanied by measures of variability.
Useful measures include:
range = maximum − minimum
and:
IQR = Q₃ − Q₁
Suppose two groups both have a median of 70.
Group A:
68, 69, 70, 71, 72
Group B:
40, 55, 70, 85, 100
The same centre does not mean the distributions are similar.
Group B has much greater spread.
Examining Distributions
A distribution should be examined for:
- centre
- spread
- shape
- clusters
- gaps
- outliers
Common distribution shapes include:
- approximately symmetric
- skewed right
- skewed left
- bimodal


Recognizing the shape can help determine which summaries are most appropriate.
Creating Effective Graphs
Graphs should help the reader understand the evidence.
Possible choices include:
Bar graph — categorical comparisons
Histogram — distribution of numerical data
Box plot — centre, quartiles, spread, and comparison of distributions
Line graph — change over time
Scatter plot — relationship between two numerical variables
A graph should have:
- a descriptive title
- clearly labelled axes
- appropriate units
- sensible scales
- readable categories
Bar Graph Example
Suppose students report their preferred way of reviewing for a test:
| Method | Students |
|---|---|
| Practice questions | 18 |
| Notes | 11 |
| Videos | 7 |
| Flashcards | 4 |
A bar graph would make the comparison easy to see.
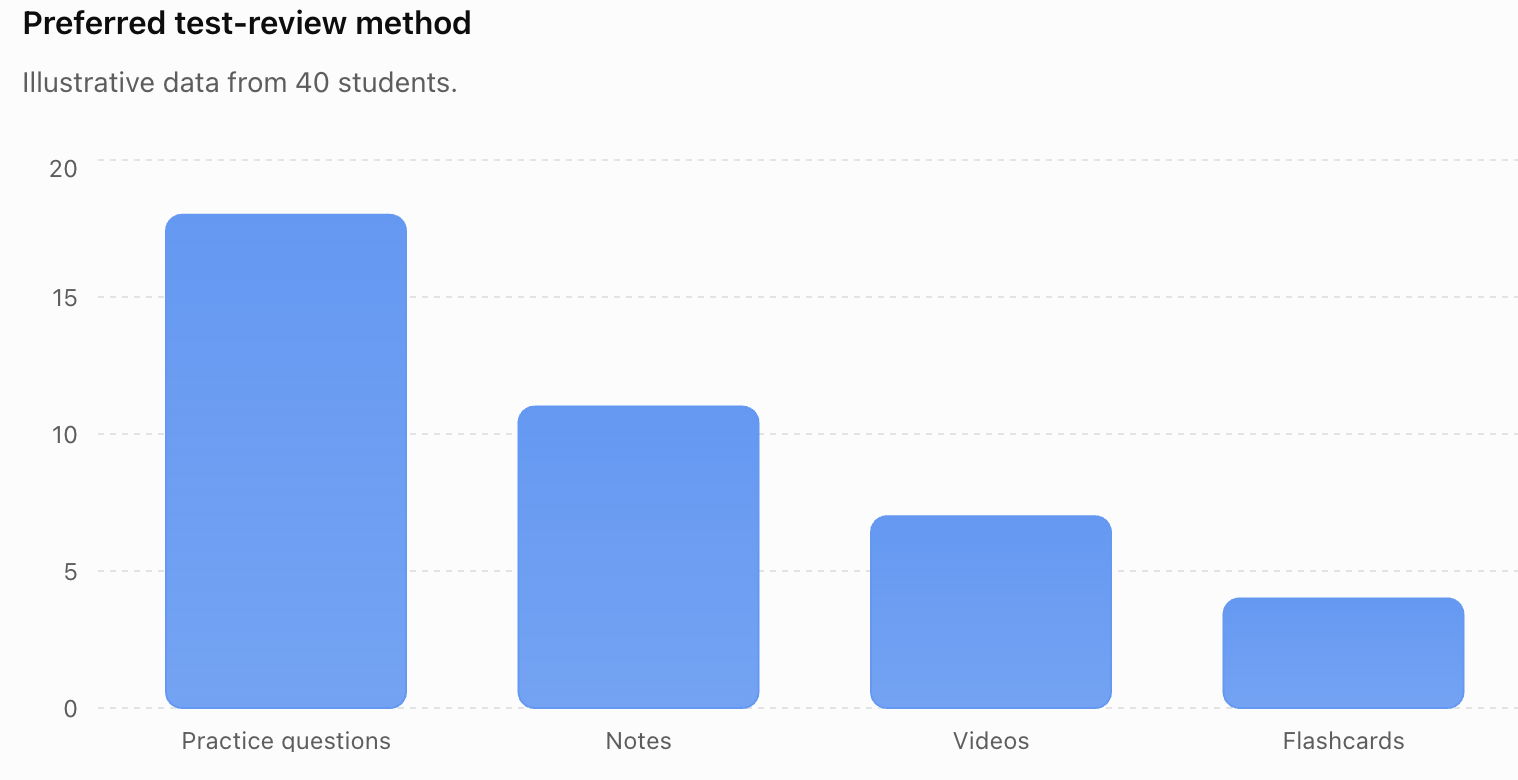
The graph should then be interpreted in words.
For example:
Practice questions were the most commonly selected review method, chosen by 18 of the 40 students.
Histograms
A histogram is useful for examining the distribution of numerical measurements.
For example, travel times could be grouped into intervals:
0–9 minutes
10–19 minutes
20–29 minutes
30–39 minutes
40–49 minutes
50–59 minutes
A histogram can reveal:
- typical values
- spread
- skewness
- clusters
- gaps
- possible outliers


Box Plots
Box plots are especially useful when comparing groups.
For example, you might compare:
sleep duration for Grade 9 students
with:
sleep duration for Grade 11 students
A box plot can show differences in:
- median
- IQR
- overall spread
- possible outliers


A strong analysis describes these differences numerically rather than simply saying that the graphs "look different."
Investigating Relationships with Scatter Plots
Suppose your project asks:
"Is there an association between study time and test score?"
Collect paired data:
| Study Time |
Test Score (%) |
|---|---|
| 1.0 | 58 |
| 1.5 | 62 |
| 2.0 | 68 |
| 2.5 | 67 |
| 3.0 | 75 |
| 3.5 | 79 |
| 4.0 | 83 |
| 4.5 | 87 |
A scatter plot helps reveal the relationship.
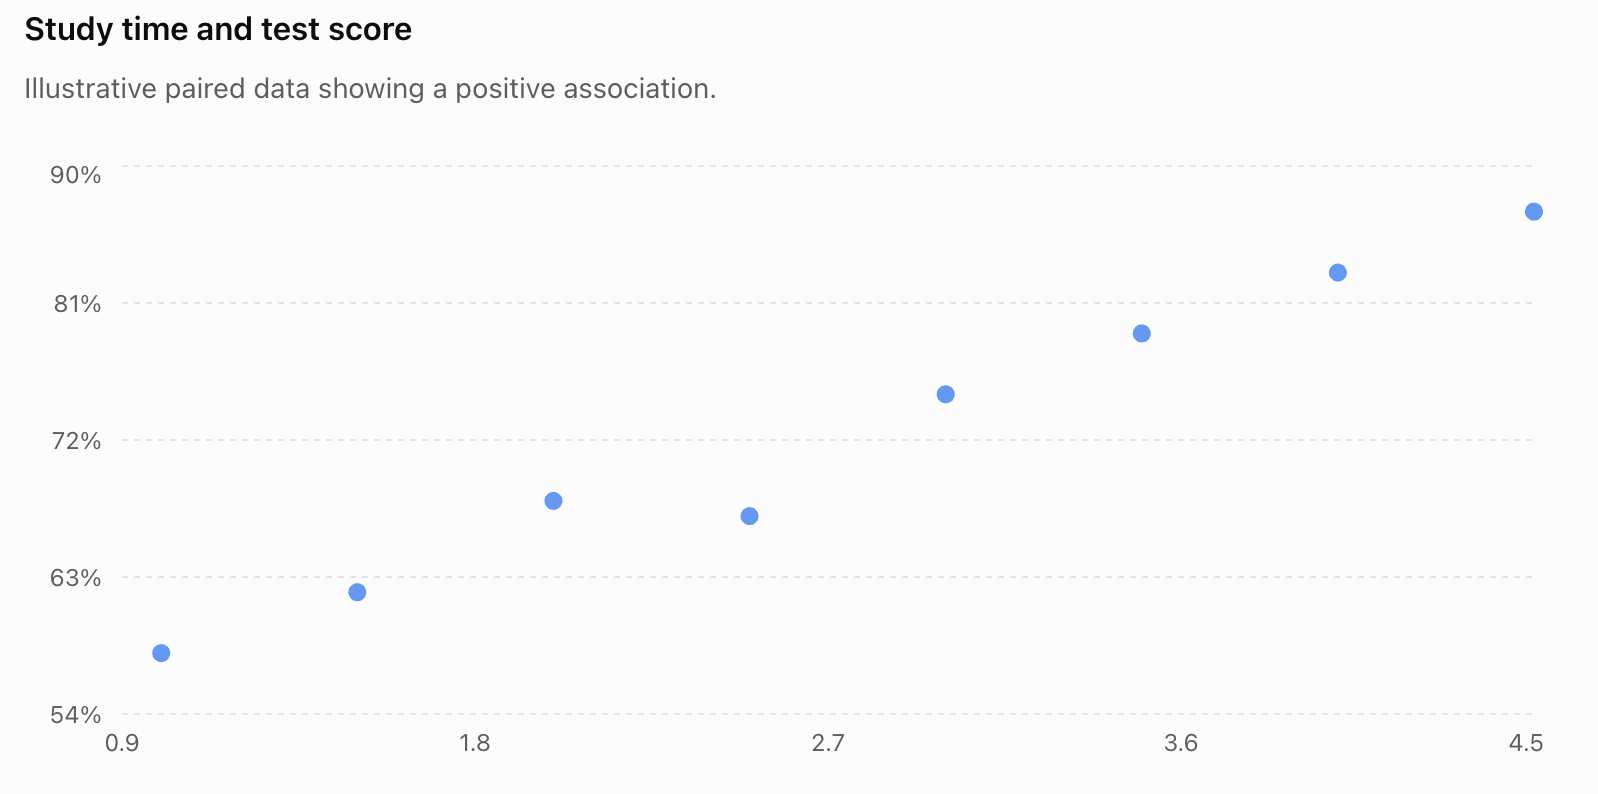
The data show a positive association:
students who studied longer tended to have higher scores in this illustrative data set.
But this does not automatically establish causation.
Correlation and Causation
Suppose your data show:
more sleep ↔ higher test scores
You should not automatically conclude:
more sleep caused higher test scores.
Other variables may include:
- study habits
- stress
- attendance
- health
- workload
- motivation
If your investigation is observational, a more appropriate conclusion is:
"Greater reported sleep duration was associated with higher test scores in the sample."
This describes what the evidence actually shows.
Using Probability in a Capstone Project
A capstone investigation can also focus on probability.
For example:
"Does this spinner behave according to its theoretical probabilities?"
Suppose a spinner has four equal sections.
The theoretical probability of each colour is:
1/4 = 25%
If it is spun 200 times, the expected frequency for each colour is:
200 × 1/4 = 50
Students can compare theoretical and experimental results.


Theoretical and Experimental Probability
Suppose 200 spins produce:
| Colour | Theoretical | Observed |
|---|---|---|
| Red | 50 | 54 |
| Blue | 50 | 46 |
| Green | 50 | 52 |
| Yellow | 50 | 48 |
The results are not exactly equal.
That is expected because of random variation.
Experimental probability for red:
54/200 = 0.27 = 27%
Theoretical probability:
25%
The difference alone does not prove that the spinner is biased.
Expected Value Investigations
Another possible project is to design or evaluate a game.
Suppose a game costs:
$2 to play
Possible outcomes are:
| Outcome | Probability | Prize |
|---|---|---|
| A | 1/10 | $10 |
| B | 2/10 | $3 |
| C | 7/10 | $0 |
Expected winnings:
E(X) = 10(1/10) + 3(2/10) + 0(7/10)
= 1 + 0.60
= $1.60
Expected net gain:
1.60 − 2.00
= −$0.40
Therefore, the player expects to lose:
$0.40 per play in the long run.
This could form the basis of an investigation into whether a game is mathematically fair.
Comparing Theoretical Predictions with Data
Probability projects can combine theory and experimentation.
For example:
- Calculate theoretical probabilities.
- Predict expected frequencies.
- Conduct the experiment.
- Record observed frequencies.
- Calculate experimental probabilities.
- Compare theoretical and experimental results.
- Explain differences using random variation.
- Evaluate whether the number of trials was sufficient.
This connects probability directly with statistical investigation.
Looking for Outliers
An outlier should be investigated rather than automatically removed.
Suppose most travel times are:
15–50 minutes
but one student reports:
180 minutes
Possible explanations include:
- the student genuinely travels a very long distance
- the student misunderstood the question
- the value was entered incorrectly
- unusual circumstances affected the journey
The correct response is not simply:
"Delete the outlier."
Instead ask:
Why is it unusual, and how does it affect the analysis?
Comparing Results With and Without an Outlier
Consider:
10, 12, 13, 14, 15, 16, 18, 80
Mean:
178/8 = 22.25
Median:
(14 + 15)/2 = 14.5
The value 80 has strongly increased the mean.
If 80 is a genuine observation, this is important information about the distribution.
The median may provide a better measure of a typical value, but the unusual observation should still be discussed.
Drawing Evidence-Based Conclusions
A conclusion should answer the original research question using actual evidence.
Weak conclusion:
"Students don't sleep much."
Better conclusion:
"The median reported sleep duration among the 120 sampled students was 6.9 hours, while the mean was 6.8 hours."
Stronger:
"The median reported sleep duration among the 120 sampled students was 6.9 hours. About 68% reported fewer than eight hours, suggesting that sleep durations below eight hours were common in this sample."
The conclusion becomes stronger because it refers directly to evidence.
Separate Results from Interpretation
It is useful to distinguish between:
Result:
"The median travel time was 31 minutes."
and:
Interpretation:
"This suggests that a typical student in the sample spent about half an hour travelling to school."
and:
Conclusion:
"The sample therefore provides evidence that travel times of approximately 30 minutes are typical among the students represented by the investigation."
These statements are related, but they perform different roles.
Avoid Overgeneralization
Suppose you survey 30 students from one Grade 10 class.
Your evidence applies directly to:
those 30 students.
It may provide some information about other Grade 10 students, but the ability to generalize depends on how representative the sample is.
It would be inappropriate to claim:
"Teenagers everywhere sleep 6.8 hours."
The conclusion must remain within the limits of the evidence.
Communicating Findings with Tables
Tables are useful when readers need exact values.
For example:
| Statistic | Sleep Duration |
|---|---|
| Sample size | 120 |
| Mean | 6.8 h |
| Median | 6.9 h |
| Q₁ | 6.2 h |
| Q₃ | 7.5 h |
| IQR | 1.3 h |
| Minimum | 4.5 h |
| Maximum | 9.5 h |
A table gives precise numerical information.
A graph can then help readers see the overall pattern.
Communicating Findings with Graphs
A good graph should be:
accurate
clearly labelled
easy to interpret
appropriate for the data
directly relevant to the research question
Avoid:
- unnecessary 3-D effects
- misleading scales
- missing units
- excessive decoration
- too many unrelated graphs
The goal is communication, not decoration.
Combining Graphs and Statistical Summaries
Strong statistical communication often combines several forms of evidence.
For example:
Histogram
Shows the shape of the distribution.
Median
Describes a typical value.
IQR
Describes the spread of the middle half.
Sample size
Shows how much data were collected.
Written interpretation
Explains what these results mean.
No single graph or statistic usually tells the complete story.
Writing the Final Report
A complete capstone report can be organized into the following sections.
Research Question
Clearly state what you investigated.
Background and Purpose
Explain why the question is interesting or useful.
Method
Explain:
- population
- sample
- sampling method
- variables
- collection procedure
Data
Present organized data or an appropriate summary.
Analysis
Include appropriate:
- graphs
- tables
- measures of centre
- measures of spread
- percentages
- probability calculations
- comparisons
- relationships
Findings
Describe the important patterns.
Conclusion
Answer the research question using evidence.
Evaluation
Discuss strengths, weaknesses, uncertainty, and improvements.
Evaluating Strengths
A strong investigation might have:
- a clearly defined research question
- an appropriate sample
- sufficient data
- consistent measurements
- neutral survey questions
- appropriate statistical calculations
- suitable graphs
- conclusions supported by evidence
- transparent reporting
Do not simply write:
"My project was good."
Identify specific strengths.
For example:
"A strength of the investigation was the use of stratified sampling across six grade levels, which reduced the risk that one grade would dominate the sample."
Evaluating Limitations
Every real investigation has limitations.
Possible limitations include:
- small sample size
- convenience sampling
- voluntary response
- non-response
- inaccurate measurements
- self-reported data
- unclear survey questions
- limited time
- missing data
- uncontrolled variables
- measurement precision
- unusual observations
- restricted population
A limitation should explain how it could affect the conclusion.
Weak:
"The sample was small."
Better:
"Only 25 students participated, so random differences between individuals may have had a relatively large effect on the sample statistics."
Self-Reported Data
Many student investigations use self-reported information.
For example:
"How many hours did you sleep last night?"
A participant may:
- forget
- estimate incorrectly
- round the answer
- misunderstand the question
- report what seems socially acceptable
Therefore, self-reported data should often be identified as a limitation.
Bias
Bias is a systematic influence that can move results away from an accurate representation of the population.
Possible forms include:
- selection bias
- voluntary response bias
- non-response bias
- wording bias
- measurement bias


Identifying bias is not simply a criticism of the project.
It demonstrates understanding of the quality of the evidence.
Random Variation Versus Bias
These ideas should not be confused.
Random variation causes unpredictable differences from sample to sample.
Bias systematically pushes results in a particular direction.
Increasing sample size generally helps reduce sampling variability.
However, simply collecting more observations does not necessarily remove bias.
A sample of 10,000 badly selected people can still be biased.
Reliability and Validity
Reliability asks:
Would the method give reasonably consistent results if repeated?
Validity asks:
Does the method actually measure what we intended to investigate?
For example, suppose we want to measure physical fitness using only student height.
Height can be measured very reliably.
But height is not a valid measure of overall fitness.
A strong project considers both reliability and validity.
Uncertainty
Statistical conclusions are rarely perfectly certain.
Sources of uncertainty include:
- sampling variation
- measurement error
- random processes
- missing data
- model assumptions
Appropriate statistical language includes:
"The data suggest..."
"The sample provides evidence that..."
"There appears to be an association..."
"Within this sample..."
This is not weak writing. It accurately represents what statistical evidence can establish.
Improving the Investigation
After identifying a limitation, propose a realistic improvement.
| Limitation | Possible Improvement |
|---|---|
| Sample too small | Collect data from more participants |
| Convenience sample | Use random or stratified sampling |
| Leading question | Rewrite using neutral language |
| Measurement inconsistency | Standardize the procedure |
| One measurement per person | Use repeated measurements |
| Missing groups | Include participants from those groups |
| Self-reported measurements | Use direct measurement where practical |
| Short investigation period | Collect data over a longer period |
Good evaluation connects each weakness to a practical improvement.
A Complete Example
Question
Is there an association between sleep duration and recreational screen time among Grade 10 students?
Plan
Population:
Grade 10 students at the school.
Sample:
80 students selected from several Grade 10 classes.
Variables:
- reported sleep duration in hours
- reported recreational screen time in hours
Collection
Students complete an anonymous questionnaire.
Organization
Responses are entered into a spreadsheet with one student per row.
Analysis
Calculate:
- mean and median sleep duration
- mean and median screen time
- range and IQR
- scatter plot
- possible correlation pattern
Possible Finding
Students reporting higher screen time tend to report somewhat lower sleep duration.
Appropriate Conclusion
"The sample showed a negative association between reported recreational screen time and reported sleep duration."
Inappropriate Conclusion
"Phones cause students to sleep less."
The investigation is observational and cannot establish that causal claim by itself.
Limitations
- self-reported data
- possible non-response
- other variables were not controlled
- data came from one school
- screen-time estimates may be inaccurate
Improvements
Future investigations could use:
- larger samples
- data from several schools
- device-recorded screen time
- sleep tracking
- additional variables such as workload or exercise
This turns a simple data collection exercise into a complete statistical investigation.
Capstone Project Workflow
A practical workflow is:
Choose a meaningful statistical question.
Plan the population, sample, variables, and method.
Predict what you think the data might show, if appropriate.
Collect the data carefully.
Check the data for errors and missing values.
Organize the data into useful tables.
Calculate appropriate statistical summaries.
Visualize the data using suitable graphs.
Analyze patterns, differences, distributions, or relationships.
Interpret what those patterns mean.
Conclude using evidence.
Evaluate strengths, limitations, uncertainty, and bias.
Improve the investigation by suggesting realistic changes.
Present the findings clearly.


Suggested Capstone Project Checklist
Before submitting a project, check that you can answer yes to most of these questions:
- Is my research question clearly stated?
- Is it genuinely statistical?
- Have I identified my population?
- Have I explained how my sample was selected?
- Have I identified my variables?
- Did I collect relevant data?
- Did I organize and check my data?
- Did I use appropriate statistical summaries?
- Did I choose appropriate graphs?
- Are my graphs correctly labelled?
- Did I interpret the graphs rather than simply include them?
- Did I answer the original research question?
- Did I support my conclusion with numerical evidence?
- Did I distinguish correlation from causation?
- Did I discuss possible bias?
- Did I identify limitations?
- Did I suggest realistic improvements?
- Are my conclusions no stronger than the evidence allows?
Common Mistakes
Starting without a clear research question
Collecting random data and deciding what to investigate afterward often produces a weak project.
Collecting data that do not answer the question
Every variable should have a purpose.
Using a biased sample
Convenient data are not necessarily representative data.
Using every possible statistical calculation
More calculations do not automatically create a better analysis. Choose statistics that help answer the question.
Choosing inappropriate graphs
Match the graph to the type of data and the purpose of the analysis.
Reporting graphs without interpreting them
Explain what the patterns actually mean.
Ignoring spread
Two groups can have similar averages but very different variability.
Deleting outliers automatically
Investigate unusual observations before deciding how to treat them.
Confusing association with causation
Observational data generally cannot establish causation by themselves.
Making claims beyond the population studied
A small sample from one school does not necessarily represent all teenagers.
Hiding inconvenient results
A statistical investigation should report the evidence honestly, even when the results do not support the original prediction.
Ignoring limitations
Recognizing limitations strengthens the investigation because it demonstrates critical statistical reasoning.
Key Terms
Capstone project — a culminating investigation that combines multiple skills and concepts into a complete study.
Statistical investigation — a systematic process of answering a question using data.
Research question — the specific question an investigation attempts to answer.
Population — the complete group about which conclusions are intended.
Sample — the subset of the population from which data are collected.
Representative sample — a sample that reasonably reflects important characteristics of the population.
Variable — a characteristic that can take different values.
Categorical data — observations classified into groups or categories.
Numerical data — observations represented by numerical measurements or counts.
Frequency — the number of times an outcome or category occurs.
Relative frequency — the proportion of observations belonging to an outcome or category.
Mean — the sum of numerical observations divided by their number.
Median — the middle observation in ordered data.
Mode — the most frequently occurring value or category.
Range — the difference between the maximum and minimum.
Interquartile range (IQR) — Q₃ − Q₁, describing the spread of the middle 50% of observations.
Distribution — the overall pattern of values in a data set.
Outlier — an observation unusually distant from the rest of the data.
Correlation — a statistical association between variables.
Expected frequency — the number of occurrences predicted from a probability model over a specified number of trials.
Expected value — the probability-weighted average numerical outcome of a random process.
Bias — a systematic influence that can distort results.
Random variation — natural unpredictable differences produced by sampling or random processes.
Reliability — the consistency of measurements or procedures.
Validity — the extent to which an investigation measures what it intends to measure.
Limitation — a feature of an investigation that restricts the strength or generalizability of its conclusions.
Key Takeaways
- A capstone data project combines the complete statistical investigation process in one independent study.
- Strong investigations begin with specific, measurable statistical questions.
- Planning should occur before data collection.
- The population, sample, sampling method, and variables should be clearly identified.
- Representative sampling is important when making conclusions about a population.
- Data should be collected consistently and checked before analysis.
- Statistical tools should be selected according to the question and type of data.
- Measures of centre describe typical values, while measures of spread describe variability.
- Graphs and tables should clarify the evidence rather than simply decorate the presentation.
- Scatter plots can reveal associations, but association alone does not establish causation.
- Probability investigations can compare theoretical probabilities, expected outcomes, and experimental results.
- Conclusions should answer the original question and refer directly to numerical or graphical evidence.
- Strong conclusions acknowledge uncertainty.
- Limitations should explain how weaknesses could affect the results.
- Improvements should directly address identified limitations.
- A successful capstone project demonstrates not only the ability to calculate statistics but the ability to use data to reason, evaluate evidence, and communicate a justified conclusion.
Check Your Understanding
- Explain why a capstone data project should begin with a research question rather than simply collecting interesting data.
- Rewrite "Are teenagers unhealthy?" as a specific statistical question that could realistically be investigated.
- A student wants to investigate travel time among all students at a school but surveys only 20 students from their homeroom. Identify a limitation and suggest an improvement.
- Explain why increasing the size of a strongly biased sample does not necessarily solve the problem.
- For each variable, classify it as categorical, discrete numerical, or continuous numerical: transportation method, number of siblings, height, favourite subject, daily screen time.
- A data set contains 12, 14, 15, 16, 16, 17, 18, 82. Explain why the mean and median may give very different impressions of a typical value.
- Explain when you would choose a bar graph, histogram, box plot, and scatter plot.
- Two groups have the same median but very different IQRs. What does this tell you about the groups?
- A scatter plot shows that students who report more exercise also report higher happiness scores. Write an appropriate statistical conclusion that does not incorrectly claim causation.
- A spinner is designed so that P(red) = 0.40. Calculate the expected number of red results in 500 spins. Explain why the actual number does not have to equal this value exactly.
- A student finds an unexpected outlier and immediately deletes it. Explain why this is poor statistical practice.
- Explain the difference between random variation and bias. Which problem can usually be reduced by increasing the sample size?
- Design a capstone investigation involving two numerical variables. State your research question, population, sample, variables, collection method, appropriate graph, and at least two statistical summaries you would use.
- Suppose your results do not support your original prediction. Explain what you should do when writing the final report.
- Imagine that you have completed your capstone project. Write an outline for the final presentation showing how you would communicate your question, method, data, graphs, statistical analysis, conclusion, strengths, limitations, and possible improvements.