Data, Probability, and Decision Making
1. Making Predictions from Data
Learning outcomes
- I can identify trends and patterns in data.
- I can use data to make predictions.
- I can evaluate the reliability of predictions.
- I can explain limitations of forecasting.
- I can justify predictions using evidence from data.
Making Predictions from Data
Data can help us understand what has happened in the past and make informed predictions about what might happen in the future.
A prediction is an estimate of an unknown or future value based on available information.
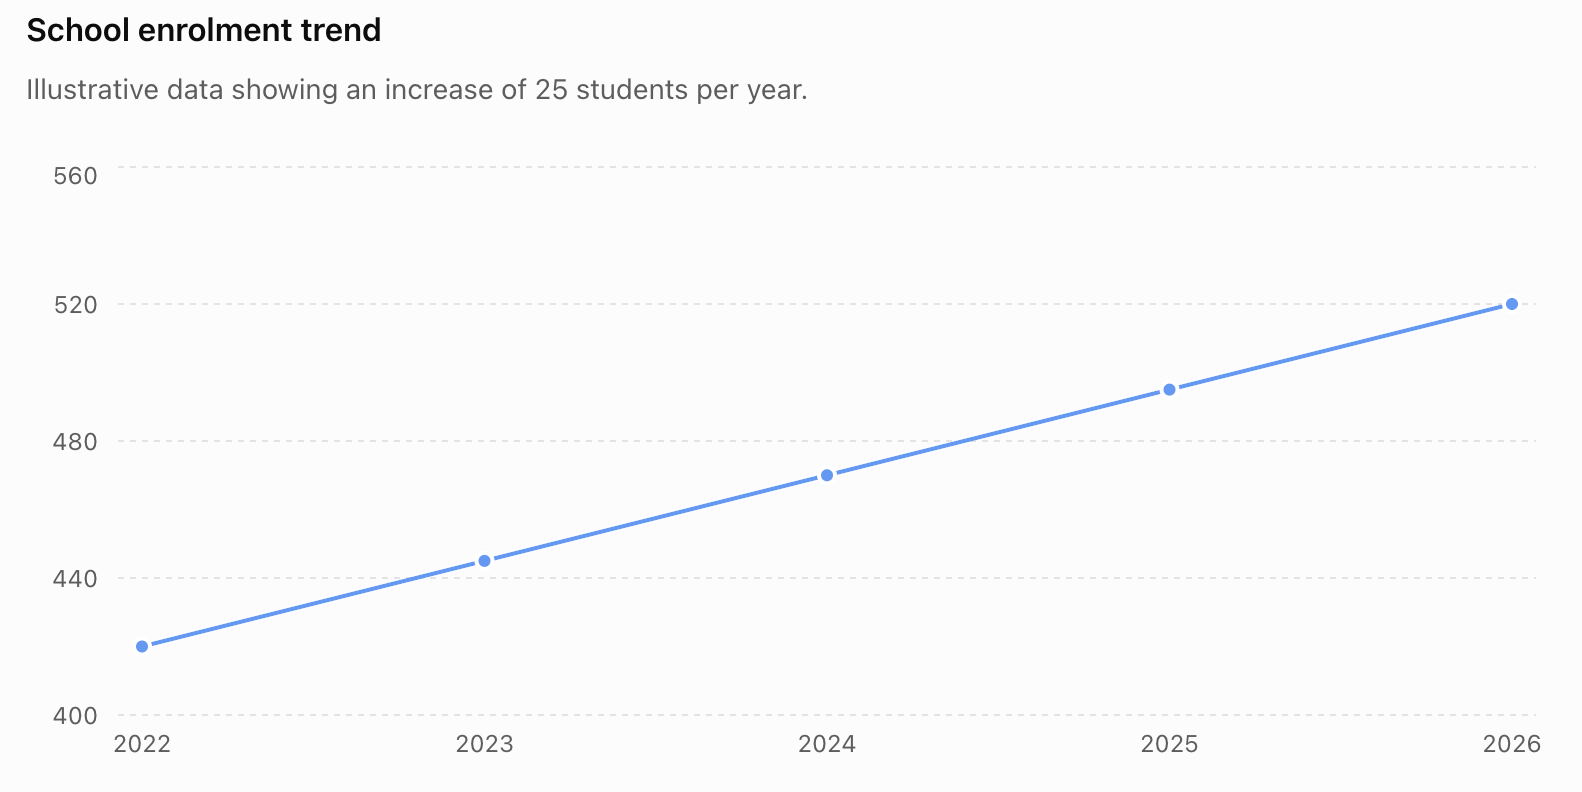
For example, suppose a school's enrolment has been:
| Year | Students |
|---|---|
| 2022 | 420 |
| 2023 | 445 |
| 2024 | 470 |
| 2025 | 495 |
| 2026 | 520 |
The number of students has increased by approximately 25 each year. If this pattern continues, we might predict:
2027 enrolment ≈ 545 students
This prediction is supported by the observed trend. However, it is still a prediction—not a guarantee.
Identifying Trends
A trend is the general direction in which data change.
Three common trends are:
Increasing trend — values generally increase.
Decreasing trend — values generally decrease.
No clear trend — values fluctuate without a consistent overall direction.
For example:
12, 15, 19, 22, 26
shows an increasing trend.
80, 73, 69, 61, 55
shows a decreasing trend.
20, 35, 18, 32, 21
does not show a simple consistent trend.
Trends Do Not Need to Be Perfect
Real data rarely follow a perfectly smooth pattern.
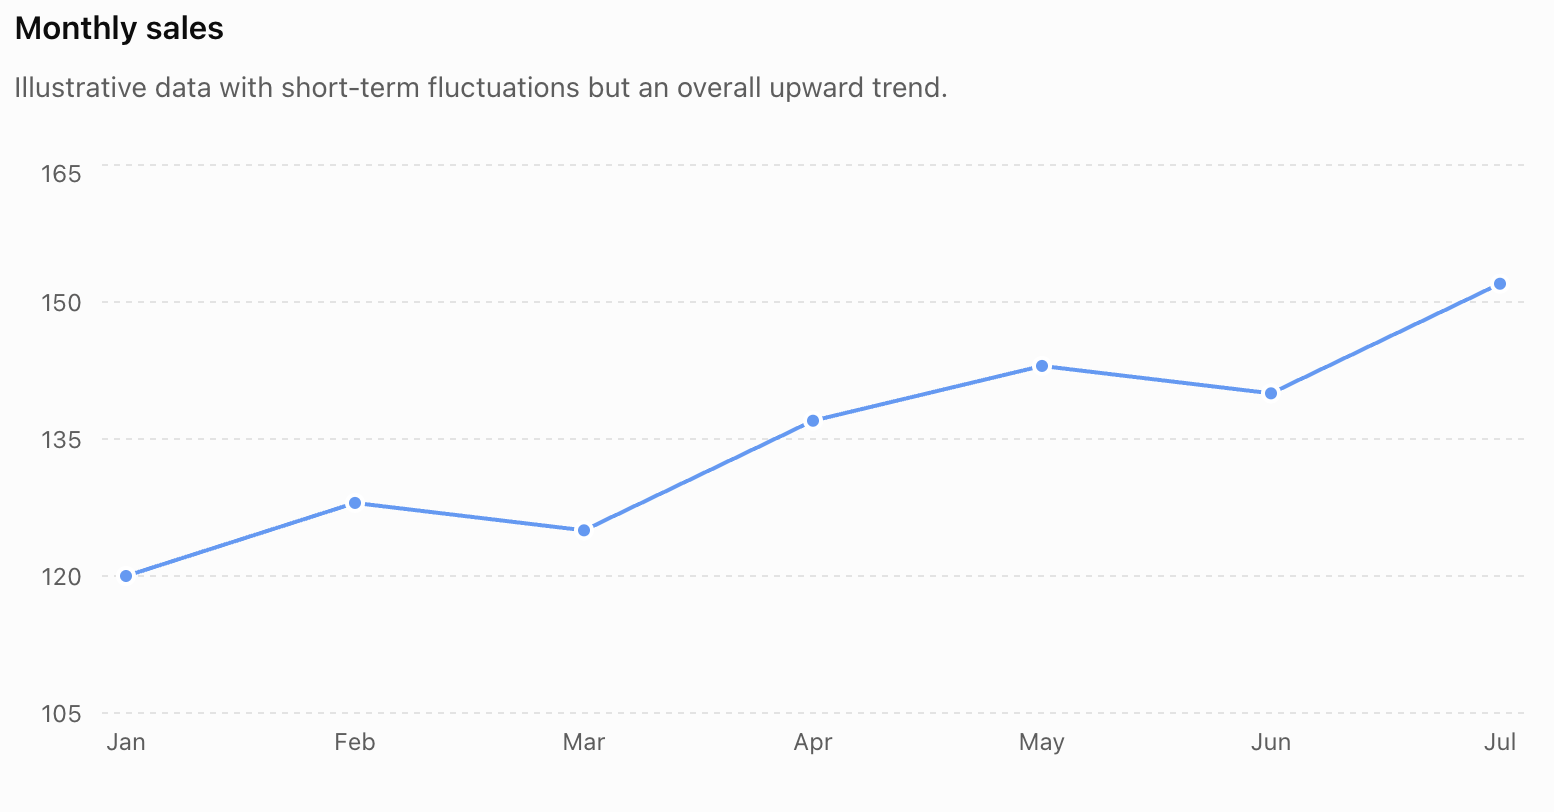
Consider:
| Month | Sales |
|---|---|
| January | 120 |
| February | 128 |
| March | 125 |
| April | 137 |
| May | 143 |
| June | 140 |
| July | 152 |
Sales occasionally decrease, but the overall trend is upward.
We should therefore distinguish between short-term fluctuations and the broader pattern.
Patterns in Data
A pattern is a recognizable structure or regularity in data.
Patterns can include:
- constant increases or decreases
- repeating cycles
- seasonal changes
- proportional relationships
- accelerating growth
- slowing growth
- clusters
- unusual values
- relationships between variables
Recognizing the type of pattern helps us decide how predictions should be made.
Constant Change
Consider:
5, 8, 11, 14, 17
The difference between consecutive values is always:
+3
If the pattern continues, the next value would be:
20
This is a linear pattern because the change is constant.
Percentage Growth
Some quantities increase by a percentage rather than by a constant amount.
Suppose a population increases by 5% each year.
If the current population is 20,000:
Next year:
20,000 × 1.05 = 21,000
The following year:
21,000 × 1.05 = 22,050
The amount added becomes larger each year.
This produces an exponential pattern rather than a linear one.
Cyclical and Seasonal Patterns
Some patterns repeat.
For example, electricity consumption might rise every summer because of air-conditioning use and then fall during cooler months.
Retail sales may rise each December and fall in January.
This is a seasonal pattern.
If we ignored the seasonal cycle and simply extended a short-term increase, our prediction could be misleading.
Scatter Plots and Relationships
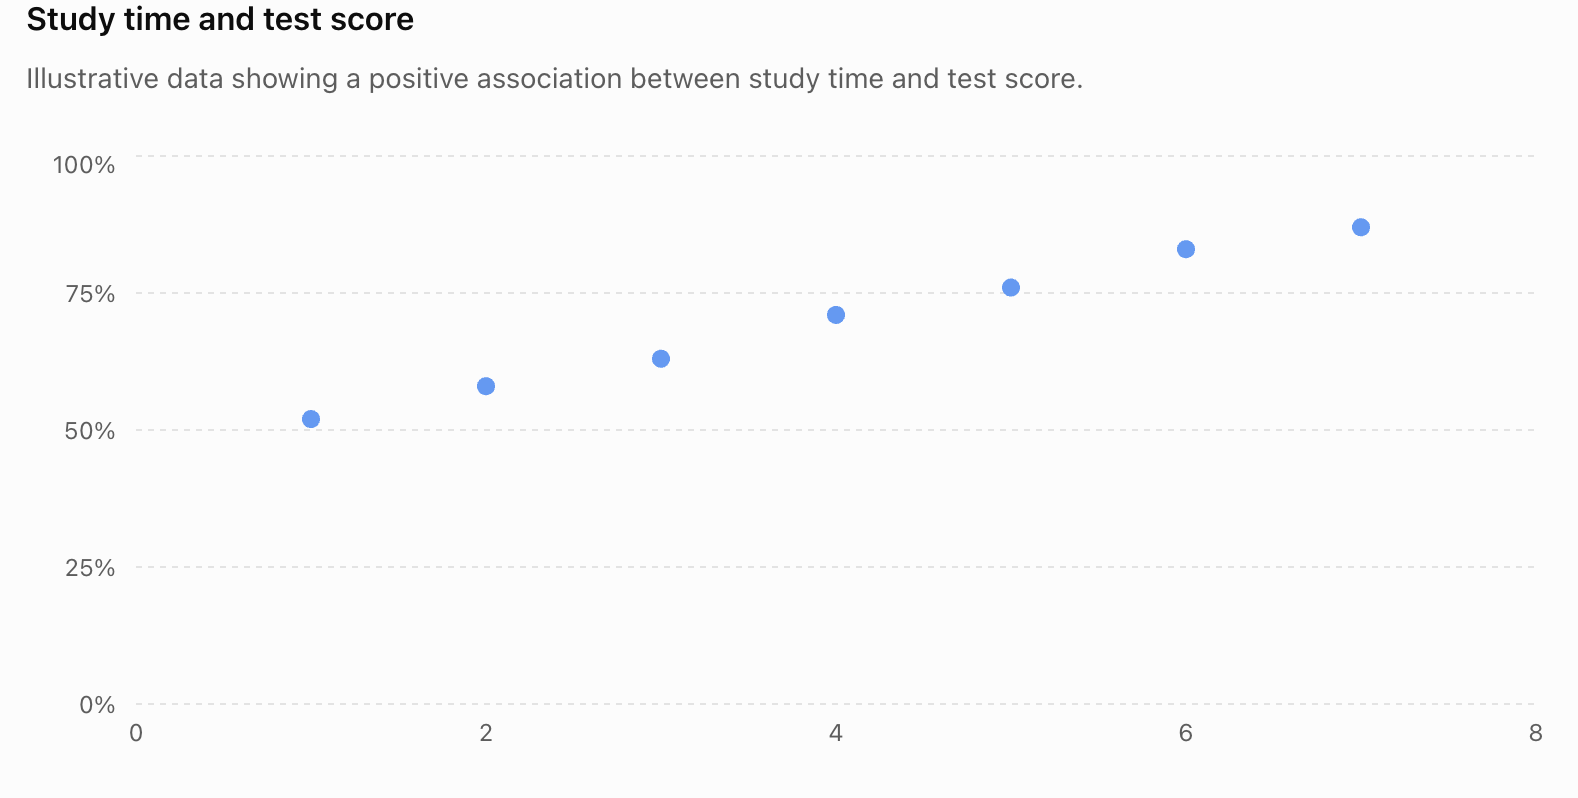
When data involve two numerical variables, a scatter plot can help reveal whether they are related.
For example, consider hours studied and test scores.
| Hours Studied | Test Score (%) |
|---|---|
| 1 | 52 |
| 2 | 58 |
| 3 | 63 |
| 4 | 71 |
| 5 | 76 |
| 6 | 83 |
| 7 | 87 |