Measures of Central Tendency and Spread
1. Mean (Average)
Learning outcomes
- I can calculate the mean of a dataset.
- I can explain what the mean represents.
- I can interpret averages in real-world situations.
- I can compare datasets using their means.
- I can recognize situations where the mean may be misleading.
Mean (Average)
The mean, often called the average, is one of the most common ways to describe a set of numerical data using a single value.
You encounter means in everyday life all the time:
- average test scores
- average temperatures
- average rainfall
- average travel times
- average heights
- average speeds
- average prices
- average monthly spending
- average points scored in a game
The mean helps us answer the question:
"What value could represent the dataset as a whole?"
However, a mean does not tell us everything about a dataset. Two groups can have the same mean while containing very different values, and unusually high or low values can sometimes make the mean misleading.
Understanding the mean therefore involves more than knowing how to calculate it. You also need to know what it represents and when it is useful.


What Is the Mean?
The mean is found by adding all the values in a dataset and then dividing by the number of values.
Mean = sum of all values ÷ number of values
The symbol Σ (Greek capital sigma) is sometimes used to mean "the sum of."
So you may also see:
Mean = Σx ÷ n
where:
- Σx = sum of all the values
- n = number of values
For most calculations, however, the important idea is simply:
Add → Count → Divide
Understanding the Mean as Equal Sharing
Another way to understand the mean is as equal sharing.
Suppose four students collect:
2, 4, 6, and 8 samples
Altogether they have:
2 + 4 + 6 + 8 = 20 samples
If the 20 samples were shared equally among the four students:
20 ÷ 4 = 5
So the mean is:
5 samples
The mean can therefore be thought of as the value each member would have if the total were redistributed equally.
This interactive visualization shows that equal-sharing idea directly:
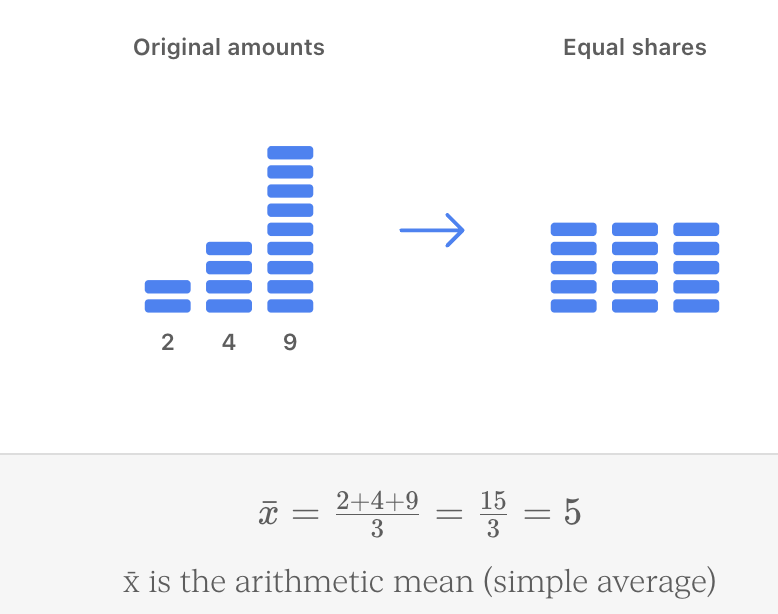
This interpretation is useful because the mean does not have to be one of the original values.
For example:
2, 4, 9
Mean = 15 ÷ 3
Mean = 5
There was no 5 in the original dataset, but 5 represents the value obtained if the total were shared equally.
Calculating the Mean
Consider the dataset:
6, 8, 7, 9, 10
Add the values
6 + 8 + 7 + 9 + 10 = 40
Count the values
There are 5 values.
Divide
Mean = 40 ÷ 5
Mean = 8
A useful routine is:
Add → Count → Divide
Worked Example: Test Scores
Five students receive the following scores:
72, 81, 76, 89, 82
Add the scores:
72 + 81 + 76 + 89 + 82 = 400
Number of scores:
5
Mean = 400 ÷ 5
Mean = 80
We could therefore say:
The mean test score was 80.
Notice that no student actually received exactly 80.
That is completely possible.
The mean is a representative calculated value, not necessarily an observed value.


The Mean Can Be a Decimal
Consider:
4, 7, 6, 8
Sum:
4 + 7 + 6 + 8 = 25
Number of values:
4
Mean = 25 ÷ 4
Mean = 6.25
The mean does not need to be a whole number.
A Mean Can Be a Value That Is Impossible in Reality
Suppose five families have:
1, 2, 2, 3, 4 children
Total:
1 + 2 + 2 + 3 + 4 = 12
Mean:
12 ÷ 5 = 2.4 children
No family has 2.4 children.
But the mean is still mathematically valid.
It represents the average number of children per family, not the number of children in one particular family.
This is an important idea:
An average describes a dataset. It does not necessarily describe an actual individual member of the dataset.
Why Do We Calculate Means?
Imagine comparing the heights of plants grown under two different conditions.
Group A
14 cm, 15 cm, 13 cm, 16 cm, 17 cm
Group B
19 cm, 20 cm, 18 cm, 21 cm, 22 cm
Looking at every number is possible, but comparing the means makes the overall difference easier to see.
Group A
Mean = (14 + 15 + 13 + 16 + 17) ÷ 5
Mean = 75 ÷ 5
Mean = 15 cm
Group B
Mean = (19 + 20 + 18 + 21 + 22) ÷ 5
Mean = 100 ÷ 5
Mean = 20 cm
We can summarize the data:
Group B had a mean plant height 5 cm greater than Group A.


Comparing Datasets Using Means
Means are especially useful when comparing groups.
Suppose two basketball teams score the following points over five games.
Team A
70, 75, 80, 85, 90
Mean:
400 ÷ 5 = 80 points
Team B
76, 78, 80, 82, 84
Mean:
400 ÷ 5 = 80 points
Both teams have the same mean:
80 points
Does this mean their performances were identical?
No.
Team A's scores ranged from 70 to 90.
Team B's scores ranged only from 76 to 84.
The averages are identical, but Team B's scores are more tightly grouped.
This demonstrates an important principle:
The mean tells us about the centre of a dataset, but not how spread out the values are.
Mean and Range Together
A useful way to compare datasets is to consider both:
Mean → typical or central value
Range → spread of the data
For the basketball example:
Team A
Mean = 80
Range = 90 − 70 = 20
Team B
Mean = 80
Range = 84 − 76 = 8
Now we have a more complete description.
Both teams have the same mean, but Team B has less variation in its scores.
Using Means in Science
Means are extremely important in scientific investigations.
Suppose a student measures the time required for a toy car to travel a fixed distance.
The student performs five trials:
2.31 s
2.28 s
2.35 s
2.30 s
2.26 s
Sum:
2.31 + 2.28 + 2.35 + 2.30 + 2.26 = 11.50 s
Mean:
11.50 ÷ 5 = 2.30 s
Instead of selecting one trial to represent the experiment, the student can report:
Mean travel time = 2.30 s
Using repeated measurements and calculating a mean can provide a more useful summary than relying on a single trial.


Mean in Real-World Situations
Means help summarize large amounts of information.
Weather
If daily temperatures are:
29 °C, 31 °C, 30 °C, 32 °C, 28 °C
Mean temperature:
(29 + 31 + 30 + 32 + 28) ÷ 5
= 150 ÷ 5
= 30 °C
Travel
Travel times to school:
25 min, 30 min, 28 min, 27 min, 35 min
Mean:
145 ÷ 5
= 29 min
Sports
Points scored:
18, 24, 20, 16, 22
Mean:
100 ÷ 5
= 20 points
Science
Reaction times:
42 s, 39 s, 41 s, 40 s, 43 s
Mean:
205 ÷ 5
= 41 s
In each situation, several measurements are summarized using one representative number.


Finding a Missing Value Using the Mean
Sometimes you know the mean but one value is missing.
Suppose five test scores have a mean of 80.
The known scores are:
72, 85, 78, 81, ?
If the mean is 80:
Total required = mean × number of values
Total = 80 × 5
Total = 400
Add the known scores:
72 + 85 + 78 + 81 = 316
Missing score:
400 − 316 = 84
Therefore:
Missing score = 84
Check:
(72 + 85 + 78 + 81 + 84) ÷ 5 = 400 ÷ 5
= 80
The Mean Changes When Data Change
Consider:
4, 5, 6
Mean:
15 ÷ 3 = 5
Now increase the final value from 6 to 9:
4, 5, 9
Mean:
18 ÷ 3 = 6
The total increased by 3.
Since there are three values, the mean increased by:
3 ÷ 3 = 1
This shows that every value contributes to the mean.
Adding a Value Equal to the Mean
Consider:
6, 8, 10
Mean:
24 ÷ 3 = 8
Now add another value of 8:
6, 8, 10, 8
Mean:
32 ÷ 4 = 8
The mean does not change.
Why?
Because the new value is exactly equal to the original mean.
Adding a Value Above or Below the Mean
Suppose the mean of a dataset is 20.
If you add a new value:
greater than 20
the mean will increase.
If you add a new value:
less than 20
the mean will decrease.
If you add:
exactly 20
the mean will remain unchanged.
This allows you to predict how new data will affect an average without always calculating the complete mean again.
Outliers and the Mean
An outlier is a value that is unusually high or low compared with the rest of the data.
Consider:
10, 11, 9, 10, 10
Mean:
50 ÷ 5 = 10
Now consider:
10, 11, 9, 10, 50
Mean:
90 ÷ 5 = 18
Most values are still around 9–11.
But the single value 50 has pulled the mean upward dramatically.
This shows that the mean can be sensitive to extreme values.


When the Mean Can Be Misleading
Consider the annual incomes of five people:
$30,000
$32,000
$35,000
$38,000
$365,000
Total:
$500,000
Mean:
$500,000 ÷ 5 = $100,000
Would it be reasonable to say that a typical person in this group earns about $100,000?
Not really.
Four of the five people earn less than $40,000.
The unusually high income has pulled the mean upward.
The calculation is correct.
The problem is with the interpretation.
This is an important distinction:
A mean can be mathematically correct while still giving a misleading impression of a dataset.
Mean and Median
When extreme values are present, another measure called the median may sometimes describe the centre more effectively.
Consider again:
30,000, 32,000, 35,000, 38,000, 365,000
Mean = 100,000
The median is the middle value:
35,000
In this example, the median is much closer to what most people in the group earn.
This does not mean that the median is always "better."
It means that the most useful measure depends on the shape and purpose of the data.
Mean and Mode
Another measure of central tendency is the mode.
Consider:
4, 5, 5, 5, 7, 8
Mean:
34 ÷ 6 ≈ 5.67
Mode:
5
The mean uses every numerical value.
The mode identifies the most frequently occurring value.
Depending on the question, either may provide useful information.
Measures of Central Tendency
Mean, median, and mode are known as measures of central tendency.
They describe the centre or typical value of data in different ways.
| Measure | Meaning |
|---|---|
| Mean | Sum of values ÷ number of values |
| Median | Middle value when ordered |
| Mode | Most frequently occurring value |
Each answers a slightly different question.
The mean is especially useful when:
- the data are numerical
- all values should contribute
- there are no extreme values severely distorting the result
Comparing Means Carefully
Suppose:
Class A
Mean test score = 76%
Class B
Mean test score = 81%
We can say:
Class B had a higher mean score.
But we should not automatically conclude:
Every student in Class B scored higher than every student in Class A.
The datasets may overlap considerably.
For example, Class A might contain a student scoring 95%, while Class B contains a student scoring 60%.
A mean describes the group, not every individual within it.
Means and Sample Size
Suppose one survey asks five people how many hours they sleep.
Mean = 7.2 hours
Another survey asks 5,000 people.
Mean = 7.2 hours
The means are identical.
But the second result may provide stronger information about the wider population if the sample was selected appropriately.
When interpreting a reported mean, ask:
- How many observations were included?
- Who or what was measured?
- Was the sample representative?
- Were extreme values present?
- How much variation was there?
The mean should always be interpreted in the context of the dataset.
Weighted Means
Sometimes values do not contribute equally to an overall average.
Suppose your course grade consists of:
- homework: 20%
- project: 30%
- final test: 50%
If your scores are:
Homework = 90%
Project = 80%
Final test = 70%
You should not simply calculate:
(90 + 80 + 70) ÷ 3 = 80%
because the components have different importance.
Instead:
Homework contribution:
90 × 0.20 = 18
Project contribution:
80 × 0.30 = 24
Final test contribution:
70 × 0.50 = 35
Total:
18 + 24 + 35 = 77
Weighted mean = 77%
A weighted mean gives some values greater influence than others.
Averages Can Hide Important Information
Suppose two science classes complete the same test.
Class A
60, 65, 70, 75, 80
Mean = 70
Class B
40, 40, 70, 100, 100
Mean = 70
The classes have the same mean.
But their score distributions are very different.
Class A's results are relatively clustered.
Class B's results are much more spread out.
Reporting only:
"Both classes averaged 70."
hides this important information.
Whenever possible, examine the original data or measures of spread alongside the mean.
Averages in Headlines and Advertising
You may encounter statements such as:
"The average customer saves $500!"
Before interpreting the claim, ask:
- Is "average" the mean?
- How many customers were included?
- What were the individual savings?
- Were there extreme values?
- What time period was used?
- Were all customers included?
- How was the sample selected?
The word average can sound convincing while hiding important details about the underlying data.
Good statistical thinking means looking beyond the single number.
Worked Example: Comparing Experimental Results
Two groups measure reaction time.
Group A
12.1 s, 12.3 s, 12.0 s, 12.2 s, 12.4 s
Mean:
(12.1 + 12.3 + 12.0 + 12.2 + 12.4) ÷ 5
= 61.0 ÷ 5
= 12.2 s
Group B
9.0 s, 10.5 s, 12.0 s, 13.5 s, 16.0 s
Mean:
61.0 ÷ 5
= 12.2 s
Again, the means are identical.
But:
Group A range = 12.4 − 12.0 = 0.4 s
Group B range = 16.0 − 9.0 = 7.0 s
Group A's measurements are much more consistent.
This is why scientists should not evaluate experimental data using the mean alone.
Estimating a Mean
Sometimes you may want to estimate a mean quickly.
Consider:
49, 51, 50, 52, 48
Even before calculating, you can see that the values cluster around:
50
So you would expect the mean to be close to 50.
The exact calculation gives:
250 ÷ 5 = 50
Estimating before calculating is useful because it helps you detect mistakes.
If your calculator gave:
500
you would immediately know something had gone wrong.
Checking Whether Your Mean Is Reasonable
For ordinary datasets, the mean should lie between the smallest and largest values.
For example:
12, 15, 18, 20
The mean cannot be:
25
because 25 is greater than every value.
Likewise, it cannot be:
5
because 5 is lower than every value.
A useful check is:
minimum value ≤ mean ≤ maximum value
If your calculated mean lies outside this range, check your calculation.
Common Mistakes
Forgetting to include every value
Every observation must be included unless there is a justified reason for excluding one.
Dividing by the wrong number
Divide by the number of values, not by the largest value or the sum.
Miscounting the data
Repeated numbers still count as separate observations.
For:
4, 4, 6, 7
there are four values, not three different values.
Rounding too early
Keep sufficient decimal places during calculations and round at the end when necessary.
Assuming the mean must appear in the dataset
The mean is calculated and may not be one of the original values.
Assuming "average" always means mean
Average can refer to mean, median, or mode depending on context.
Ignoring outliers
Extreme values can strongly affect the mean.
Comparing groups using only the mean
Datasets with identical means can have very different spreads.
Assuming a higher group mean means every value is higher
Means describe groups, not individual members.
Trusting an average without knowing the dataset
Ask about sample size, spread, outliers, and how the data were collected.
Key Terms
Data — Information collected through measurements, observations, surveys, or other methods.
Dataset — A collection of related data values.
Mean — The sum of all values divided by the number of values.
Average — A general term for a value used to represent a dataset; often used to mean the arithmetic mean.
Arithmetic mean — The standard mean calculated by adding all values and dividing by the number of values.
Sum — The result of adding values together.
Observation — One individual value or measurement in a dataset.
Frequency — The number of times a value occurs.
Central tendency — The tendency of data to cluster around a central or representative value.
Measure of central tendency — A numerical measure used to describe the centre of a dataset, such as mean, median, or mode.
Median — The middle value when data are arranged in numerical order.
Mode — The value occurring most frequently.
Range — The difference between the highest and lowest values.
Spread — The amount of variation among values in a dataset.
Variation — Differences among individual values.
Outlier — A value unusually far from most of the other values.
Extreme value — A particularly high or low value that may strongly influence the mean.
Sample — A group selected from a larger population for investigation.
Sample size — The number of observations included in a sample.
Population — The entire group about which information is being investigated.
Weighted mean — A mean in which some values contribute more strongly than others.
Representative value — A value used to summarize or describe a dataset.
Relative comparison — Comparing values in relation to one another rather than considering only their individual sizes.
Key Takeaways
- The mean is one way of describing the centre of numerical data.
- Calculate the mean using Add → Count → Divide.
- The mean uses every value in the dataset.
- The mean can be interpreted as the value obtained if the total were shared equally among all observations.
- A mean does not have to be one of the original data values.
- A mean can be a decimal even when all original values are whole numbers.
- Means allow large datasets to be summarized using a single number.
- Means are useful for comparing groups.
- A higher mean does not mean that every individual value in one group is higher.
- Two datasets can have exactly the same mean while having very different distributions.
- The range provides information about spread that the mean does not.
- Means are commonly used to summarize repeated measurements in scientific investigations.
- Every value contributes to the mean.
- Adding a value above the existing mean raises the mean.
- Adding a value below the existing mean lowers the mean.
- Adding a value equal to the existing mean leaves it unchanged.
- Outliers can strongly affect the mean.
- A mathematically correct mean can still give a misleading impression of a dataset.
- The median may sometimes provide a more useful measure of centre when extreme values are present.
- Mean, median, and mode are different measures of central tendency.
- Sample size and sampling method should be considered when interpreting averages.
- Weighted means are used when different values have different levels of importance.
- A mean should normally lie between the smallest and largest values in the dataset.
- Good statistical thinking means examining the data behind the average, not simply accepting the reported mean.
The most important questions to ask are:
What is the mean?
What does it represent in this situation?
How spread out are the original values?
Are there any extreme values?
Does the mean give a fair picture of the dataset?
Check Your Understanding
1. Calculate the mean:
8, 12, 10, 14, 6
2. Calculate the mean:
3.5, 4.2, 5.1, 4.8, 2.4
3. Five students score:
68, 74, 82, 91, 85
Calculate the mean score.
4. Explain what the mean represents.
5. Why does the mean not need to be one of the original values?
6. The mean of five values is 12. What is their total?
7. Four scores are:
72, 81, 76, 83
A fifth score is added, producing a mean of 80.
What is the missing score?
8. Dataset A:
10, 11, 12, 13, 14
Dataset B:
2, 7, 12, 17, 22
Calculate the mean of each dataset.
9. Calculate the range of each dataset in Question 8.
10. Explain why the datasets in Questions 8–9 should not be considered identical even though their means are equal.
11. A dataset has a mean of 25. A new value of 40 is added. Will the mean increase, decrease, or stay the same? Explain.
12. A dataset has a mean of 25. A new value of 25 is added. What happens to the mean?
13. Calculate the mean:
8, 9, 9, 10, 44
14. Explain why the mean in Question 13 may give a misleading impression of the typical value.
15. A company states that its employees earn an average salary of $90,000. What additional information would you want before deciding whether $90,000 represents what a typical employee earns?
16. Explain the difference between mean and median.
17. Two classes both have a mean score of 75%. Class A has a range of 8 percentage points while Class B has a range of 42 percentage points. What does this tell you about their results?
18. A student's course contains three components:
Assignments = 80%, weighted 20%
Project = 70%, weighted 30%
Exam = 90%, weighted 50%
Calculate the student's weighted mean.
19. Why is calculating a mean from repeated experimental measurements usually more informative than reporting only one measurement?
20. Challenge: A dataset contains five numbers and has a mean of 18. Four of the numbers are:
12, 16, 19, 21
Determine the fifth number and explain how you found it.