5. Real-World Applications of Ratios

Learning outcomes
  • I can use ratios in maps, recipes, and scale drawings.
  • I can solve problems involving mixtures and comparisons.
  • I can apply ratios to sports and statistics.
  • I can interpret ratio information from graphs and tables.
  • I can explain how ratios help solve real-world problems.

https://images.openai.com/static-rsc-4/fRGi6-axENjOQBpkk4uhbNV-PH071z-EaJm2b7dOMxoWCyjoFUXtBVCcNeqlPtx7z5_43gPbxsft4WyRpY2zIKuaGrr-Qj64vEcrYHxp17dAXrYZS1NfG41zfh6IjVO-rgVnKsgjrvUbOTDNmqrA25ziuX7AhiuDmmOUVoUyR6BvaJwUr5rnZSDjbt2UReNi?purpose=fullsize
 
https://images.openai.com/static-rsc-4/UOeAfG09XkCxUvsctijAgKPaJ1YCn9ktbGCNNDBYxBNH7LMXiFbT-VGrXnbkNPeLb1C9xR3sLH3yKQgcbg06bqjmOfmBc9MSQyASeN03Ed2nOfKAd-yq46mNcy9sRlwhDfnaUa7J6k5TXOUpRj45yG83bQb_moHqKLWTW80hWtzHBx0Zg40MjxJO4hrZknHx?purpose=fullsize
 
https://images.openai.com/static-rsc-4/f_grqSFQOTaf8opQxr4T37ihKY9ch2Ux3K1uyAyUIiP44G_RZY3m2taabFuHa3VayLhjYH3YQgXB9jpdQQr2B-xQ0clVaWY8IgT9xWAZX_MtcQEvVik2QsTMD-Pa5Mxik5BvM32RQB6xY4xYrzjyGeVVAJw2lvvb6Z4JHvFu3Ac38S1m5EUFBE5LTHAkOHyO?purpose=fullsize
 
4

Why Are Ratios Useful?

Ratios allow us to compare quantities and describe how they are related.

In real life, we rarely use ratios only to simplify numbers such as:

12 : 18 = 2 : 3

Instead, ratios help us answer practical questions such as:

  • How much of each ingredient should a recipe use?
  • How far apart are two places on a map?
  • How large should a scale model be?
  • How should substances be mixed?
  • How can athletes with different numbers of attempts be compared?
  • How can data from different-sized groups be compared?

Ratios are useful because they describe a relationship that can be scaled up or down.


Ratios in Recipes

Recipes are one of the most familiar applications of ratios.

Suppose a pancake recipe uses:

flour : milk = 2 : 3

This means that for every:

2 parts flour

we use:

3 parts milk

https://images.openai.com/static-rsc-4/kRnhHxbqJFhgBN53YQAIB0w47JQSizkyo5EU_wk6_CTJlh2jlBBGj0f1e-tefiUmVVW_kZbWNDL6AAYt6ufZTQpq-Ln7bx0KGy-suKJCYTeR_7EXEC9BFFCl5LDeeqxFu8hKNROwoTZO27lVH9nTTfHxx9cmddHR0gKc8cy7hOvUkEwhEMZ8aFMiMroB4qF4?purpose=fullsize
 
https://images.openai.com/static-rsc-4/pwswY4CAT6lg3OEICD1EMxhF4FwACysCG0t5wAUBOpfwfjTRXIJANI78qjlLZu_N4IAOPEICUEOByXxUe9ShODewb8JocIFyQye2LB6m-_pd4pygGLkgFstIIaGVTNq8D7xU1mTINz7wRfzPOA3XTRVQZD6LN-ptDB7LOzB888sQlXRqSLIGdjViUagPU6bp?purpose=fullsize
 
https://images.openai.com/static-rsc-4/tGylaRg4-tvHpSjBMux4v4CBfmNE0Mf40mxfYmTa5qNKxzgiSnF1G9frhGEyXOrFDs9oR9abz-PcHp1G5_42Il2B5Cx6UczsKfHMgo9P_05oV9SQzKdc97CV7AuSX8znwjOYR75aXkg_mS-_V0f3AaKaucxpTjtec3xxCDtk1HgG0tfobtH7EWr0OEBN-ztB?purpose=fullsize
 
4

The size of each "part" can change.

For example:

2 cups flour : 3 cups milk

4 cups flour : 6 cups milk

6 cups flour : 9 cups milk

All represent the same ratio:

2 : 3


Scaling a Recipe Up

Suppose a recipe for 4 people requires:

rice : vegetables = 3 : 2

If we double the recipe for 8 people, multiply both quantities by 2:

3 × 2 : 2 × 2

= 6 : 4

The relationship remains:

3 : 2

Scaling a recipe works because all ingredients are changed by the same scale factor.


Scaling a Recipe Down

Suppose a recipe uses:

600 g flour

300 g sugar

The ratio is:

600 : 300

Simplify:

2 : 1

If we want to make half as much:

300 g flour

150 g sugar

The ratio remains:

300 : 150 = 2 : 1

The quantities changed, but the proportions did not.


Finding a Missing Ingredient

A drink recipe uses:

juice : water = 2 : 5

If we use 8 cups of juice, how much water is needed?

Start:

2 : 5

The juice increased from:

2 → 8

Scale factor:

×4

Therefore:

5 × 4 = 20

Answer:

20 cups of water

https://images.openai.com/static-rsc-4/iZQcTPcUnauj03LGvN7fjxZpSHuP6Uxe6PdBT8nnuMMWL4aChUzoSGZ1_ARBY30u0G6yXgdvSc_5xoY5X24JLh9uMWq13fAAKsuwe-8rZ1E_Ea6bkRoaFV7MgiXKDgi_T8y-ef1xp8bq1DEk18d7cb_Z4x6a58RGHKwbTECIu0NSetKjddJLXf-EmBjE5Ex5?purpose=fullsize
 
https://images.openai.com/static-rsc-4/9MFKxmX7dlJS8Uz3z-0PxT3IcCT_bwQ6mJmIVGvQsO7yz24SaV0Qci_SNm6m8iagBbUaMCv1gm5CaA2sTPeri65aDgaEJEkLpGHst9R0s4lGw53jWErYIp34fkQ4qlTupeyzjEXXp0BGeelRHEVuBMOV2FK-I0FXh_1RrCJFBh5f_V0fIFgvx7GGD2JHf2uC?purpose=fullsize
 
https://images.openai.com/static-rsc-4/5kFLusCxr5Mf6aeNDDkGJLnKjUUyNB4wWWuZsYLhVDrde9msaSYXWmeEc7jNgZypitY0MjZnZXLgAK9-yVChYa8a3_I2BZEoOPEiajLkkSmkEhQ4FBCRbeL-cRRTCH0c_HR53VbaWUxcIlJyOwr6h0-SZtVXc_MScOTPTLfB9AUk312bVEyuqDMqR0WsFl_4?purpose=fullsize
 
6

Ratios and Total Amounts

Suppose fruit punch contains:

juice : water = 3 : 7

You want to make:

20 L

of punch.

Total ratio parts:

3 + 7 = 10

One part:

20 ÷ 10 = 2 L

Juice:

3 × 2 = 6 L

Water:

7 × 2 = 14 L

Check:

6 + 14 = 20 L

Therefore:

6 L juice and 14 L water


Ratios in Mixtures

Ratios are widely used when substances need to be combined in particular proportions.

Examples include:

  • drinks
  • paint
  • concrete
  • cleaning solutions
  • fertilizers
  • fuels
  • laboratory solutions
  • alloys
https://images.openai.com/static-rsc-4/yHq-y0if3Z0uSYdFcNuB0Gwex4MJtk39qziaxkU33UExFqkIFr4Q3qUycH66DgUULO_svRz7D3WEb5QHsoB1PTq2nyZO5zEUbF83ggjWbqo6DAh8JfiLcgJqYF85oMH-A7G0thhyxxR201zHBWs9_LfCx0CFKk9M_Mw2YOotxRCM9GYouBaWn8415Sw8D7rO?purpose=fullsize
 
https://images.openai.com/static-rsc-4/9MFKxmX7dlJS8Uz3z-0PxT3IcCT_bwQ6mJmIVGvQsO7yz24SaV0Qci_SNm6m8iagBbUaMCv1gm5CaA2sTPeri65aDgaEJEkLpGHst9R0s4lGw53jWErYIp34fkQ4qlTupeyzjEXXp0BGeelRHEVuBMOV2FK-I0FXh_1RrCJFBh5f_V0fIFgvx7GGD2JHf2uC?purpose=fullsize
 
https://images.openai.com/static-rsc-4/gyp9faeumeem1vxjqayvamOpn4qm_v5hkLIpLHSK0C17l_BC-KZpft18QHxXkhR8BSdK85FK0IQOyAibRdsPIhrRfqEUCGVnmF0pIIxS6pqqZRX-fdbd0YJlScc5SrugaZb94msDm4eCmTSI6CdfIPmnOG9uAm9VcB_YD-_gGJ-4MR0jRCKov8Flsy8S3ngf?purpose=fullsize
 
6

A mixture ratio tells us how much of each component should be used relative to the others.


Mixing Paint

Suppose a paint color requires:

blue : yellow = 3 : 2

If we use:

12 cups of blue paint

then:

3 → 12

Scale factor:

×4

Yellow paint:

2 × 4 = 8 cups

Therefore:

12 cups blue : 8 cups yellow

The ratio simplifies back to:

3 : 2


Three-Part Mixtures

Ratios can contain more than two quantities.

Suppose a mixture uses:

A : B : C = 2 : 3 : 5

If we need:

50 L

altogether, first find the total number of parts:

2 + 3 + 5 = 10 parts

One part:

50 ÷ 10 = 5 L

Therefore:

A:

2 × 5 = 10 L

B:

3 × 5 = 15 L

C:

5 × 5 = 25 L

Check:

10 + 15 + 25 = 50 L


Concentration and Ratios

Ratios can describe how concentrated a mixture is.

Consider:

Mixture A:

concentrate : water = 1 : 4

Mixture B:

concentrate : water = 1 : 8

Mixture A contains more concentrate relative to the amount of water.

https://images.openai.com/static-rsc-4/Lc4-mP46nX10hK0Ia0sD6UVeb5LhKts3S8wLkW4MCAe4D8uVAtdXLjJ5lSly26Na1lmR8fD4n8AJTmwaChuiX2IZgAWA09Cq1kB9vbH4vAcbyVlewsuU2u7hT1q3vAwoZUE-LcwbqdcVbAEqC-StC28juwJmntcmTJfyk8dUwp25Z3drfFYHnu383lIZAg6f?purpose=fullsize
 
https://images.openai.com/static-rsc-4/enNmd3qF-JYmd7MUzOqekDkzIWmNKolYcgCsJNCFFoXo3eeOcEJtp5QpIjO1vug8MKVQfN_tL8gqMHZD_9utZtRqJnxug3XN_u_3RRocu6dbSGQlx8Q-HtNGqFxQYSvMRtEM4VHWmY57w2M4LHJP_SuCz1MMh5fchM5FpjkyFkFxN3jOD7fvdcE5QyFVDELf?purpose=fullsize
 
https://images.openai.com/static-rsc-4/2wlB-Vmz-ptSkL4qwVixMdYwaUbDkbTsL7b9Il8RaU6xg_xqodHyQerB0cghicZZZj1ITW4pYfmnjHrCTMYz2UuRL7MhBXD5O2pQ8no6TQuuFJfe9rbGBNIuNp7MjXyj8xoyEqQOOAp8O_f_FEONp6YGgxl8JD5j8LmxwnYp6x79LwnoZlPRpngLhL_urDcr?purpose=fullsize
 

This illustrates an important point:

Ratios help us compare relative amounts, not simply total quantities.


Ratios on Maps

Maps represent very large real-world distances on much smaller surfaces.

A map scale describes the relationship between:

distance on the map : actual distance

For example:

1 cm : 5 km

means:

1 cm on the map represents 5 km in reality.

https://images.openai.com/static-rsc-4/yuViLJa26KeZKWrtwLf9N25rDR0KyjM5ZmrYAUa5eLuTugyh-OWuxqhWTFFXsd1BDC3ZlJXMxcsajaG1dMP-kPdUAncs6aH4T3nNAeABywkKs4UbGMork_2veaTpZs38fnq8wKuZuzL8FmBvy2_7O7tBmuB-aL_Pq4FG6-ccH9FwkjAs37B1vzjiRAfCLrFO?purpose=fullsize
 
https://images.openai.com/static-rsc-4/4LnjKy_Ult2ub6tYmBxlCLTHbjiAhHvwibJ_3eAtcbYOliMGg6L7BzMALWDpHjL1kAcwYqxTxxRcg2hrzUihVC5R3gGf5CfqsQmdg1TWh0LwucaTW6JF7MVuuH3YgV14AVVqbdN-XnJdXLNiPlytd4ma0SBF50H7ATghHnDvY_IKXi04rbynXqjh3TFSm-Om?purpose=fullsize
 
https://images.openai.com/static-rsc-4/f_grqSFQOTaf8opQxr4T37ihKY9ch2Ux3K1uyAyUIiP44G_RZY3m2taabFuHa3VayLhjYH3YQgXB9jpdQQr2B-xQ0clVaWY8IgT9xWAZX_MtcQEvVik2QsTMD-Pa5Mxik5BvM32RQB6xY4xYrzjyGeVVAJw2lvvb6Z4JHvFu3Ac38S1m5EUFBE5LTHAkOHyO?purpose=fullsize
 
4

Calculating Actual Distance from a Map

Suppose a map uses:

1 cm : 8 km

Two towns are:

6 cm

apart on the map.

Calculate:

6 × 8 = 48 km

Therefore:

actual distance = 48 km


Calculating Map Distance

Suppose:

1 cm : 10 km

Two locations are actually:

75 km

apart.

Calculate:

75 ÷ 10 = 7.5 cm

Therefore, their distance on the map should be:

7.5 cm


Ratio Scales

Maps sometimes use scales such as:

1 : 100,000

This means:

1 unit on the map represents 100,000 of the same units in reality.

For example:

1 cm : 100,000 cm

Since:

100,000 cm = 1 km

the scale can also be interpreted as:

1 cm : 1 km

Units are extremely important when working with map scales.


Another Map Scale Example

Suppose a map uses:

1 : 50,000

A road measures:

8 cm

on the map.

Actual distance:

8 × 50,000 = 400,000 cm

Convert:

400,000 cm = 4,000 m = 4 km

Therefore:

actual distance = 4 km


Scale Drawings

A scale drawing represents an object using dimensions that are proportional to the real object.

Scale drawings are used in:

  • architecture
  • engineering
  • construction
  • product design
  • maps
  • floor plans
  • technical drawings
https://images.openai.com/static-rsc-4/tcEEFV_Rfg1wqFs3ZXLR_OcPJdQ9vgH6sBEkdLCwAk6hCzvQr30_ErpJYkVPfZvdJkLhDFl-6nL7KLCgqZV5VVQTnCsrdYExc8RM9JEx3-c09r9CBMKUVmfKuHSYsUfrDAjFUJPsGM1gYHqIfavWadTRqDl7BKt-DHZGutv2H6lEjkdHXr6NsN8sbw49FdnK?purpose=fullsize
 
https://images.openai.com/static-rsc-4/R-fhznpdRoT6uDo5_8Jf6ArCronXHBmc2tvqN_gPO0kCT54rzOzvbCHRAnq1ISw2iG1-cp5hZo8MTrJNj65kk-wjulXVWGYY0aW0FZ8MjzcY3qRnPLADinzwW8bgM6naeDxEfgUnL-5fs7p_3ws4SMuQbXaa7Q1saOYREkkQCKGudWnkz-AHZ5AHiunPgvL2?purpose=fullsize
 
https://images.openai.com/static-rsc-4/bd8dzCzeoOyJ_RHRJfWFjjzFz97at2z6hdBpbAJgc-p9BdDgWM-fQwYQp0q_4gk3pZoOmfh9cKcAr05RICuv-jj6J-CVXJTg-9OtMjkepkWAHxv6M2xm1iUGiWeWeI48kTQ3yEIF3UQk5VgY5piOazm7WI5CNeKb5mgysS0BtEcfPcGTRtn0Fu8q5-WXmBK-?purpose=fullsize
 
5

For example:

1 cm : 2 m

means every 1 cm on the drawing represents 2 m in reality.


Floor Plan Example

A floor plan uses:

1 cm : 2 m

A room measures:

4 cm × 3 cm

on the plan.

Actual length:

4 × 2 = 8 m

Actual width:

3 × 2 = 6 m

Therefore, the real room measures:

8 m × 6 m


Scale Models

Models also use ratios.

Suppose a model car has a scale of:

1 : 20

This means:

1 unit on the model represents 20 of the same units on the real car.

https://images.openai.com/static-rsc-4/w3LrbY9BxPcc5Smq4XbGh-gwLk_PbwG8OM1L-9DtFn3P5pPKDOXTdFiFmm5Ex247FanEG-bwi-Q0YToCHCaDHb3OI_dGPeZXBLoltEGJRGA3bVlMzQOrgApa7Sf3YrDPgDQCTa3FvoURcHx2CxbA2oknpYu7Fw3r2PAgVPTwzKUGmMeMA1Pk7CCGzvZKsFX2?purpose=fullsize
 
https://images.openai.com/static-rsc-4/MTwFz5k7TyWcueXXPbGh47p9fx-QiJ8xIMW7Tl9BBQJPXYARLM7mFyRpz0Y9WC0jSDqRtulmEfUwq6Z1xZrpRnC8Wpt_0Ruxdu-yZtY2GR-CEBsv_i6IILbORyj_60CWdJIZGUoHiBdJix8Kkg0kozufqE_5u6KM5_VwwmHq-KNQdle-N3CG0YxRQp0agC1o?purpose=fullsize
 
https://images.openai.com/static-rsc-4/vP5_e1B72Zt7p12xzwGJe2HTxMsFcex3dhuHyEvg-baadUEskM3y3YM3a8SBDlZpYHbRXtP4SS33jsjOzp5FbAq9qyr_KyqLgIpYSI_7h22QWivSYNKsRvmLuorA9KX33G8wbhCP2SUJLCXZ_EjrC69sNSXY9n53TyHXf9pKG1UdKO9PeSJmekrpUNL7zwjf?purpose=fullsize
 

If the model is:

22 cm long

then the actual car would be:

22 × 20 = 440 cm

Convert:

440 cm = 4.4 m


Finding the Size of a Model

A real aircraft is:

36 m long

A model is built at:

1 : 100

Convert:

36 m = 3600 cm

Model length:

3600 ÷ 100 = 36 cm

Therefore:

model length = 36 cm


Scale Factors

The number used to enlarge or reduce quantities proportionally is called the scale factor.

Suppose:

Small drawing length = 5 cm

Actual length = 20 cm

Scale factor:

20 ÷ 5 = 4

Therefore, every measurement on the drawing must be multiplied by:

4

to find the corresponding actual measurement.


Scale Factors and Similar Shapes

Scale factors are also important in geometry.

Suppose a small rectangle measures:

3 cm × 5 cm

A larger similar rectangle uses a scale factor of:

4

New dimensions:

3 × 4 = 12 cm

5 × 4 = 20 cm

https://images.openai.com/static-rsc-4/CP5KhSdxmE5z87GbCFKKERZLpGyZGJerLjb_RH-3AMw24EHi7aaRNtvlpOaesSnMgPdwohCkvywymLT7yKAG5j6UHGm65_dB3yopnWae_G8RDLDd5gFMMbb0mmG9hTRvRIyfcp5lBkXU6jIJl8aSe3aABserA-sSQJ2mAE0Q6SrlTHZ-eNc4AxVg6Fbp3F8U?purpose=fullsize
 
https://images.openai.com/static-rsc-4/0-e7k6k8fMd9ccSS4F6_GbJIrvMMaQAUwyGiz69PbdYvpVa9YR-hP3_jIKfz0F5QB_8YSQFGToD4O_B_YXZoGbC8lAaJM1RnOxqdUR-Yehnkf4Zus0u6vWDh1R9Ei9rYV49GM2vboPO4y6D3xu8Bok41cpcf99dAFcUGuKHYTE4otmgVpnEvQQw3MLrhRv6T?purpose=fullsize
 
https://images.openai.com/static-rsc-4/vmZK3IYNed-_xUHK4B17y017xrUoaH6YDDJF8PxW6PWuMefFIIm3X4O747I6FI3R_Yb4Vk2Ix6C1EJE0pRVweMbItsGo-TUzpvpIkdBEknpmZODLQbSHj9-drPfJuVEY9cwqbRpVac9GA7j7nTOj94LG6DyayeMOsuDuCiQco42LIMuneAMKvRQ8DUsn-9QW?purpose=fullsize
 

All corresponding lengths are multiplied by the same factor.


Comparing Quantities Using Ratios

Ratios allow us to compare groups even when the groups have different sizes.

Suppose:

Class A has:

12 laptops for 24 students.

Class B has:

15 laptops for 25 students.

Class A:

12 : 24 = 1 : 2

This means:

0.5 laptops per student

Class B:

15 : 25 = 3 : 5

This means:

0.6 laptops per student

Converting to a common form makes the comparison easier.


Ratios in Shopping

Suppose two packages contain:

Package A:

6 bottles for $12

Package B:

10 bottles for $18

Calculate the cost per bottle.

Package A:

$12 ÷ 6 = $2.00 per bottle

Package B:

$18 ÷ 10 = $1.80 per bottle

https://images.openai.com/static-rsc-4/3Mn8LEVub6ZHQpF8eqkVco8oqrxD4n-8c6IpVhjbqQTWCCotcgNTWs3B2CAi9gQmFeB_T0BvzmEzH7yqG6RTeXFrCul8i2D9WMbrxRrYCW0CDvFqZnTpF53lfvdXPeIAYHnB7Ktdj7JqhUcBSihgFa15T9zTm-L0HunS1azYyB-mdUrXj-g8GgLfIDBK7RPo?purpose=fullsize
 
https://images.openai.com/static-rsc-4/d8mVPEnuiIL1ZQ1OLy4L2A7i8LFnblLnR27XBcHJx-T2MraRAlH8CMEx3qIFHISDRsoTXN9xSoFKbJLz6J8O91nMX6J3flnsNH-m7143qWPPsBDYM8NMcChmg7EcU22Ofkv0G7zKZ_P75F6NnELsmwo4oa6JNRTel12YlfNxUtoEx1-9zJDPQoViRXVqb21p?purpose=fullsize
 
https://images.openai.com/static-rsc-4/1dn-9lNOjHlHBFTErsv8C_fl_-amV5knw8ViHRHHAAV67o0aJEv6XqtPAd7dlGM_qtflGTjAntamimQkAA2gyxqDTx8BVu2SSjoBt2NkeCoM5x1Cuf2zgfNPpFf3j59A09Ul-NSUp-U6gFgo_JvakXdRfWFC7-w4Uw8TCB2WGdBStBhiiFQ5x54CZuN1Syyi?purpose=fullsize
 
6

Rates and ratios help us compare packages of different sizes.


Ratios in Sports

Sports statistics frequently involve ratios and rates.

Examples include:

  • successful shots : attempts
  • wins : losses
  • goals : games
  • assists : games
  • hits : attempts
  • points : minutes played

Ratios allow performance to be compared even when athletes have participated different amounts.


Successful Shots

Player A makes:

18 shots from 30 attempts

Success ratio:

18 : 30

Simplify:

3 : 5

Success fraction:

18/30 = 0.60

Success percentage:

60%

Player B makes:

24 shots from 40 attempts

Ratio:

24 : 40 = 3 : 5

Percentage:

60%

https://images.openai.com/static-rsc-4/4zIer4l1jbEvYWL_E217hdwE1ozRNIAnEisUqJIHVujyjhBoVgE5P5zdrKdc4YanlAR9c0D2mc7sHOUrYAgW2dlhLO0Yhm7bVnDaP930cXvO2Ts1zBJgiMFi3RB1X-PvouM71rSR0OXXjvJFiltSOFuNm107sLEv_SaE35jqG4B-ahPwpx5zECn4CNjU6v5s?purpose=fullsize
 
https://images.openai.com/static-rsc-4/IugLkMXp2BQLy7-3YYYb_f0ZGjNlQszS9Bq0SFd2pO28kgrgAses3DJIENYMfo5gN9LwtT7-iz3X3SKtz-C5l4wb5-_o2bTJ7i4uL78qEgXJNSQFknk_x1XKTCr3Nu-pYDjHL4fWa2b1ldFyvLYEsIhi-HqZNI_-9KF7Fok6R-z3UWTRudLhEba7jSiVfXbW?purpose=fullsize
 
https://images.openai.com/static-rsc-4/MCjyDfVNbRE3FFYo0-vzc3oUQsjpoYIV9aaZV1pG91q97cAVFnHbEMYgAqHd9XzRWhbU2BYepIv6WVF0Izmh33PbADSDkGTWLOL51YIuH5KI8WQSB5P8KjFDNQcdW8VhxF56tO3GAariNJo-zNEBP7MyWJmA8rtLcPVWCJOKdUtbM2fpZN2aNsB8jHsEfYey?purpose=fullsize
 
4

Although the players made different numbers of shots, their success rates are equivalent.


Comparing Athletes Fairly

Suppose:

Player A:

15 goals in 20 games

Player B:

18 goals in 30 games

Looking only at total goals gives incomplete information.

Calculate goals per game.

Player A:

15 ÷ 20 = 0.75 goals/game

Player B:

18 ÷ 30 = 0.60 goals/game

The ratio provides another way of comparing performance relative to opportunities.

Context still matters: opponents, playing time, role, and other factors may also be relevant.


Win-Loss Ratios

Suppose a team has:

18 wins and 12 losses

Win-to-loss ratio:

18 : 12

Simplify:

3 : 2

This means that proportionally, the team recorded:

3 wins for every 2 losses

However, this does not mean the team literally followed a repeating pattern of three wins and two losses.

A ratio describes the overall relationship.


Ratios and Statistics

Ratios are widely used to summarize data.

Suppose a survey contains:

120 people who chose A

80 people who chose B

The ratio:

A : B = 120 : 80

Simplify:

3 : 2

This means that for every 3 responses for A, there were proportionally 2 responses for B.


Converting Statistical Ratios to Fractions

Suppose:

A : B = 3 : 2

Total parts:

3 + 2 = 5

Fraction choosing A:

3/5

Fraction choosing B:

2/5

Convert to percentages:

3/5 = 60%

2/5 = 40%

Ratios, fractions, decimals, and percentages can often describe the same data in different ways.


Ratios in Tables

Tables are useful for displaying proportional data.

Suppose a factory produces 40 components every 2 hours.

Time 红心 Components
2 40
4 80
6 120
8 160
10 200

The ratio remains:

40 components : 2 hours

Simplify to the unit rate:

20 components : 1 hour

or:

20 components/hour

https://images.openai.com/static-rsc-4/iIiNuooe1WHpiqub-eLY5Xs98hEGy9jn3XL5iv55dPdURmHGZPz-nZd3j39bWsHyAmp805azplk1Sk55xijez6x0yx3Wki1BhLFyW1Ota-sLdIpePakzZHn-A6Xr3oJ3bqjCFW8Z_RgFvqhORcT22UUDleGjMH2PMsZpXHmJHKasRDoVCqNOMxr6DRDWBMXi?purpose=fullsize
 
https://images.openai.com/static-rsc-4/uieEzgDvrZCiDeT0DtsYCC8W24bsgdVWNZxepG2eWGcZ_9A4ubkYk4AFAVCsxQxdDzuMbT44XC-MPP6t6kO4bVxttTwHI28jF-QA9QCdCb0kZyw1EHzuEzqWcjV2_TInujU7tLBnpSH2tFRjVg7G93rNzrFUJn8_q8bd4ZMbPQgv2E6qkslOOcZaL5L3Ixk4?purpose=fullsize
 
https://images.openai.com/static-rsc-4/Kzydw08yjvQQPM_NjCOcbeIRmJ9TfWvMQY8UdfhUNsuDR6oQ5NuFDFb-Wt2OTbtmYy7DF6ykoXBi09-tY_cipf7pLrmSwUI2j916g1H1vMgTcc8H6x2SeNgSQ6A606qpnrfWyuZCN-C5I5652RzpVQc6VBnpQdNwW7wp1A978klPT7TASvyhH_GRbeynS1QW?purpose=fullsize
 
5

Reading Ratio Information from a Table

Consider:

Distance (km) Time 红心
60 1
120 2
180 3
240 4

Calculate:

distance/time

For each row:

60/1 = 60

120/2 = 60

180/3 = 60

240/4 = 60

The ratio is constant.

Therefore, the table represents a proportional relationship with an average rate of:

60 km/h


Spotting a Non-Proportional Table

Consider:

Items Cost
1 $6
2 $10
3 $14
4 $18

Check:

6/1 = 6

10/2 = 5

14/3 ≈ 4.67

18/4 = 4.5

The ratios are not equal.

Therefore, the relationship is not proportional.

The table may follow another pattern, but it does not maintain a constant ratio.


Ratios in Bar Graphs

Graphs can also communicate ratios.

Consider this illustrative survey of preferred after-school activities:

Illustrative activity preferences
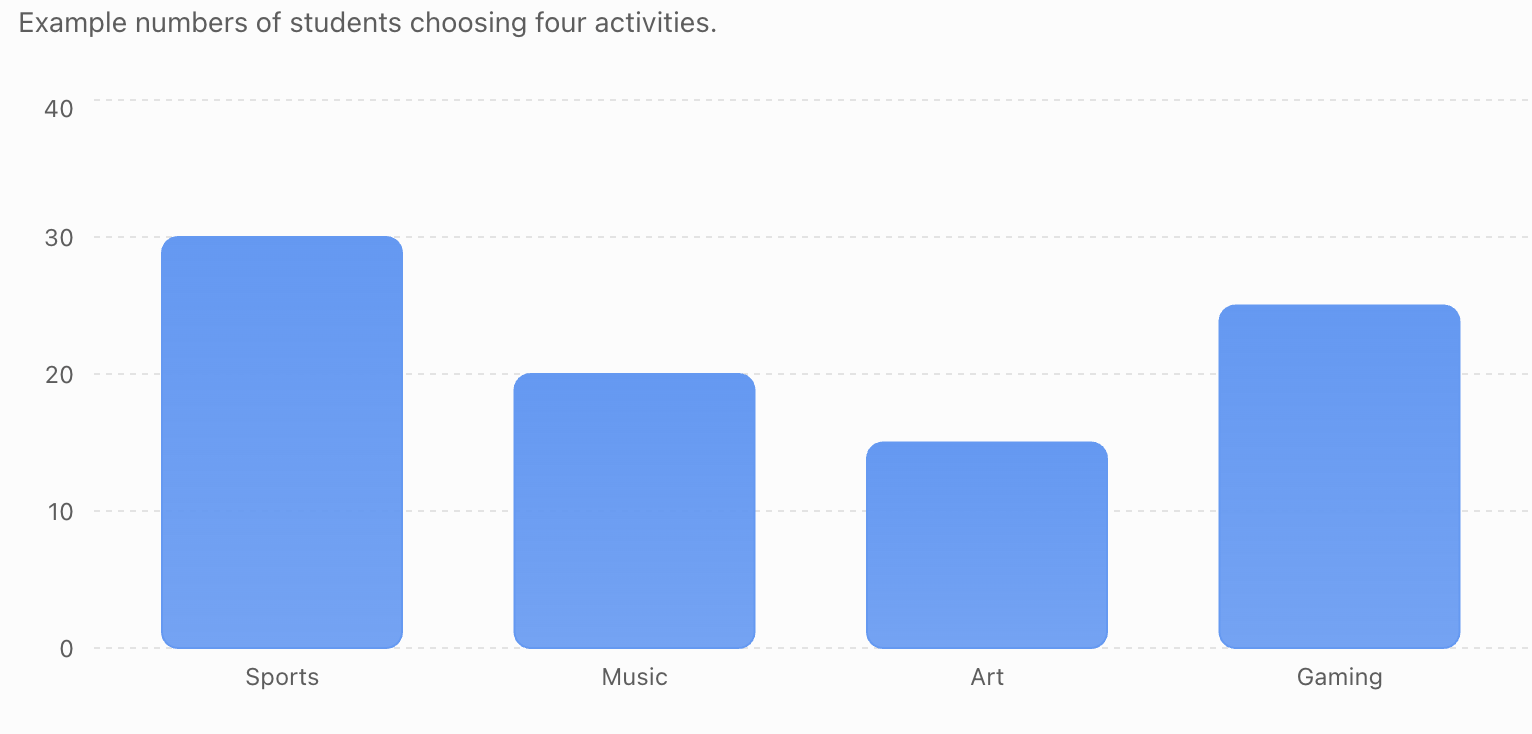
From the graph:

Sports : Music

30 : 20

Simplify:

3 : 2

Gaming : Art

25 : 15

Simplify:

5 : 3

Graphs provide the quantities, while ratio reasoning allows us to compare them.


Interpreting Ratios from Graphs

When using a graph:

1. Identify the quantities being compared.

2. Read their values carefully.

3. Write the ratio in the requested order.

4. Simplify if appropriate.

5. Explain what the ratio means in context.

For example:

If a graph shows:

40 students prefer A

and:

24 students prefer B

then:

A : B = 40 : 24

Simplify:

5 : 3

Meaning:

For every 5 students preferring A, there are proportionally 3 preferring B.


Ratios in Pie Charts

A pie chart represents parts of a whole.

Suppose a survey gives:

Walking = 40%

Bus = 30%

Car = 20%

Cycling = 10%

The ratio:

Walking : Bus = 40 : 30

Simplify:

4 : 3

The ratio:

Car : Cycling = 20 : 10

Simplify:

2 : 1

Percentages can therefore be converted into ratios for comparison.


Ratios and Population Data

Suppose a region has:

60,000 adults

and:

20,000 children

The ratio:

adults : children = 60,000 : 20,000

Divide by 20,000:

3 : 1

This communicates the relative sizes of the two groups without needing to repeat the large numbers.


Ratios in Science

Ratios are extremely important in science.

Examples include:

  • mass : volume
  • distance : time
  • force : area
  • reactants in chemical equations
  • genetic ratios
  • scale models
  • concentrations
  • energy input : useful output
https://images.openai.com/static-rsc-4/kiHs3Fw_NRkqTJbjIt7oYVvvUOd_Y_wZkjpF8GuaUxC7YdDmDg13rU6MnsPnTdcveydzQNJgaHlHUciGlJjN-GOgm0bGftBmRgHVdyR0AhIDqf1U8uEOqVAGVEN9wI15_ZlLwGGSH5byMEMvMessWHG1pUSPXgfhL4wXThpSOKxZV4SgIXDeEopNsdoDb9Et?purpose=fullsize
 
https://images.openai.com/static-rsc-4/B9kJ2H_geitEFS5V9BEui4EqrELJ-Ijjr8QhzuWzj45lxxDDih7JF0GpTKf4vsR2-NjCE02Skrltiwnhh4bBpygPT-J00NCyBhm3IVSJBLPW-l6RwJPkjs5uZa221W4MUDPbUBrGOoMyWLjAqa_K1P1tK5cfPNOcegoS5Gx3aIsbOM0SgdnvN6uzzOuC3Ney?purpose=fullsize
 
https://images.openai.com/static-rsc-4/6FLrKqJWyruAO-JDXhYu4Tle_yR0CA3KFKXnkjhFCoOdcYVDP4c-TS8Gu2xTyrON7PAsXBM1FjKqiof6IsZntb4a8sjWwMkZwm7AVnrfz4L5wcgA3fY8hCP9Aue4twINPtp2lZXmELR_I2Izq_iWxMsyHiqjq7WuFjld86JsUCeA3VTk26r27qT076Hc6_C7?purpose=fullsize
 
5

For example:

A material with:

mass = 200 g

and:

volume = 50 cm³

has:

mass : volume = 200 : 50

Simplify:

4 : 1

Its density is:

4 g/cm³


Ratios in Chemistry

Chemical equations contain ratios between reacting particles.

For example:

2H₂ + O₂ → 2H₂O

The particle ratio is:

H₂ : O₂ : H₂O = 2 : 1 : 2

This means the balanced equation represents:

2 hydrogen molecules reacting with 1 oxygen molecule to produce 2 water molecules.

https://images.openai.com/static-rsc-4/7fRPQ1LIvr_kD7-lkr-nApcLHFf1mmIDhtuqXXfi804iEWdDFEUSeCChJlOVERGQ7hs0mEMUlPoBJlItFTsEaiyYes1AR3O9-xwRuUjRkedekirfa0y-BnpYzYvgMszK_CC05CS-iPalNZvkQGzlsJhCO_7t1QC9dW5t1lzCHdWJ_6hEgPtbRdPCWJhDTLVk?purpose=fullsize
 
https://images.openai.com/static-rsc-4/vH4fmiD3ABsznACSXUpchVtR665hwSW2jqeQwIsdCnS4QREQ5CD-ogdSghMkuyG0ktlFMBVXxpHMAG3GgKLyELifb-09udk_1JZDY-uUdrG3feBLhDkGbwmxV2wslS-bVw0SqRC3QOP38xT9VN9a6-98_aomzySTdJJfR9DEaDO4YSdQ8y40T-JfVNCQnrT5?purpose=fullsize
 
https://images.openai.com/static-rsc-4/ciqMFqK7aDbJHRYtSvRkFxKsscv-rdW5aJAlk_kSAm2IVeYEarK_vwzrst3-tkBplCg7EL5szsX0t7h4HraLu4hhS1HcYhEYl6iWvj3FzFLnyMM9vfk93cloUF3YyZ31xGfRtchi6pvp4aqHu8sWxMA4DDbu_IN-SgOJlZctjMcMYYA2ijXfjc2CwUShT8dI?purpose=fullsize
 
4

Ratios become especially important later when studying stoichiometry.


Ratios in Biology

Genetics frequently involves ratios.

For example, a simple genetic model might predict a phenotype ratio of:

3 : 1

This means that over many expected outcomes, approximately three parts may show one phenotype for every one part showing another, under the assumptions of that model.

It does not guarantee that every group of four offspring will contain exactly three of one type and one of another.


Ratios in Engineering

Engineers use ratios when designing:

  • buildings
  • bridges
  • machines
  • gears
  • models
  • technical drawings
  • structures

A gear system might contain:

Gear A = 20 teeth

Gear B = 60 teeth

Ratio:

20 : 60

Simplify:

1 : 3

https://images.openai.com/static-rsc-4/FV9CJaekYXo2N0LYOjCVQXJLa5wkmxv0LXSdShcVz5EKJe2OMMiWqHqsbfU8gJokra_rwiL1syvYf68aJCXCyzNFDKrJ1hbZ2zti0934-feDqFR9mwDxrN2jbWGhxhXyfCcrMsLBGsr_2o079H40zxlAG-4_XRc3Csl5oD3YZwgEbFMbp90PYy9v0SwEdvUQ?purpose=fullsize
 
https://images.openai.com/static-rsc-4/LDl8w2c1RdAk8B-_FDPIJVVHHYCgiyEDTVuCfacrzoi4kjW3B1BfehrM6attOgQxwknFTZsnnb3gG_V9Ad_AKZAZVne4otqAZjPxL1d7evswXMl2ji5z4887y6R1Bg49kiIUNGaVwnZ5QEcqwSpge6cbJPd_vvSsr_dKEtPfN5lNZKiopQjzBlVcgYwDX8eD?purpose=fullsize
 
https://images.openai.com/static-rsc-4/W-OZ1HUgCmkpRPTu38kxH1AnJy4cSL0MGCvf5oaf8uNqJDBp-rwSh3jvLOwuR71FHy2RRHuSAdkZfa1T2iTBr2M5pPKbhIyAVsxK-E6Cc_ewbD6vC8Ui9dRuUBuXy-CVm1QQM5nZT3QIEHJiCJk7ccnQh_LcF7PWiquohqKKvSi6RxsBYhep06Ycn2-GkM62?purpose=fullsize
 
5

Gear ratios help engineers analyze how rotational speed and torque change between connected gears.


Ratios in Photography and Screens

Screen dimensions are often described using aspect ratios.

Common examples include:

16 : 9

and:

4 : 3

A 16 : 9 screen means that for every:

16 units of width

there are:

9 units of height

https://images.openai.com/static-rsc-4/sPR3PJZ14j_z8jHPXOrB7ggHvqMNZXoo0Uz-lrRz0Yv0hZJzvvh98x92IXkt7DboSQ7ZNDOdzE9lWnOI1U8YrCel5Zw5X_E4_DFtuZSbmpR68sQlBKfQhhuDc4JM2rhtWWuuUNMJ-QidNlqF45967kTHIChh3Oh9IdhfG9qSsIGSURQvH6SJ6lidGkbYf89G?purpose=fullsize
 
https://images.openai.com/static-rsc-4/GxjuhTRZjEIZuA6UVauFu8nQ5_1PQSkP_T4d6p4y4LjWRpAyNThz7ofyRDFI5jynBR9aoEiyfB2guYKYsexzeSOtG-buaec9KqHxZZV6N74uQaFB-5Os0N-aogQII5whxI2QSvzLgqPUoAKnSOIgyQP5zTgyuh7gTR5XSSsLrL2grDbliR3wo65UCs4d9ROG?purpose=fullsize
 
https://images.openai.com/static-rsc-4/SLg8i9nVCn34cYuOTOTVBcSrJwejIFdKjUFnhG6ui5tdDwNf4hSGkRW7LATtIRNeErRI1X7mSxSI5zkPP-FfGHnh9IzkgFWpDcI8NDGNXTEd_s9DlcNr9qesPgJfkh6SMTCNcSF-iJJf0-8aREhr0JN4i8HVMQyV7Yo2Ra360pt1S4fl_AkgmZxJQeXatcpO?purpose=fullsize
 

The actual screen could be small or large. The ratio describes its shape.


Ratios in Construction

Suppose concrete is mixed using:

cement : sand : aggregate = 1 : 2 : 4

If one ratio part represents:

5 kg

then:

Cement:

1 × 5 = 5 kg

Sand:

2 × 5 = 10 kg

Aggregate:

4 × 5 = 20 kg

Total:

35 kg

The ratio ensures that the components maintain the intended proportions.


Ratios in Probability

Suppose a bag contains:

6 red counters

and:

4 blue counters

Ratio:

red : blue = 6 : 4 = 3 : 2

Total counters:

10

Probability of red:

6/10 = 3/5

Probability of blue:

4/10 = 2/5

Remember:

3 : 2

compares red with blue.

But:

3/5

compares red with the total.


Ratio vs Actual Quantity

Suppose two classrooms both have:

boys : girls = 2 : 3

Class A could contain:

10 boys and 15 girls.

Class B could contain:

20 boys and 30 girls.

https://images.openai.com/static-rsc-4/h3ERB6D41Kjc6rhsAqz0jHTgLH6HkitqL0WIklZq5PfmWHEPALXurrk3X2UmQzDPD63wZjwPFa4DuydNNeccqiQooYIIwGaRV9xHFNCD-cGke8BewVvqynWIp5kO6jNbQJWsBIjKbCaZL1ge-1dMW4M9tEBS1b_vzL-9yeJLMgQg9F3dj--BQGWVBsVUZ8nU?purpose=fullsize
 
https://images.openai.com/static-rsc-4/N0HnS_kEI1r-E1OYkY8sPlghgQf7ppijeyzswLtosflvBWHIcvkBugmcbolfbN5EOwsUs8uI7LfxSjM40BzrB7K1gnio7nmfyFcFmfms6ERrGqF9iDo8w1ZnroXRx8D-C_2d1gV3_F734D6nItCY5ruML9XkWTqWSeiLPVqQWfjKDFkmJmZpSWzCmXnr2D3R?purpose=fullsize
 
https://images.openai.com/static-rsc-4/SCUm4tQa7-l6uo3WCDPJR5PnGswF1Ad2F7V7-N7IfN1cqJ-diRyFNzlPLmpEYXPzniKmw-hQpX_YD7oZ52mzYFgqm46hKdAVABHMnZzmrWLg2K2DGxJ6guRu7RBZRqpOjH2IYdFvDMYDSkaUC_6xihqc_Yi8D4IJUG7CDTziYzW-tUqtStQX3al-SIzd9wK-?purpose=fullsize
 
5

The ratio is the same, but the actual numbers are different.

Ratios describe relative quantities, not necessarily group size.


Comparing Different-Sized Groups

Suppose:

School A:

300 students, 30 computers.

School B:

500 students, 40 computers.

Simply comparing computers:

30 vs 40

suggests School B has more.

But compare computers to students.

School A:

30 : 300 = 1 : 10

School B:

40 : 500 = 2 : 25

This is equivalent to:

0.08 computers per student

compared with:

0.10 computers per student

Ratio and rate comparisons reveal information that totals alone may hide.


Choosing the Useful Form

Different situations may be easier to understand using different representations.

For example:

3 : 5

might be useful when mixing paint.

3/8

might be useful when describing the fraction of the total represented by the first quantity.

37.5%

might be useful when reporting the first quantity as a percentage of the total.

0.6

might be useful when comparing the first quantity directly with the second through division.

The best representation depends on the question being asked.


Worked Example 1: Recipe

A recipe uses:

flour : sugar = 5 : 2

If 20 cups of flour are used:

Scale factor:

5 → 20 = ×4

Sugar:

2 × 4 = 8 cups

Answer:

8 cups of sugar


Worked Example 2: Mixture

A solution uses:

concentrate : water = 1 : 6

You need:

21 L

altogether.

Total parts:

1 + 6 = 7

One part:

21 ÷ 7 = 3 L

Concentrate:

3 L

Water:

18 L

Check:

3 : 18 = 1 : 6


Worked Example 3: Map

Scale:

1 cm : 12 km

Map distance:

7.5 cm

Actual distance:

7.5 × 12 = 90 km

Answer:

90 km


Worked Example 4: Scale Drawing

A building is:

30 m high

A drawing uses:

1 cm : 5 m

Drawing height:

30 ÷ 5 = 6 cm

Answer:

6 cm


Worked Example 5: Sports

Player A scores:

24 goals in 32 games

Player B scores:

30 goals in 50 games

Player A:

24/32 = 0.75 goals/game

Player B:

30/50 = 0.60 goals/game

Using rates allows their scoring records to be compared relative to games played.


Worked Example 6: Table

A table shows:

Time Distance
2 h 140 km
4 h 280 km
6 h 420 km

Calculate:

140 ÷ 2 = 70 km/h

280 ÷ 4 = 70 km/h

420 ÷ 6 = 70 km/h

The ratio is constant.

Therefore, the data represent a proportional relationship with an average rate of:

70 km/h


Worked Example 7: Three-Part Ratio

A school club has students in the ratio:

Grade 8 : Grade 9 : Grade 10 = 2 : 3 : 4

There are:

45 students

altogether.

Total parts:

2 + 3 + 4 = 9

One part:

45 ÷ 9 = 5

Grade 8:

2 × 5 = 10

Grade 9:

3 × 5 = 15

Grade 10:

4 × 5 = 20

Check:

10 + 15 + 20 = 45


Worked Example 8: Scale Model

A model bridge uses a scale:

1 : 200

A section measures:

35 cm

on the model.

Actual length:

35 × 200 = 7000 cm

Convert:

7000 cm = 70 m

Answer:

70 m


Worked Example 9: Interpreting Data

A survey records:

Music = 48 students

Sports = 72 students

Art = 36 students

Find:

Sports : Music

Start:

72 : 48

Divide by 24:

3 : 2

Interpretation:

For every 3 students choosing sports, there are proportionally 2 students choosing music.


Worked Example 10: Comparison

Drink A uses:

2 parts concentrate : 7 parts water

Drink B uses:

3 parts concentrate : 9 parts water

Compare the amount of concentrate relative to water.

Drink A:

2/7 ≈ 0.286

Drink B:

3/9 = 1/3 ≈ 0.333

Drink B has a greater amount of concentrate relative to its water content.


A Reliable Real-World Ratio Strategy

When solving a practical ratio problem:

Step 1: Identify the quantities being compared.

Step 2: Write them in the correct order.

Step 3: Check the units.

Step 4: Convert units if necessary.

Step 5: Simplify the ratio if useful.

Step 6: Identify the scale factor or unit rate.

Step 7: Calculate the missing quantity.

Step 8: Include appropriate units.

Step 9: Check that the final quantities preserve the original ratio.

Step 10: Explain what the answer means in context.


Checking Your Answer

Suppose:

red paint : white paint = 2 : 5

You calculate that:

8 L red requires 20 L white

Check:

8 : 20

Divide both by 4:

2 : 5

The original ratio has been preserved.

Therefore, the answer is consistent.


Estimating Before Calculating

Suppose a map scale is:

1 cm : 9 km

and a route measures:

5.2 cm

Estimate:

5 × 9 ≈ 45 km

Exact calculation:

5.2 × 9 = 46.8 km

The exact answer is close to our estimate, so it appears reasonable.


When Ratio Reasoning Does Not Apply

Not every real-world relationship is proportional.

Suppose a delivery company charges:

$5 fixed fee + $2 per kilometre

For 1 km:

$7

For 2 km:

$9

For 3 km:

$11

The ratios:

7/1, 9/2, 11/3

are not constant.

Therefore, total cost and distance are not directly proportional.

The fixed $5 charge changes the relationship.


Common Mistakes

Mistake 1: Reversing the ratio

If the question asks for:

juice : water

do not write:

water : juice


Mistake 2: Changing only one quantity

If a recipe doubles, every ingredient must be scaled appropriately.


Mistake 3: Forgetting total parts

For:

2 : 3

the total is:

5 parts

not 3 parts.


Mistake 4: Ignoring units

For:

1 cm : 2 m

the units are different and must be handled carefully during calculations.


Mistake 5: Comparing totals instead of relative values

40 successes may sound better than 30 successes, but the number of attempts also matters.


Mistake 6: Assuming every table is proportional

Check whether the ratio or unit rate remains constant.


Mistake 7: Assuming a ratio tells you the total

A ratio of:

3 : 2

could describe:

3 and 2

30 and 20

300 and 200

or infinitely many other equivalent pairs.


Mistake 8: Confusing part-to-part with part-to-whole

If:

red : blue = 3 : 2

then the fraction that is red is:

3/5

not:

3/2


Why Ratios Are Powerful

Ratios allow us to take a known relationship and apply it to a different-sized situation.

https://images.openai.com/static-rsc-4/kiHs3Fw_NRkqTJbjIt7oYVvvUOd_Y_wZkjpF8GuaUxC7YdDmDg13rU6MnsPnTdcveydzQNJgaHlHUciGlJjN-GOgm0bGftBmRgHVdyR0AhIDqf1U8uEOqVAGVEN9wI15_ZlLwGGSH5byMEMvMessWHG1pUSPXgfhL4wXThpSOKxZV4SgIXDeEopNsdoDb9Et?purpose=fullsize
 
https://images.openai.com/static-rsc-4/fRGi6-axENjOQBpkk4uhbNV-PH071z-EaJm2b7dOMxoWCyjoFUXtBVCcNeqlPtx7z5_43gPbxsft4WyRpY2zIKuaGrr-Qj64vEcrYHxp17dAXrYZS1NfG41zfh6IjVO-rgVnKsgjrvUbOTDNmqrA25ziuX7AhiuDmmOUVoUyR6BvaJwUr5rnZSDjbt2UReNi?purpose=fullsize
 
https://images.openai.com/static-rsc-4/UOeAfG09XkCxUvsctijAgKPaJ1YCn9ktbGCNNDBYxBNH7LMXiFbT-VGrXnbkNPeLb1C9xR3sLH3yKQgcbg06bqjmOfmBc9MSQyASeN03Ed2nOfKAd-yq46mNcy9sRlwhDfnaUa7J6k5TXOUpRj45yG83bQb_moHqKLWTW80hWtzHBx0Zg40MjxJO4hrZknHx?purpose=fullsize
 
4

A recipe can be doubled.

A map can represent an entire country on one page.

A model can represent a huge building.

Athletes can be compared despite playing different numbers of games.

Mixtures can be reproduced consistently.

Data from groups of different sizes can be compared.

The numbers change, but the relationship remains consistent.


Did You Know?

Many objects around us depend on ratios.

A widescreen display may use an aspect ratio of:

16 : 9

A map may use a scale such as:

1 : 50,000

A model may use:

1 : 100

A recipe may use:

2 : 3

A sports statistic may compare:

successes : attempts

Ratios provide a common mathematical language for describing all of these relationships.


Key Terms

  • Ratio: Comparison between two or more quantities.
  • Equivalent ratios: Ratios representing the same proportional relationship.
  • Scale factor: Number used to multiply or divide related quantities.
  • Map scale: Ratio comparing map distance with actual distance.
  • Scale drawing: Drawing whose dimensions are proportional to the real object.
  • Scale model: Smaller or larger representation of an object that preserves proportional dimensions.
  • Mixture: Combination of two or more substances.
  • Part-to-part ratio: Comparison between different parts of a group.
  • Part-to-whole ratio: Comparison between one part and the total.
  • Rate: Ratio comparing quantities, often with different units.
  • Unit rate: Rate expressed per one unit.
  • Proportional relationship: Relationship that maintains a constant ratio.
  • Statistics: Numerical information collected and analyzed to describe data.
  • Aspect ratio: Ratio comparing width with height.
  • Concentration: Amount of one component relative to a mixture or solution.

Real-World Ratio Guide

Recipes

Keep ingredient ratios constant when scaling.

Mixtures

Maintain the correct proportion of each component.

Maps

Use the scale to convert between map and actual distance.

Scale Drawings

Multiply or divide dimensions using the scale factor.

Sports

Compare performance relative to attempts, games, time, or opportunities.

Statistics

Use ratios to compare groups of different sizes.

Tables

Look for a constant ratio or unit rate.

Graphs

Read the quantities first, then form and simplify the required ratio.

Science

Use ratios to describe quantities such as mass-to-volume, distance-to-time, chemical proportions, and concentrations.


Key Takeaways

  • Ratios are used throughout everyday life to compare related quantities.
  • Recipes use ratios to maintain consistent ingredient proportions.
  • Mixture ratios allow substances to be combined consistently.
  • Map scales compare distances on a map with actual distances.
  • Scale drawings and models preserve proportional dimensions.
  • Scale factors allow objects and relationships to be enlarged or reduced.
  • Sports ratios allow performance to be compared relative to opportunities.
  • Statistical ratios help compare groups of different sizes.
  • Tables can show whether ratios remain constant.
  • Graphs can provide quantities that can be compared using ratios.
  • Ratios can often be converted into fractions, decimals, percentages, or unit rates.
  • Units must be considered carefully when using maps and scale drawings.
  • Part-to-part ratios should not be confused with part-to-whole fractions.
  • Ratios describe relative quantities rather than necessarily describing the actual size of a group.
  • Not every real-world relationship is proportional.
  • A fixed fee or changing rate can prevent a relationship from maintaining a constant ratio.
  • Answers should be checked by simplifying the final quantities back to the original ratio.
  • Ratios help us solve real-world problems because they allow a known relationship to be scaled, compared, interpreted, and applied to new situations.