Ratios and Proportional Reasoning
5. Real-World Applications of Ratios
Learning outcomes
- I can use ratios in maps, recipes, and scale drawings.
- I can solve problems involving mixtures and comparisons.
- I can apply ratios to sports and statistics.
- I can interpret ratio information from graphs and tables.
- I can explain how ratios help solve real-world problems.


Why Are Ratios Useful?
Ratios allow us to compare quantities and describe how they are related.
In real life, we rarely use ratios only to simplify numbers such as:
12 : 18 = 2 : 3
Instead, ratios help us answer practical questions such as:
- How much of each ingredient should a recipe use?
- How far apart are two places on a map?
- How large should a scale model be?
- How should substances be mixed?
- How can athletes with different numbers of attempts be compared?
- How can data from different-sized groups be compared?
Ratios are useful because they describe a relationship that can be scaled up or down.
Ratios in Recipes
Recipes are one of the most familiar applications of ratios.
Suppose a pancake recipe uses:
flour : milk = 2 : 3
This means that for every:
2 parts flour
we use:
3 parts milk


The size of each "part" can change.
For example:
2 cups flour : 3 cups milk
4 cups flour : 6 cups milk
6 cups flour : 9 cups milk
All represent the same ratio:
2 : 3
Scaling a Recipe Up
Suppose a recipe for 4 people requires:
rice : vegetables = 3 : 2
If we double the recipe for 8 people, multiply both quantities by 2:
3 × 2 : 2 × 2
= 6 : 4
The relationship remains:
3 : 2
Scaling a recipe works because all ingredients are changed by the same scale factor.
Scaling a Recipe Down
Suppose a recipe uses:
600 g flour
300 g sugar
The ratio is:
600 : 300
Simplify:
2 : 1
If we want to make half as much:
300 g flour
150 g sugar
The ratio remains:
300 : 150 = 2 : 1
The quantities changed, but the proportions did not.
Finding a Missing Ingredient
A drink recipe uses:
juice : water = 2 : 5
If we use 8 cups of juice, how much water is needed?
Start:
2 : 5
The juice increased from:
2 → 8
Scale factor:
×4
Therefore:
5 × 4 = 20
Answer:
20 cups of water


Ratios and Total Amounts
Suppose fruit punch contains:
juice : water = 3 : 7
You want to make:
20 L
of punch.
Total ratio parts:
3 + 7 = 10
One part:
20 ÷ 10 = 2 L
Juice:
3 × 2 = 6 L
Water:
7 × 2 = 14 L
Check:
6 + 14 = 20 L
Therefore:
6 L juice and 14 L water
Ratios in Mixtures
Ratios are widely used when substances need to be combined in particular proportions.
Examples include:
- drinks
- paint
- concrete
- cleaning solutions
- fertilizers
- fuels
- laboratory solutions
- alloys


A mixture ratio tells us how much of each component should be used relative to the others.
Mixing Paint
Suppose a paint color requires:
blue : yellow = 3 : 2
If we use:
12 cups of blue paint
then:
3 → 12
Scale factor:
×4
Yellow paint:
2 × 4 = 8 cups
Therefore:
12 cups blue : 8 cups yellow
The ratio simplifies back to:
3 : 2
Three-Part Mixtures
Ratios can contain more than two quantities.
Suppose a mixture uses:
A : B : C = 2 : 3 : 5
If we need:
50 L
altogether, first find the total number of parts:
2 + 3 + 5 = 10 parts
One part:
50 ÷ 10 = 5 L
Therefore:
A:
2 × 5 = 10 L
B:
3 × 5 = 15 L
C:
5 × 5 = 25 L
Check:
10 + 15 + 25 = 50 L
Concentration and Ratios
Ratios can describe how concentrated a mixture is.
Consider:
Mixture A:
concentrate : water = 1 : 4
Mixture B:
concentrate : water = 1 : 8
Mixture A contains more concentrate relative to the amount of water.


This illustrates an important point:
Ratios help us compare relative amounts, not simply total quantities.
Ratios on Maps
Maps represent very large real-world distances on much smaller surfaces.
A map scale describes the relationship between:
distance on the map : actual distance
For example:
1 cm : 5 km
means:
1 cm on the map represents 5 km in reality.


Calculating Actual Distance from a Map
Suppose a map uses:
1 cm : 8 km
Two towns are:
6 cm
apart on the map.
Calculate:
6 × 8 = 48 km
Therefore:
actual distance = 48 km
Calculating Map Distance
Suppose:
1 cm : 10 km
Two locations are actually:
75 km
apart.
Calculate:
75 ÷ 10 = 7.5 cm
Therefore, their distance on the map should be:
7.5 cm
Ratio Scales
Maps sometimes use scales such as:
1 : 100,000
This means:
1 unit on the map represents 100,000 of the same units in reality.
For example:
1 cm : 100,000 cm
Since:
100,000 cm = 1 km
the scale can also be interpreted as:
1 cm : 1 km
Units are extremely important when working with map scales.
Another Map Scale Example
Suppose a map uses:
1 : 50,000
A road measures:
8 cm
on the map.
Actual distance:
8 × 50,000 = 400,000 cm
Convert:
400,000 cm = 4,000 m = 4 km
Therefore:
actual distance = 4 km
Scale Drawings
A scale drawing represents an object using dimensions that are proportional to the real object.
Scale drawings are used in:
- architecture
- engineering
- construction
- product design
- maps
- floor plans
- technical drawings


For example:
1 cm : 2 m
means every 1 cm on the drawing represents 2 m in reality.
Floor Plan Example
A floor plan uses:
1 cm : 2 m
A room measures:
4 cm × 3 cm
on the plan.
Actual length:
4 × 2 = 8 m
Actual width:
3 × 2 = 6 m
Therefore, the real room measures:
8 m × 6 m
Scale Models
Models also use ratios.
Suppose a model car has a scale of:
1 : 20
This means:
1 unit on the model represents 20 of the same units on the real car.


If the model is:
22 cm long
then the actual car would be:
22 × 20 = 440 cm
Convert:
440 cm = 4.4 m
Finding the Size of a Model
A real aircraft is:
36 m long
A model is built at:
1 : 100
Convert:
36 m = 3600 cm
Model length:
3600 ÷ 100 = 36 cm
Therefore:
model length = 36 cm
Scale Factors
The number used to enlarge or reduce quantities proportionally is called the scale factor.
Suppose:
Small drawing length = 5 cm
Actual length = 20 cm
Scale factor:
20 ÷ 5 = 4
Therefore, every measurement on the drawing must be multiplied by:
4
to find the corresponding actual measurement.
Scale Factors and Similar Shapes
Scale factors are also important in geometry.
Suppose a small rectangle measures:
3 cm × 5 cm
A larger similar rectangle uses a scale factor of:
4
New dimensions:
3 × 4 = 12 cm
5 × 4 = 20 cm


All corresponding lengths are multiplied by the same factor.
Comparing Quantities Using Ratios
Ratios allow us to compare groups even when the groups have different sizes.
Suppose:
Class A has:
12 laptops for 24 students.
Class B has:
15 laptops for 25 students.
Class A:
12 : 24 = 1 : 2
This means:
0.5 laptops per student
Class B:
15 : 25 = 3 : 5
This means:
0.6 laptops per student
Converting to a common form makes the comparison easier.
Ratios in Shopping
Suppose two packages contain:
Package A:
6 bottles for $12
Package B:
10 bottles for $18
Calculate the cost per bottle.
Package A:
$12 ÷ 6 = $2.00 per bottle
Package B:
$18 ÷ 10 = $1.80 per bottle


Rates and ratios help us compare packages of different sizes.
Ratios in Sports
Sports statistics frequently involve ratios and rates.
Examples include:
- successful shots : attempts
- wins : losses
- goals : games
- assists : games
- hits : attempts
- points : minutes played
Ratios allow performance to be compared even when athletes have participated different amounts.
Successful Shots
Player A makes:
18 shots from 30 attempts
Success ratio:
18 : 30
Simplify:
3 : 5
Success fraction:
18/30 = 0.60
Success percentage:
60%
Player B makes:
24 shots from 40 attempts
Ratio:
24 : 40 = 3 : 5
Percentage:
60%


Although the players made different numbers of shots, their success rates are equivalent.
Comparing Athletes Fairly
Suppose:
Player A:
15 goals in 20 games
Player B:
18 goals in 30 games
Looking only at total goals gives incomplete information.
Calculate goals per game.
Player A:
15 ÷ 20 = 0.75 goals/game
Player B:
18 ÷ 30 = 0.60 goals/game
The ratio provides another way of comparing performance relative to opportunities.
Context still matters: opponents, playing time, role, and other factors may also be relevant.
Win-Loss Ratios
Suppose a team has:
18 wins and 12 losses
Win-to-loss ratio:
18 : 12
Simplify:
3 : 2
This means that proportionally, the team recorded:
3 wins for every 2 losses
However, this does not mean the team literally followed a repeating pattern of three wins and two losses.
A ratio describes the overall relationship.
Ratios and Statistics
Ratios are widely used to summarize data.
Suppose a survey contains:
120 people who chose A
80 people who chose B
The ratio:
A : B = 120 : 80
Simplify:
3 : 2
This means that for every 3 responses for A, there were proportionally 2 responses for B.
Converting Statistical Ratios to Fractions
Suppose:
A : B = 3 : 2
Total parts:
3 + 2 = 5
Fraction choosing A:
3/5
Fraction choosing B:
2/5
Convert to percentages:
3/5 = 60%
2/5 = 40%
Ratios, fractions, decimals, and percentages can often describe the same data in different ways.
Ratios in Tables
Tables are useful for displaying proportional data.
Suppose a factory produces 40 components every 2 hours.
| Time |
Components |
|---|---|
| 2 | 40 |
| 4 | 80 |
| 6 | 120 |
| 8 | 160 |
| 10 | 200 |
The ratio remains:
40 components : 2 hours
Simplify to the unit rate:
20 components : 1 hour
or:
20 components/hour


Reading Ratio Information from a Table
Consider:
| Distance (km) | Time |
|---|---|
| 60 | 1 |
| 120 | 2 |
| 180 | 3 |
| 240 | 4 |
Calculate:
distance/time
For each row:
60/1 = 60
120/2 = 60
180/3 = 60
240/4 = 60
The ratio is constant.
Therefore, the table represents a proportional relationship with an average rate of:
60 km/h
Spotting a Non-Proportional Table
Consider:
| Items | Cost |
|---|---|
| 1 | $6 |
| 2 | $10 |
| 3 | $14 |
| 4 | $18 |
Check:
6/1 = 6
10/2 = 5
14/3 ≈ 4.67
18/4 = 4.5
The ratios are not equal.
Therefore, the relationship is not proportional.
The table may follow another pattern, but it does not maintain a constant ratio.
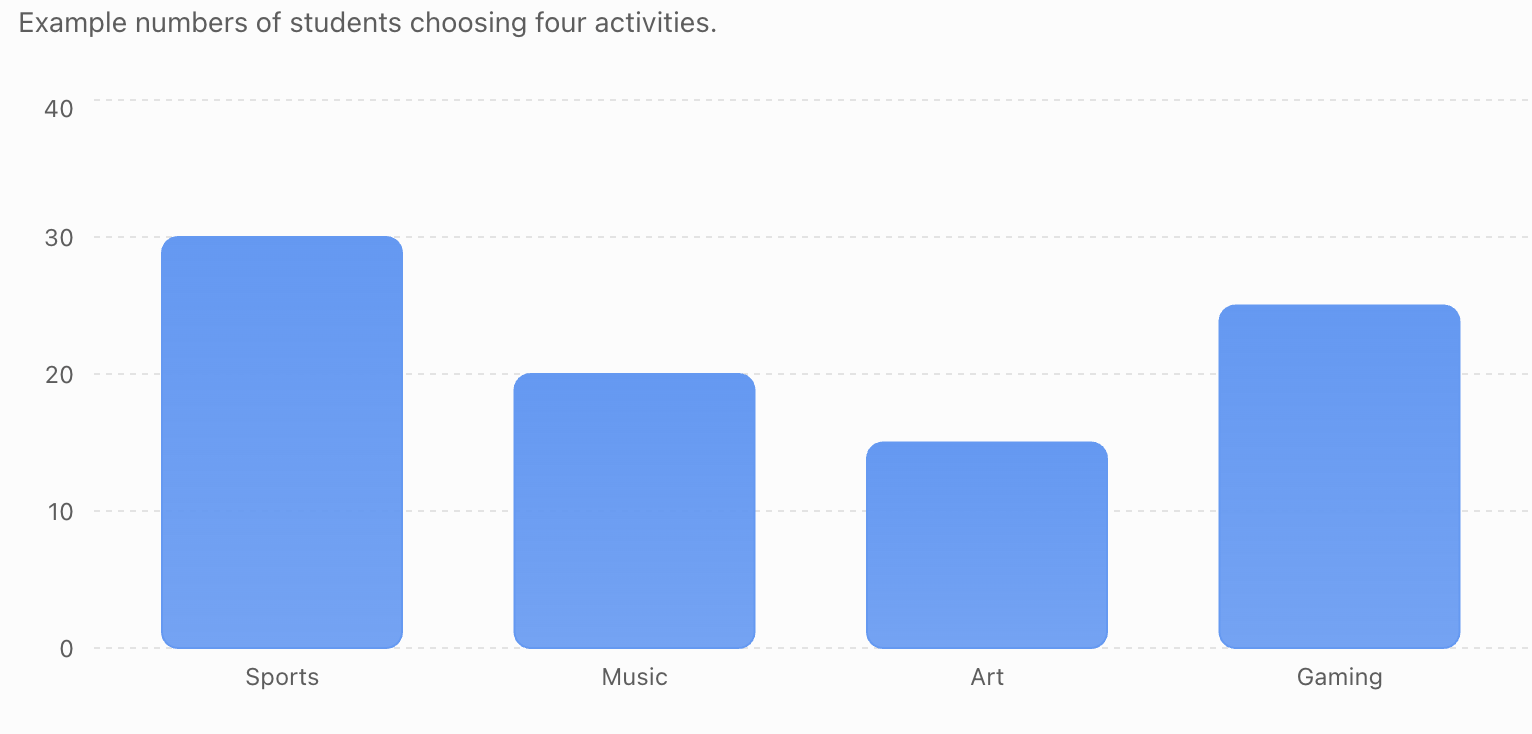
Ratios in Bar Graphs
Graphs can also communicate ratios.
Consider this illustrative survey of preferred after-school activities:
Illustrative activity preferences