Reaction Rate Graphs and Applications
2. Product Formation Graphs
Learning outcomes
- I can interpret graphs showing product formation over time.
- I can explain how product concentration changes during reactions.
- I can compare reaction rates using product graphs.
- I can identify completion points on graphs.
- I can relate graph features to reaction progress.


What Is a Product Formation Graph?
As a chemical reaction occurs:
reactants are consumed
and:
products are formed
A product formation graph shows how the amount or concentration of a product changes as time passes.
The graph can help us determine:
- how much product has formed
- how quickly product is being produced
- how the reaction rate changes
- when the reaction stops producing additional product
- how different reaction conditions affect reaction rate
These graphs are closely related to concentration-time graphs, but instead of focusing on disappearing reactants, we focus on:
appearing products
Understanding the Axes
A typical product formation graph has:
x-axis → time
y-axis → amount or concentration of product
The y-axis might show:
- concentration in mol/L
- mass in grams
- volume of gas in cm³
- amount in moles
Always read the:
axis label + units
before interpreting the graph.
Product Concentration Increases
At the beginning of many reactions, there may be:
little or no product
As reactant particles react:
product particles are formed
Therefore:
product concentration increases with time
A typical pattern is:
rapid increase → slower increase → plateau
A Typical Product Formation Graph
Consider these illustrative data:
| Time (s) | Product Concentration (mol/L) |
|---|---|
| 0 | 0.00 |
| 10 | 0.32 |
| 20 | 0.52 |
| 30 | 0.64 |
| 40 | 0.70 |
| 50 | 0.72 |
| 60 | 0.72 |
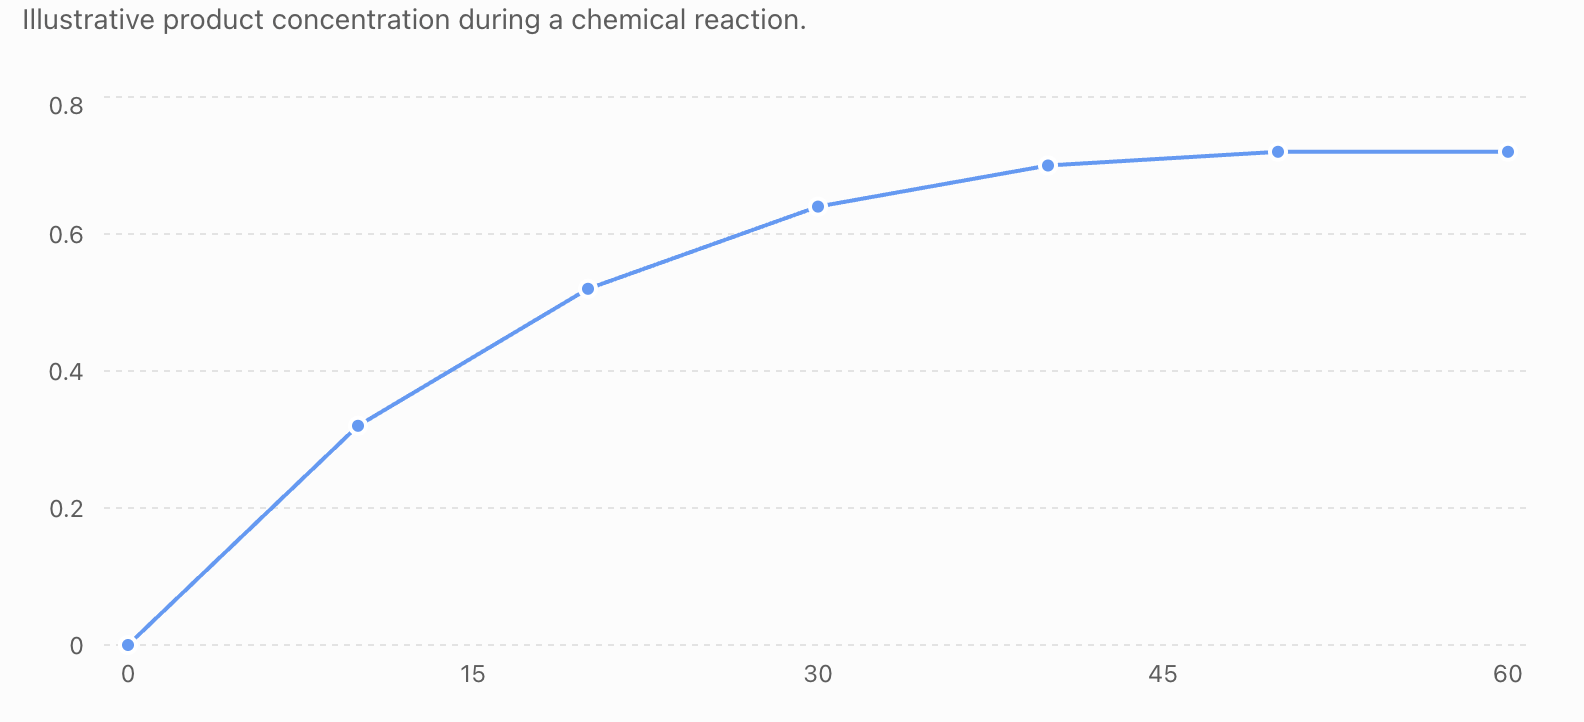
Notice that the graph:
- rises rapidly at first
- gradually becomes less steep
- eventually becomes horizontal
Each feature tells us something about:
reaction progress
Why Does the Graph Rise?
Products are created when reactant particles undergo successful:
chemical reactions
At the beginning:
product amount is low
As time passes:
more product is formed
Therefore, the curve moves:
upward
For a product formation graph:
upward curve = increasing amount of product
Reactants and Products
Consider a simple reaction:
A → B
A is the:
reactant
B is the:
product
As the reaction proceeds:
A decreases
while:
B increases
Therefore, their concentration-time graphs have opposite general directions.
Comparing Reactant and Product Graphs
| Reactant Graph | Product Graph |
|---|---|
| Usually starts high | Usually starts low |
| Decreases | Increases |
| Negative gradient | Positive gradient |
| Becomes less steep | Becomes less steep |
| Eventually may become horizontal | Eventually may become horizontal |
Both graphs describe:
the same reaction progress
from different perspectives.
Reactant and Product Together
For the simple illustrative reaction:
A → B
we might observe:
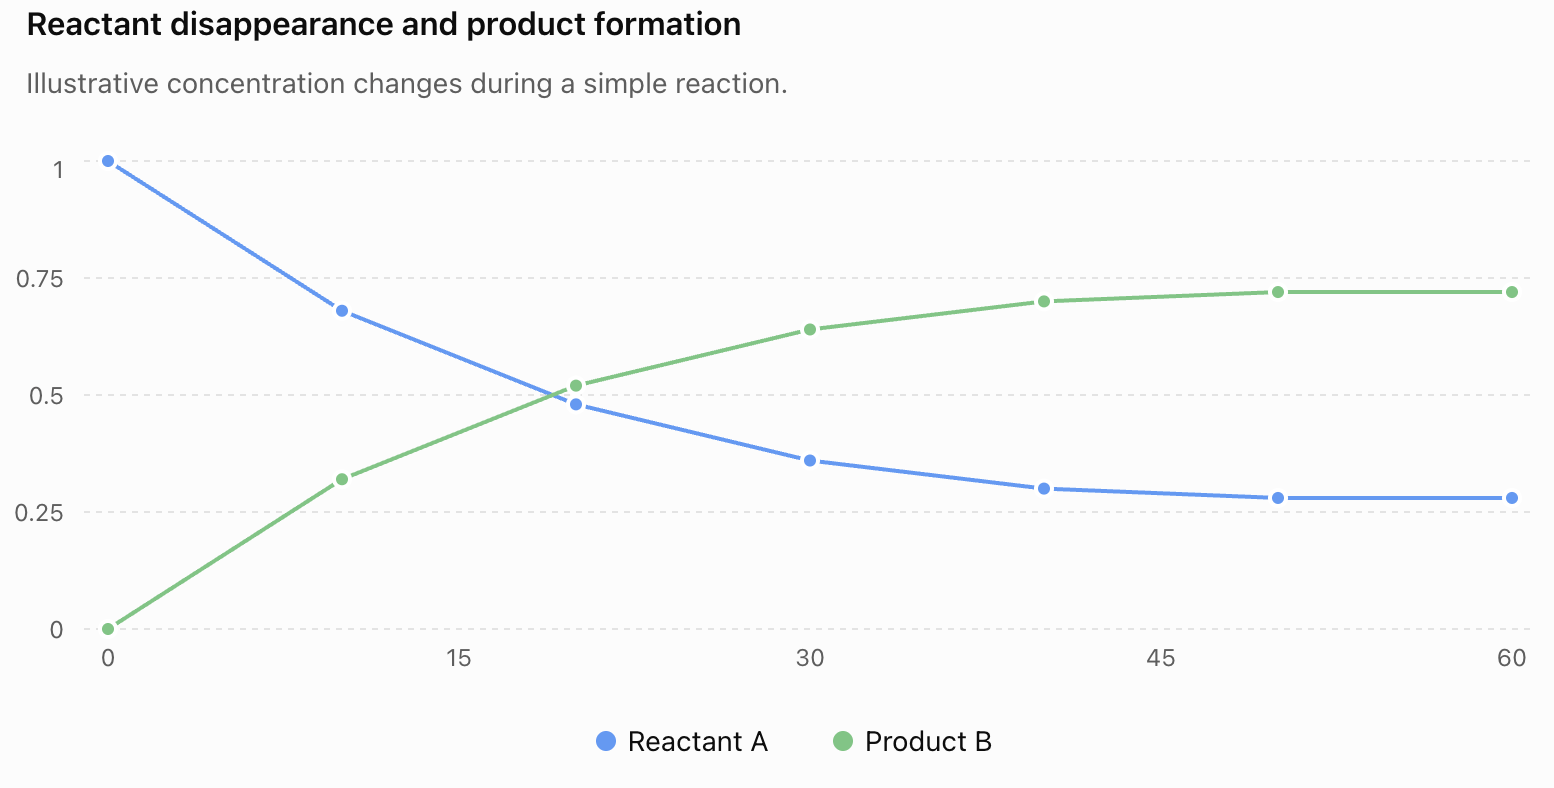
As reactant disappears:
product appears
This is one of the central ideas represented by reaction-progress graphs.
Reading a Product Graph
Suppose you are asked:
How much product has formed after 20 seconds?
Use the graph:
- Find 20 s on the x-axis.
- Move vertically to the curve.
- Move horizontally toward the y-axis.
- Read the value.
From our example:
product concentration = 0.52 mol/L
Always include the:
correct units
Product Formation and Reaction Rate
The shape of the graph also tells us about:
reaction rate
Reaction rate can be measured by how quickly product forms.
For a product:
average rate of formation = increase in product concentration ÷ time interval
or:
average rate = Δconcentration / Δtime
Gradient Represents Rate
The gradient of a product formation graph indicates how quickly product is being formed.
A:
steep positive gradient
means product is forming rapidly.
A:
shallow positive gradient
means product is forming more slowly.
A:
horizontal gradient
means there is no further net increase in product.
Therefore:
steeper graph = faster product formation
The Beginning of the Reaction
Product formation graphs are often steepest near:
the beginning
Why?
At the start:
- reactant concentrations are high
- many reactant particles are available
- collisions are relatively frequent
- successful collisions occur frequently
Therefore:
product forms quickly
The graph rises steeply.
Collision Theory
Reaction rate can be explained using:
collision theory
For particles to react, they must collide:
- with sufficient energy
- in a suitable orientation
Near the beginning of many reactions:
more reactant particles → more frequent collisions → more successful collisions → faster product formation
This produces:
a steep initial curve
Why Does the Curve Become Less Steep?
As the reaction continues:
reactants are consumed
Their concentrations decrease.
Therefore:
successful collisions become less frequent
Product continues to form, but:
more slowly
The graph becomes:
less steep


Reaction Progress and Graph Shape
We can divide a typical product graph into three stages.
Early stage
Graph is:
steep
Product is forming rapidly.
Middle stage
Graph becomes:
less steep
Product is still forming, but more slowly.
Final stage
Graph becomes:
horizontal
There is no further net increase in product.
So:
steep → fast
shallow → slower
flat → no further net product formation
Calculating Average Rate of Product Formation
Suppose product concentration increases from:
0.20 mol/L
to:
0.50 mol/L
during:
15 seconds
Change in concentration:
0.50 − 0.20 = 0.30 mol/L
Average rate:
0.30 ÷ 15
= 0.020 mol/L/s
Therefore:
average rate of product formation = 0.020 mol L⁻¹ s⁻¹
Another Example
At 10 seconds:
product concentration = 0.25 mol/L
At 30 seconds:
product concentration = 0.65 mol/L
Change in concentration:
0.65 − 0.25 = 0.40 mol/L
Change in time:
30 − 10 = 20 s
Average rate:
0.40 ÷ 20
= 0.020 mol/L/s
Positive Gradient
A product formation graph normally has a:
positive gradient
because:
product concentration increases as time increases
Mathematically:
Δproduct concentration > 0
Therefore:
gradient > 0
This contrasts with the concentration graph for a reactant, which normally has a:
negative gradient
Instantaneous Rate
The reaction rate may change continuously.
To estimate the rate at one particular moment, we can use:
a tangent
A tangent is drawn so that it touches the curve at the point being investigated.
The gradient of that tangent gives an estimate of:
instantaneous rate
Tangents on Product Graphs


A tangent near the beginning is usually:
steeper
A tangent later in the reaction is usually:
shallower
This provides mathematical evidence that:
the reaction rate decreases with time
When Is the Reaction Complete?
For a simple irreversible reaction, the reaction has effectively reached completion when:
no additional product is being formed
On a product formation graph, this is shown when the curve becomes:
horizontal
The product amount has reached a:
plateau
What Is a Plateau?
A plateau is a region of a graph where the y-value remains approximately constant.
For a product formation graph:
plateau = product concentration no longer increasing
The gradient is approximately:
zero
For a simple irreversible reaction, this generally indicates that the reaction has:
finished producing additional product
Finding the Completion Time
Suppose a graph rises until approximately:
50 seconds
and then remains horizontal.
We can say:
The reaction reaches its final product concentration at approximately 50 s.
Do not look for the very last point plotted.
Instead, look for:
where the graph first becomes essentially horizontal
Final Product Amount
The height of the plateau tells us:
the final amount or concentration of product
For example:
If the curve levels off at:
0.72 mol/L
then the final product concentration is:
0.72 mol/L
Therefore, the graph tells us two different things:
horizontal position of plateau → approximate completion time
vertical height of plateau → final product concentration
Comparing Two Reactions
Product formation graphs can be used to compare reactions under different conditions.
Suppose we have:
Reaction A
and:
Reaction B
If Reaction A rises more steeply than Reaction B:
Reaction A has the greater rate of product formation during that interval
If both eventually reach the same plateau:
they form the same final concentration of product
but at different rates.
Faster and Slower Reactions
Consider these illustrative data:
| Time (s) | Reaction A Product (mol/L) | Reaction B Product (mol/L) |
|---|---|---|
| 0 | 0.00 | 0.00 |
| 10 | 0.45 | 0.20 |
| 20 | 0.66 | 0.37 |
| 30 | 0.75 | 0.51 |
| 40 | 0.75 | 0.61 |
| 50 | 0.75 | 0.68 |
| 60 | 0.75 | 0.72 |
| 70 | 0.75 | 0.75 |
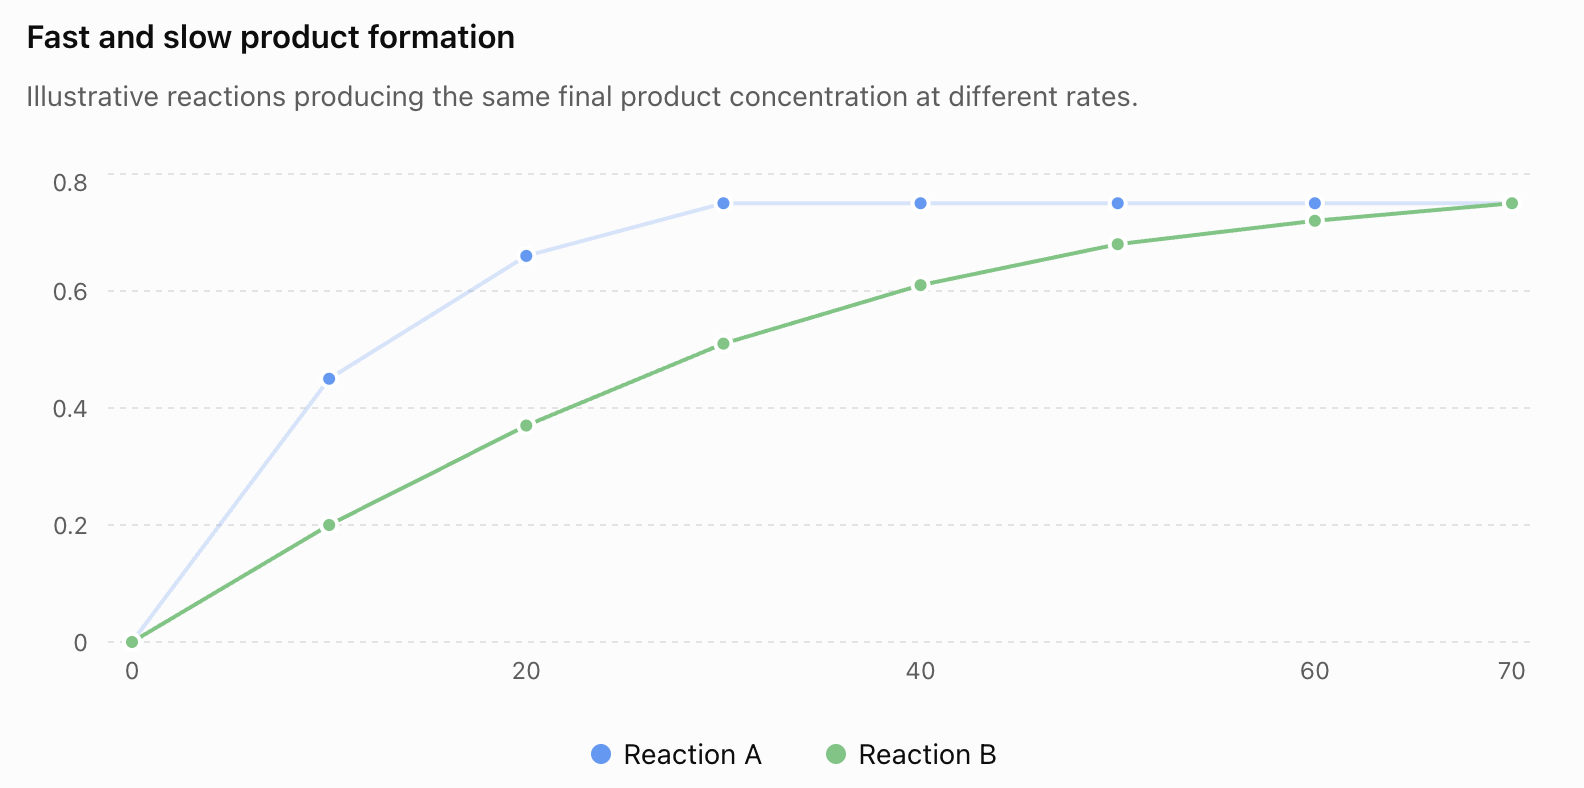
Reaction A:
- has the steeper initial curve
- forms product more quickly
- reaches the plateau sooner
Reaction B:
- has a shallower curve
- forms product more slowly
- takes longer to reach the same plateau
Same Product, Different Rate
This comparison illustrates an extremely important idea:
rate and yield are not the same thing
Both reactions eventually produce:
0.75 mol/L
But Reaction A gets there:
faster
Therefore:
Reaction A has the greater rate
but:
both have the same final product concentration
Faster Does Not Mean More
Students sometimes assume:
faster reaction = more product
That is not necessarily true.
Two reactions can produce exactly the same final amount of product.
One simply reaches that amount:
more quickly
So always distinguish between:
rate → how quickly
and:
final amount → how much
Different Plateau Heights
Now suppose:
Reaction A plateaus at 0.80 mol/L
while:
Reaction B plateaus at 0.50 mol/L
Then Reaction A has produced a:
greater final concentration of product
However, this alone does not tell us why.
Possible explanations could include differences in:
- starting quantities
- limiting reactants
- reaction conditions
- equilibrium position
The graph shows:
what happened
Additional information may be needed to explain:
why
Comparing Initial Rates
To compare the initial rates, examine the curves close to:
t = 0
The reaction with the:
steeper initial gradient
has the greater initial rate of product formation.
This is more useful than simply asking:
which curve is higher?
Rate depends on:
slope
not just height.
Effect of Temperature
Higher temperature usually increases reaction rate.
Particles have greater:
kinetic energy
This produces:
- more frequent collisions
- more energetic collisions
- a greater proportion of collisions exceeding activation energy
Therefore, a higher-temperature product graph will often:
rise more steeply
and reach its final plateau:
sooner
Temperature Comparison
If two reactions use identical quantities but different temperatures:
higher temperature → steeper initial slope → faster product formation
If temperature changes only the rate and not the overall reaction outcome:
both curves reach the same final plateau


Effect of a Catalyst
A catalyst increases reaction rate by providing an alternative pathway with:
lower activation energy
Therefore:
with catalyst → steeper curve
without catalyst → shallower curve
If both experiments begin with the same reactant quantities and proceed to the same completion:
both produce the same final amount
The catalyst changes:
how quickly product forms
not the stoichiometric amount available from the starting reactants.
Effect of Concentration
Increasing reactant concentration means there are:
more reactant particles per unit volume
This can produce:
more frequent successful collisions
and therefore:
faster product formation
The graph may initially rise:
more steeply
However, if the starting quantities themselves differ, the final product amounts may also differ.
Always check the experimental conditions.
Effect of Surface Area
When a solid reacts, increasing its surface area can increase reaction rate.
For example:
powdered solid
has more exposed surface than the same mass in:
large chunks
More exposed particles are available for collisions.
Therefore:
greater surface area → faster reaction → steeper product formation curve
Gas Production Graphs
Some reactions produce a:
gas
Instead of measuring concentration, scientists may measure the:
volume of gas produced
For example:
acid + carbonate → salt + water + carbon dioxide
The graph may show:
volume of CO₂ (cm³) vs time


The interpretation is almost identical to a product concentration graph.
Gas Volume Over Time
Suppose carbon dioxide production gives:
| Time (s) | CO₂ Volume (cm³) |
|---|---|
| 0 | 0 |
| 10 | 28 |
| 20 | 44 |
| 30 | 53 |
| 40 | 57 |
| 50 | 58 |
| 60 | 58 |
The graph would:
rise rapidly
then:
rise more slowly
and finally:
plateau at 58 cm³
Therefore:
final gas volume = 58 cm³
and the reaction reaches its final gas volume at approximately:
50 seconds
Measuring Gas Formation
Gas-producing reactions can be investigated using equipment such as a:
gas syringe


As gas forms:
gas volume increases
Measurements can be recorded at regular time intervals.
These data can then be plotted as:
gas volume vs time
This creates a product formation graph.
Mass-Loss Graphs
Some gas-producing reactions can also be followed by measuring:
mass
If gas escapes from an open reaction vessel:
total measured mass decreases
This produces a graph that slopes:
downward
even though a product is being formed.
Why?
Because the gaseous product:
leaves the apparatus
Therefore, always identify:
what the y-axis actually measures
before interpreting graph direction.
The Axis Determines the Meaning
Consider these three graphs for the same gas-producing reaction:
product concentration vs time → increases
gas volume vs time → increases
mass of reaction vessel vs time → decreases
All three can describe:
the same reaction
The direction of the graph depends on:
what is being measured
Reaction Progress
Product formation graphs provide a visual record of:
reaction progress
At the beginning:
very little product has formed
During the reaction:
product accumulates
Near the end:
product forms more slowly
At the final plateau:
no further net product accumulation occurs
The graph therefore summarizes the entire reaction in:
one curve
Percentage of Reaction Progress
If the final product amount is known, we can estimate how far the reaction has progressed.
Suppose:
final product = 80 cm³
At a certain time:
product formed = 40 cm³
Then:
40 / 80 × 100 = 50%
Approximately:
50% of the final product amount has formed
This can help compare how rapidly different reactions approach their final state.
Halfway Point
The time required to produce half the final amount can also be useful.
If the final product amount is:
60 cm³
half is:
30 cm³
Find 30 cm³ on the y-axis and determine the corresponding:
time
A faster reaction reaches the halfway point:
sooner
Reaction A vs Reaction B
Suppose both reactions produce a final gas volume of:
60 cm³
Reaction A reaches 30 cm³ in:
12 seconds
Reaction B reaches 30 cm³ in:
28 seconds
Reaction A therefore reaches half the final product amount:
more quickly
This is another way to compare reaction progress.
Graph Shape and Particle Behaviour
The macroscopic graph can be explained by microscopic particle behaviour.
Beginning
Many reactant particles are available.
Frequent successful collisions
↓
rapid product formation
↓
steep graph
Later
Fewer reactant particles remain.
Fewer successful collisions
↓
slower product formation
↓
shallower graph
Final stage
No further net product accumulation.
↓
horizontal graph
From Particles to Graphs
This connection is important:
particle behaviour → reaction rate → graph shape
A graph is not simply a mathematical picture.
Its shape represents what is happening among:
reacting particles
at the microscopic level.
A Useful Interpretation Method
For product formation graphs, use:
S-R-P
S — Slope
How steep is the curve?
This tells you about:
reaction rate
R — Rise
How much does the graph increase?
This tells you how much:
product has formed
P — Plateau
Where does the curve become horizontal?
This tells you:
the final product amount and when net product formation stops
Describing a Product Graph
Avoid:
"The graph goes up and then becomes flat."
Instead write:
"The amount of product increases rapidly at first, then increases more slowly before reaching a constant final value."
An even stronger answer:
"The steep initial gradient shows rapid product formation. As reactants are consumed, the reaction rate decreases, so the gradient becomes smaller. Eventually the graph reaches a plateau, indicating no further net product formation."
Using Numerical Evidence
Strong graph descriptions should include numbers when available.
Instead of:
"Product increases quickly."
write:
"Product concentration increases from 0.00 mol/L to 0.52 mol/L during the first 20 seconds."
Instead of:
"The reaction eventually finishes."
write:
"The graph becomes horizontal at approximately 50 s, with a final product concentration of about 0.72 mol/L."
Numerical evidence makes scientific explanations:
more precise
Worked Example 1
A reaction produces the following gas volumes:
| Time (s) | Gas Volume (cm³) |
|---|---|
| 0 | 0 |
| 10 | 24 |
| 20 | 39 |
| 30 | 47 |
| 40 | 51 |
| 50 | 52 |
| 60 | 52 |
Describe the graph.
The gas volume increases rapidly at first, then increases more slowly. It reaches a constant volume of:
52 cm³
at approximately:
50 seconds
Worked Example 2
Using the previous data, calculate the average rate of gas formation during the first 20 seconds.
Change in gas volume:
39 − 0 = 39 cm³
Change in time:
20 − 0 = 20 s
Average rate:
39 ÷ 20 = 1.95 cm³/s
Therefore:
average rate = 1.95 cm³/s
Worked Example 3
During the interval from 30 s to 50 s:
Gas volume increases from:
47 cm³ to 52 cm³
Change:
52 − 47 = 5 cm³
Time interval:
50 − 30 = 20 s
Average rate:
5 ÷ 20 = 0.25 cm³/s
Compare this with the first 20 seconds:
first 20 s = 1.95 cm³/s
30–50 s = 0.25 cm³/s
Therefore, the reaction has:
slowed considerably
Worked Example 4
Reaction A and Reaction B both eventually produce:
80 cm³ of gas
Reaction A reaches 80 cm³ in:
40 seconds
Reaction B reaches 80 cm³ in:
90 seconds
What can we conclude?
Both produce the:
same final amount of gas
but Reaction A produces it:
more rapidly
Therefore:
Reaction A has a greater overall rate of product formation.
Worked Example 5
Reaction X reaches a plateau at:
70 cm³
Reaction Y reaches a plateau at:
45 cm³
What can we conclude?
Reaction X produces:
25 cm³ more final gas
because:
70 − 45 = 25 cm³
However, we cannot determine why from the graph alone.
We would need information about:
- reactant quantities
- concentrations
- limiting reactants
- reaction conditions
Completion vs Equilibrium
A horizontal product graph does not always mean the chemical reaction has completely stopped.
For a simple irreversible reaction, a plateau often indicates:
effective completion
For a reversible reaction at equilibrium:
forward and reverse reactions continue
but:
product concentration remains constant
because the forward and reverse rates are equal.
Therefore:
flat graph = no net concentration change
not necessarily:
no molecular reactions occurring
Common Misconception: The Highest Curve Is Always Fastest
A curve being higher does not automatically mean the reaction is faster.
Rate depends on:
gradient
For example, a curve could have a high product concentration but be completely horizontal.
At that moment:
rate of net product formation = zero
Always examine:
slope, not simply height
Common Misconception: The Plateau Is the Reaction Rate
The plateau height represents:
final product amount or concentration
It does not represent:
reaction rate
Rate is determined by:
gradient
So remember:
slope → rate
height → amount
Common Misconception: A Flat Graph Means No Product
A horizontal graph means:
product amount is constant
The product concentration may actually be:
very high
For example, a horizontal line at 0.80 mol/L means:
0.80 mol/L of product remains present
It simply is not increasing further.
Common Misconception: A Catalyst Produces More Product
For a reaction that proceeds to the same completion:
catalyst → faster reaction
but not:
more final product
The catalyzed curve reaches the same plateau:
sooner
This distinction is frequently tested.
Common Misconception: Reaction Rate Is Constant
A curved product formation graph has a changing:
gradient
Therefore:
reaction rate changes
If the graph becomes progressively shallower:
reaction rate is decreasing
Common Misconception: Product Graphs Must Always Show Concentration
Product formation can be measured using several quantities.
A graph may show:
- concentration
- mass
- volume
- moles
- pressure in some experimental systems
Always examine:
what is actually being measured
Check Your Understanding
1. What does an upward-sloping product formation graph indicate?
2. Why is a product formation graph often steepest near the beginning of a reaction?
3. What does the gradient of a product formation graph represent?
4. Explain why the graph usually becomes less steep as the reaction proceeds.
5. What does a plateau represent on a simple product formation graph?
6. A product concentration increases from 0.20 mol/L to 0.60 mol/L in 20 s. Calculate the average rate of product formation.
7. Two reactions reach the same plateau, but one reaches it sooner. What does this tell you?
8. Two reactions have different plateau heights. What does this tell you about their final product amounts?
9. Explain why a catalyst can change the shape of a product formation graph without changing the final plateau in a reaction that proceeds to the same completion.
10. Explain how the changing gradient of a product formation graph can be explained using collision theory.
Key Terms
- Product: Substance formed during a chemical reaction.
- Product formation: Production of new substances as a chemical reaction proceeds.
- Concentration: Amount of a substance present per unit volume.
- Reaction rate: Measure of how quickly reactants are consumed or products are formed.
- Gradient: Slope of a graph representing rate of change.
- Average rate: Change in measured quantity divided by the corresponding time interval.
- Instantaneous rate: Reaction rate at a particular moment.
- Initial rate: Reaction rate at the beginning of a reaction.
- Tangent: Straight line used to estimate the gradient of a curve at one point.
- Plateau: Horizontal region where the measured quantity remains approximately constant.
- Reaction progress: Extent to which reactants have been converted into products.
- Completion: Stage at which a simple irreversible reaction can no longer produce significant additional product.
- Final product amount: Quantity of product present when no further net product formation occurs.
- Collision theory: Explanation of reaction rates based on collisions between reacting particles.
- Successful collision: Collision with sufficient energy and suitable orientation to produce a reaction.
- Activation energy: Minimum energy required for a successful reaction-producing collision.
- Catalyst: Substance that increases reaction rate by providing an alternative pathway with lower activation energy.
- Dynamic equilibrium: State where forward and reverse reactions continue at equal rates, causing concentrations to remain constant.
Key Takeaways
- Product formation graphs show how the amount or concentration of a product changes over time.
- Product amount usually increases as a reaction proceeds.
- Product graphs often rise rapidly at first and then more slowly.
- The gradient of the graph represents the rate of product formation.
- Steeper gradient = faster product formation.
- Shallower gradient = slower product formation.
- Horizontal graph = no further net product accumulation.
- Product formation is often fastest near the beginning because reactant concentrations are highest.
- As reactants are consumed, successful collisions generally become less frequent and reaction rate decreases.
- Average rate can be calculated using change in product amount ÷ change in time.
- Tangents can be used to estimate instantaneous rates.
- The plateau height represents the final measured amount or concentration of product.
- The time at which the plateau begins can indicate when a simple irreversible reaction effectively reaches completion.
- Two reactions can produce the same final amount at different rates.
- A faster reaction does not necessarily produce more product.
- Slope tells us how fast; plateau height tells us how much.
- Temperature, concentration, catalysts, and surface area can affect reaction rate and therefore graph shape.
- A catalyst can make the curve steeper and cause the plateau to be reached sooner without changing the final amount for a reaction that proceeds to the same completion.
- Product formation may be monitored using concentration, gas volume, mass, moles, or other suitable measurements.
- Always read the axes before interpreting a reaction graph.
- Graph features can be connected to particle behaviour using collision theory.
- For product graphs, a useful interpretation strategy is Slope → Rise → Plateau.
- A useful overall relationship is reactant particles → successful collisions → product formation → changing graph gradient → final plateau.