Reaction Rate Graphs and Applications
| Website: | Young Education |
| Kurs: | Chemical Energetics |
| Buch: | Reaction Rate Graphs and Applications |
| Gedruckt von: | ゲストユーザ |
| Datum: | Montag, 5. Oktober 2026, 03:04 |
1. Concentration-Time Graphs
Learning outcomes
- I can interpret concentration-time graphs.
- I can describe changes in reactant concentration during a reaction.
- I can explain how graph shape relates to reaction rate.
- I can compare reactions using concentration-time graphs.
- I can identify when a reaction has reached completion.


What Is a Concentration-Time Graph?
Chemical reactions change substances over time.
As a reaction occurs:
- reactants are used up
- products are formed
One way to follow these changes is to measure the concentration of a substance at different times.
A concentration-time graph shows how the concentration of a reactant or product changes as a reaction proceeds.
These graphs provide useful information about:
- how quickly a reaction occurs
- how reactant concentration changes
- how product concentration changes
- when the reaction slows down
- when concentrations stop changing
- how two reactions compare
Understanding the Axes
A typical concentration-time graph has:
x-axis → time
y-axis → concentration
Concentration may be measured in units such as:
mol/L
or:
mol dm⁻³
Time may be measured in:
- seconds
- minutes
- hours
depending on how quickly the reaction occurs.
What Is Concentration?
Concentration describes how much of a substance is present in a particular volume.
For solutions, concentration is often expressed as:
moles of solute per litre of solution
A higher concentration means there are:
more particles per unit volume
A lower concentration means there are:
fewer particles per unit volume
Reactant Concentration During a Reaction
Reactants are:
consumed
during a chemical reaction.
Therefore, their concentrations usually:
decrease with time
Consider the reaction:
A → B
At the beginning, there is a high concentration of A.
As the reaction proceeds:
A particles are converted into B particles
Therefore:
[A] decreases
while:
[B] increases
Square brackets are commonly used to mean:
concentration
So:
[A] = concentration of A
A Typical Reactant Concentration-Time Graph
Suppose a reactant begins at a concentration of 1.0 mol/L.
Illustrative data might look like this:
| Time (s) | Reactant Concentration (mol/L) |
|---|---|
| 0 | 1.00 |
| 10 | 0.70 |
| 20 | 0.50 |
| 30 | 0.38 |
| 40 | 0.32 |
| 50 | 0.30 |
| 60 | 0.30 |
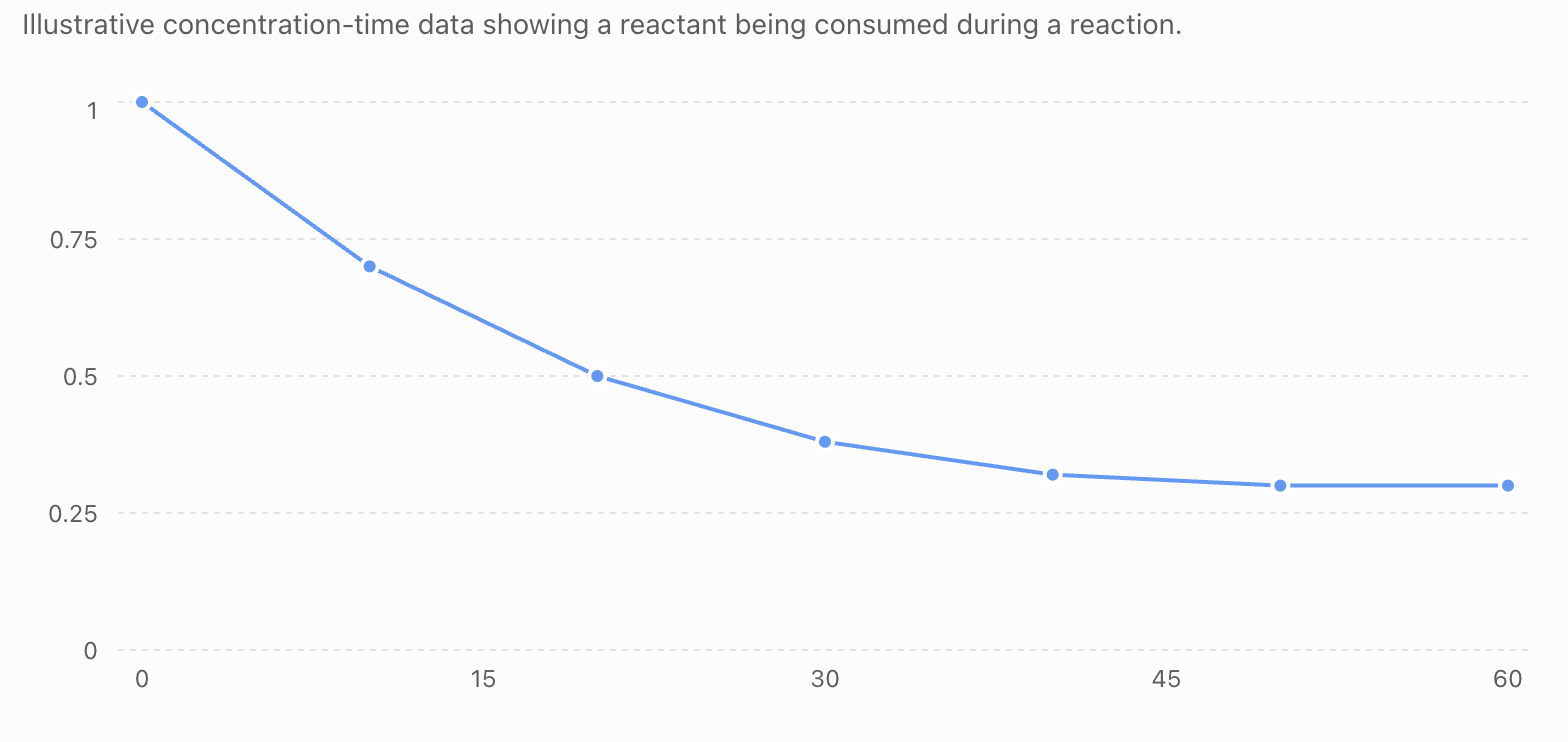
Notice two important features:
The concentration decreases.
and:
The graph becomes less steep with time.
Both features tell us something about the reaction.
Why Does Reactant Concentration Decrease?
Reactant particles are converted into:
products
Therefore, as time passes:
number of reactant particles decreases
which causes:
reactant concentration to decrease
For example:
hydrogen + iodine → hydrogen iodide
As the reaction proceeds, hydrogen and iodine are consumed.
Their concentrations decrease while the concentration of hydrogen iodide:
increases
Product Concentration During a Reaction
Products behave differently.
At the beginning of a reaction, there may be:
little or no product
As the reaction proceeds:
product concentration increases
Eventually, the graph may level off.


Therefore:
reactant concentration → generally decreases
product concentration → generally increases
Reading Concentration from a Graph
Suppose you are asked:
What is the reactant concentration at 20 seconds?
Use the graph like this:
- Find 20 s on the x-axis.
- Move vertically until you reach the curve.
- Move horizontally toward the y-axis.
- Read the concentration.
For our example:
at 20 s, concentration = 0.50 mol/L
Graph reading should always include:
the correct units
Describing a Concentration-Time Graph
When describing a graph, avoid vague statements such as:
"The graph goes down."
Instead say:
"The concentration of the reactant decreases with time."
An even stronger description might be:
"The reactant concentration decreases rapidly at first and then decreases more slowly before becoming constant."
This describes both:
the direction of change
and:
how the rate of change varies
Concentration-Time Graphs and Reaction Rate
A concentration-time graph can also tell us about:
reaction rate
Reaction rate describes:
how quickly reactants are consumed or products are formed
For a reactant, the average rate of disappearance can be written as:
average rate = decrease in concentration ÷ time interval
More generally:
average rate = change in concentration ÷ change in time
or:
rate = Δconcentration / Δtime
For a disappearing reactant, the concentration change itself is negative, so the rate of disappearance is often reported as a positive magnitude.
Gradient and Reaction Rate
The gradient or slope of a concentration-time graph tells us how quickly concentration is changing.
A:
steep slope = rapid change in concentration
A:
shallow slope = slower change in concentration
A:
horizontal line = no change in concentration
Therefore:
the steeper the concentration-time graph, the greater the magnitude of the reaction rate
Why Is the Graph Usually Steepest at the Beginning?
At the beginning of many reactions, reactant concentration is:
highest
There are many reactant particles available.
This generally leads to:
more frequent successful collisions
Therefore, the reaction is often:
fastest near the beginning
The concentration changes quickly.
The graph is therefore:
steep
Why Does the Graph Become Less Steep?
As the reaction continues:
reactants are consumed
Their concentrations decrease.
There are fewer reactant particles available for collisions.
Successful collisions generally occur:
less frequently
The reaction slows down.
Therefore:
the graph becomes less steep


Linking Graph Shape to Particle Collisions
The graph can be connected directly to:
collision theory
At the beginning:
high concentration → many particles → frequent collisions → faster reaction
Later:
lower concentration → fewer reactant particles → fewer successful collisions → slower reaction
Therefore:
concentration decreases → collision frequency decreases → reaction rate decreases
This explains the curved shape commonly seen on concentration-time graphs.
Calculating Average Rate
Suppose a reactant concentration decreases from:
0.80 mol/L
to:
0.50 mol/L
during a period of:
15 seconds
Decrease in concentration:
0.80 − 0.50 = 0.30 mol/L
Average rate of disappearance:
rate = 0.30 ÷ 15
rate = 0.020 mol/L/s
Therefore:
average rate = 0.020 mol L⁻¹ s⁻¹
Average Rate Over a Time Interval
Suppose this information is obtained from a graph:
At 10 seconds:
[A] = 0.80 mol/L
At 30 seconds:
[A] = 0.40 mol/L
Change in time:
30 − 10 = 20 s
Decrease in concentration:
0.80 − 0.40 = 0.40 mol/L
Average rate:
0.40 ÷ 20 = 0.020 mol/L/s
The average rate of disappearance of A is:
0.020 mol L⁻¹ s⁻¹
Average Rate vs Instantaneous Rate
The rate of a reaction often changes continuously.
An average rate describes the rate over:
a time interval
An instantaneous rate describes the rate at:
one particular moment
The instantaneous rate can be estimated by drawing:
a tangent to the curve
at the required point.
Tangents
A tangent is a straight line that touches a curve at a particular point and follows the direction of the curve there.
The gradient of the tangent gives the:
instantaneous rate of change


For a decreasing reactant graph:
steeper tangent → faster disappearance
shallower tangent → slower disappearance
Calculating a Tangent Gradient
Suppose a tangent passes through two convenient points:
(20 s, 0.70 mol/L)
and:
(40 s, 0.30 mol/L)
Gradient:
gradient = change in concentration / change in time
gradient = (0.30 − 0.70) / (40 − 20)
gradient = −0.40 / 20
gradient = −0.020 mol L⁻¹ s⁻¹
The negative sign indicates that the reactant concentration is:
decreasing
The magnitude of its instantaneous rate of disappearance is:
0.020 mol L⁻¹ s⁻¹
Why Is Reactant Gradient Negative?
For a reactant:
concentration decreases as time increases
Therefore:
Δconcentration is negative
So the mathematical gradient is:
negative
This does not mean the reaction has a "negative rate."
It means the measured reactant concentration is:
decreasing
Product Graphs Have Positive Gradients
For a product:
concentration usually increases with time
Therefore:
Δconcentration is positive
and the concentration-time graph has a:
positive gradient
At the beginning, the product curve may be steep.
Later, it becomes less steep as the reaction slows.
Eventually, it may become:
horizontal
Reactant and Product on the Same Graph
For a simple reaction:
A → B
the graphs may look like this:
- A begins high and decreases.
- B begins low and increases.
- Both curves gradually flatten.
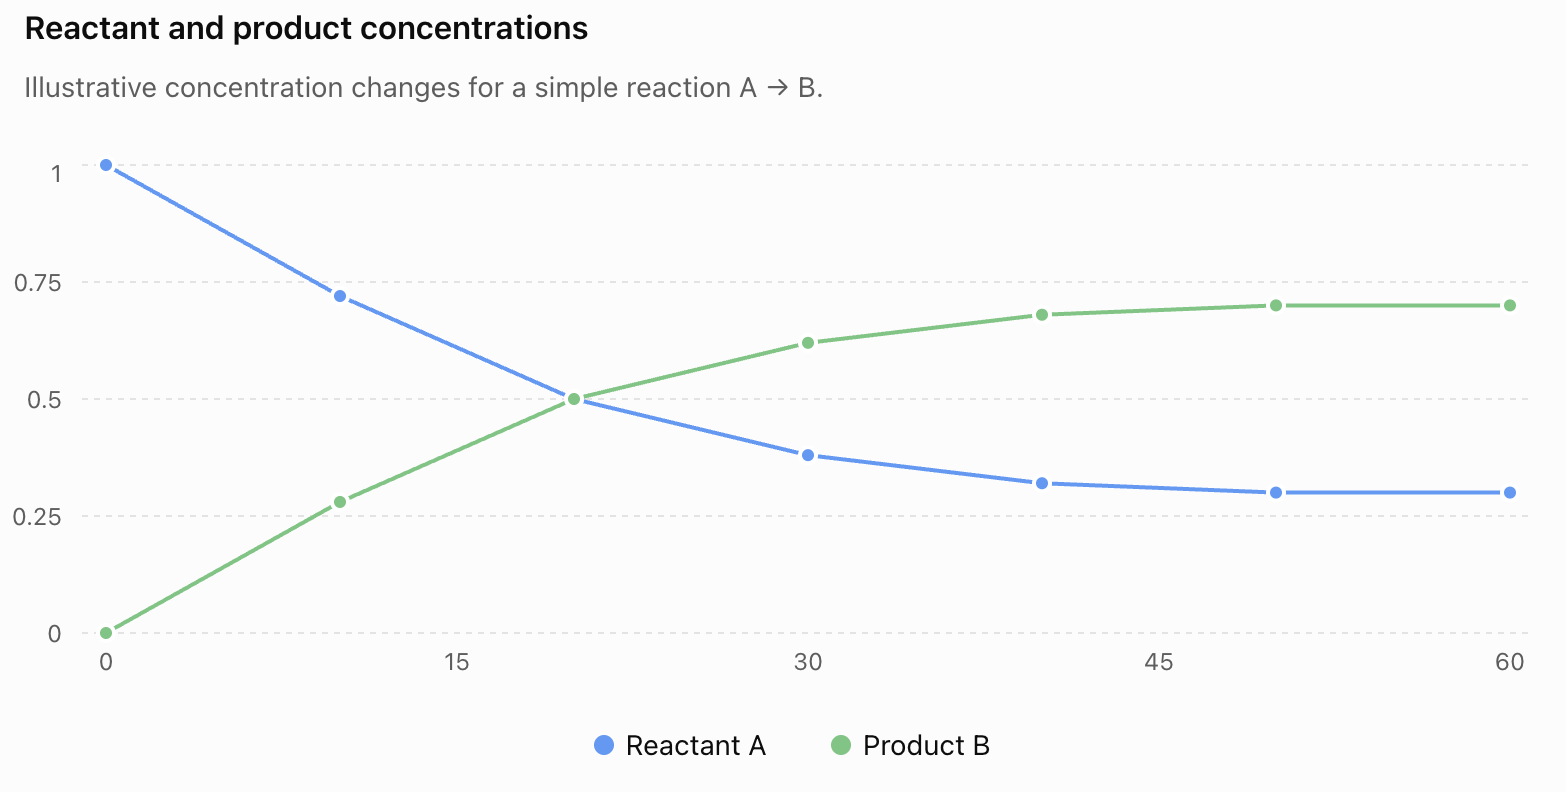
The graph makes it easy to see how reactant disappearance is connected to:
product formation
When Has a Reaction Reached Completion?
For many simple reactions that effectively proceed to completion, the reaction is complete when the limiting reactant has been:
used up
On a concentration-time graph, this is often indicated when the measured concentrations:
stop changing
The curves become:
horizontal
This means:
gradient = 0
and there is no further net concentration change.
Does Reactant Concentration Always Reach Zero?
No.
A graph can level off while some measured reactant remains.
This can happen because:
- another reactant was the limiting reactant
- the measured reactant was present in excess
- the reaction is reversible and has reached equilibrium
Therefore:
a horizontal graph does not automatically mean every reactant has been completely consumed
This is an important distinction.
Completion vs Equilibrium
These ideas should not be confused.
Reaction completion
A limiting reactant has effectively been consumed and the reaction no longer proceeds significantly because the required reactant is unavailable.
Dynamic equilibrium
In a reversible reaction:
forward reaction continues
and:
reverse reaction continues
but they occur at equal rates.
Therefore, concentrations remain:
constant
A concentration-time graph can become horizontal in both situations.
Context is needed to decide:
why
the concentrations have stopped changing.
Identifying Completion from a Simple Graph
For an introductory irreversible reaction, suppose the product concentration rises and then becomes constant after:
50 seconds
We can say:
The reaction is effectively complete by about 50 s because the product concentration no longer changes.
Likewise, if the limiting reactant reaches zero concentration:
that reactant has been completely consumed
Comparing Reaction Rates
Concentration-time graphs are particularly useful for comparing:
different reactions or different conditions
Suppose two experiments use the same reaction.
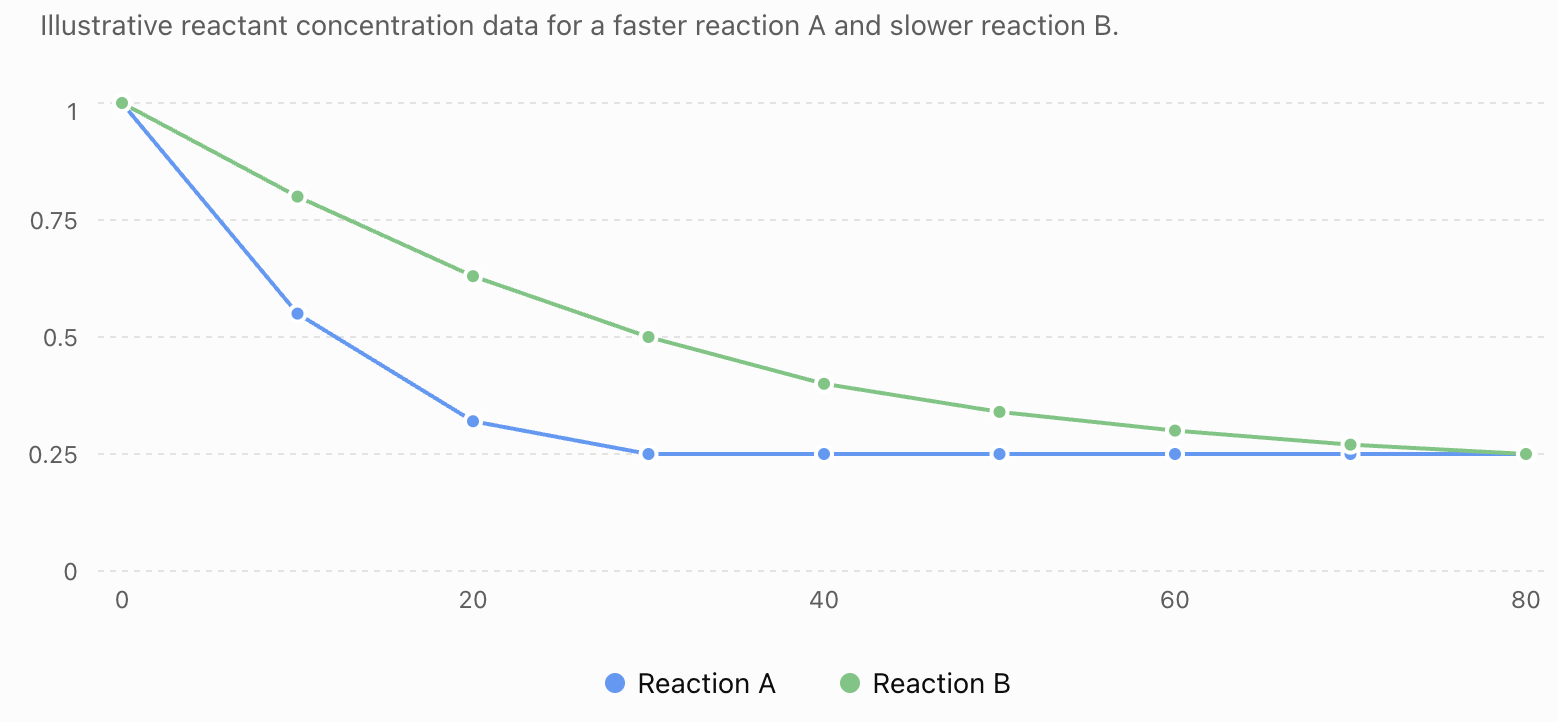
Reaction A has a much steeper initial curve than Reaction B.
We can conclude:
Reaction A initially has the greater rate
because its concentration changes more quickly.
Comparing Two Reactions
Consider these illustrative results:
| Time (s) | Reactant A (mol/L) | Reactant B (mol/L) |
|---|---|---|
| 0 | 1.00 | 1.00 |
| 10 | 0.55 | 0.80 |
| 20 | 0.32 | 0.63 |
| 30 | 0.25 | 0.50 |
| 40 | 0.25 | 0.40 |
| 50 | 0.25 | 0.34 |
| 60 | 0.25 | 0.30 |
| 70 | 0.25 | 0.27 |
| 80 | 0.25 | 0.25 |


2. Product Formation Graphs
Learning outcomes
- I can interpret graphs showing product formation over time.
- I can explain how product concentration changes during reactions.
- I can compare reaction rates using product graphs.
- I can identify completion points on graphs.
- I can relate graph features to reaction progress.


What Is a Product Formation Graph?
As a chemical reaction occurs:
reactants are consumed
and:
products are formed
A product formation graph shows how the amount or concentration of a product changes as time passes.
The graph can help us determine:
- how much product has formed
- how quickly product is being produced
- how the reaction rate changes
- when the reaction stops producing additional product
- how different reaction conditions affect reaction rate
These graphs are closely related to concentration-time graphs, but instead of focusing on disappearing reactants, we focus on:
appearing products
Understanding the Axes
A typical product formation graph has:
x-axis → time
y-axis → amount or concentration of product
The y-axis might show:
- concentration in mol/L
- mass in grams
- volume of gas in cm³
- amount in moles
Always read the:
axis label + units
before interpreting the graph.
Product Concentration Increases
At the beginning of many reactions, there may be:
little or no product
As reactant particles react:
product particles are formed
Therefore:
product concentration increases with time
A typical pattern is:
rapid increase → slower increase → plateau
A Typical Product Formation Graph
Consider these illustrative data:
| Time (s) | Product Concentration (mol/L) |
|---|---|
| 0 | 0.00 |
| 10 | 0.32 |
| 20 | 0.52 |
| 30 | 0.64 |
| 40 | 0.70 |
| 50 | 0.72 |
| 60 | 0.72 |
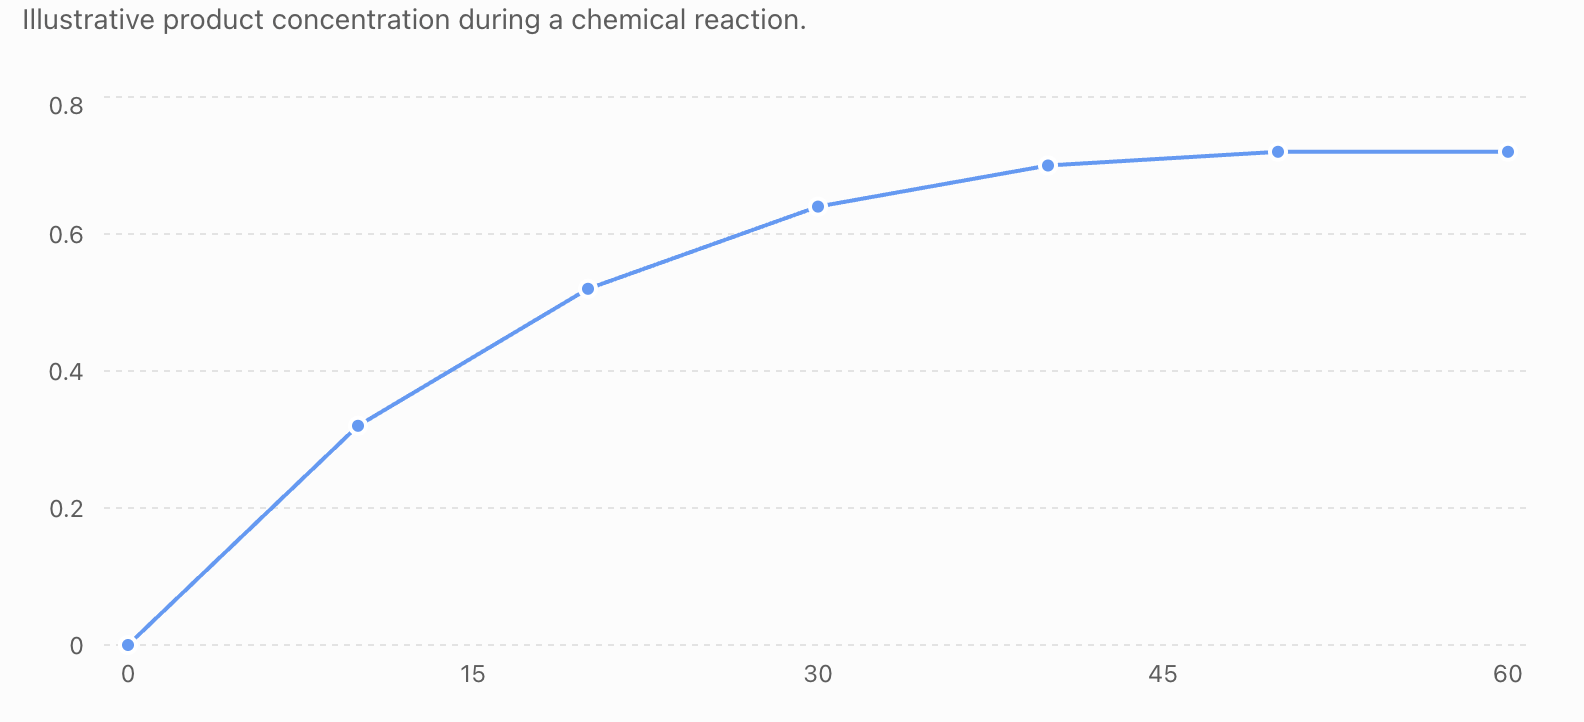
Notice that the graph:
- rises rapidly at first
- gradually becomes less steep
- eventually becomes horizontal
Each feature tells us something about:
reaction progress
Why Does the Graph Rise?
Products are created when reactant particles undergo successful:
chemical reactions
At the beginning:
product amount is low
As time passes:
more product is formed
Therefore, the curve moves:
upward
For a product formation graph:
upward curve = increasing amount of product
Reactants and Products
Consider a simple reaction:
A → B
A is the:
reactant
B is the:
product
As the reaction proceeds:
A decreases
while:
B increases
Therefore, their concentration-time graphs have opposite general directions.
Comparing Reactant and Product Graphs
| Reactant Graph | Product Graph |
|---|---|
| Usually starts high | Usually starts low |
| Decreases | Increases |
| Negative gradient | Positive gradient |
| Becomes less steep | Becomes less steep |
| Eventually may become horizontal | Eventually may become horizontal |
Both graphs describe:
the same reaction progress
from different perspectives.
Reactant and Product Together
For the simple illustrative reaction:
A → B
we might observe:
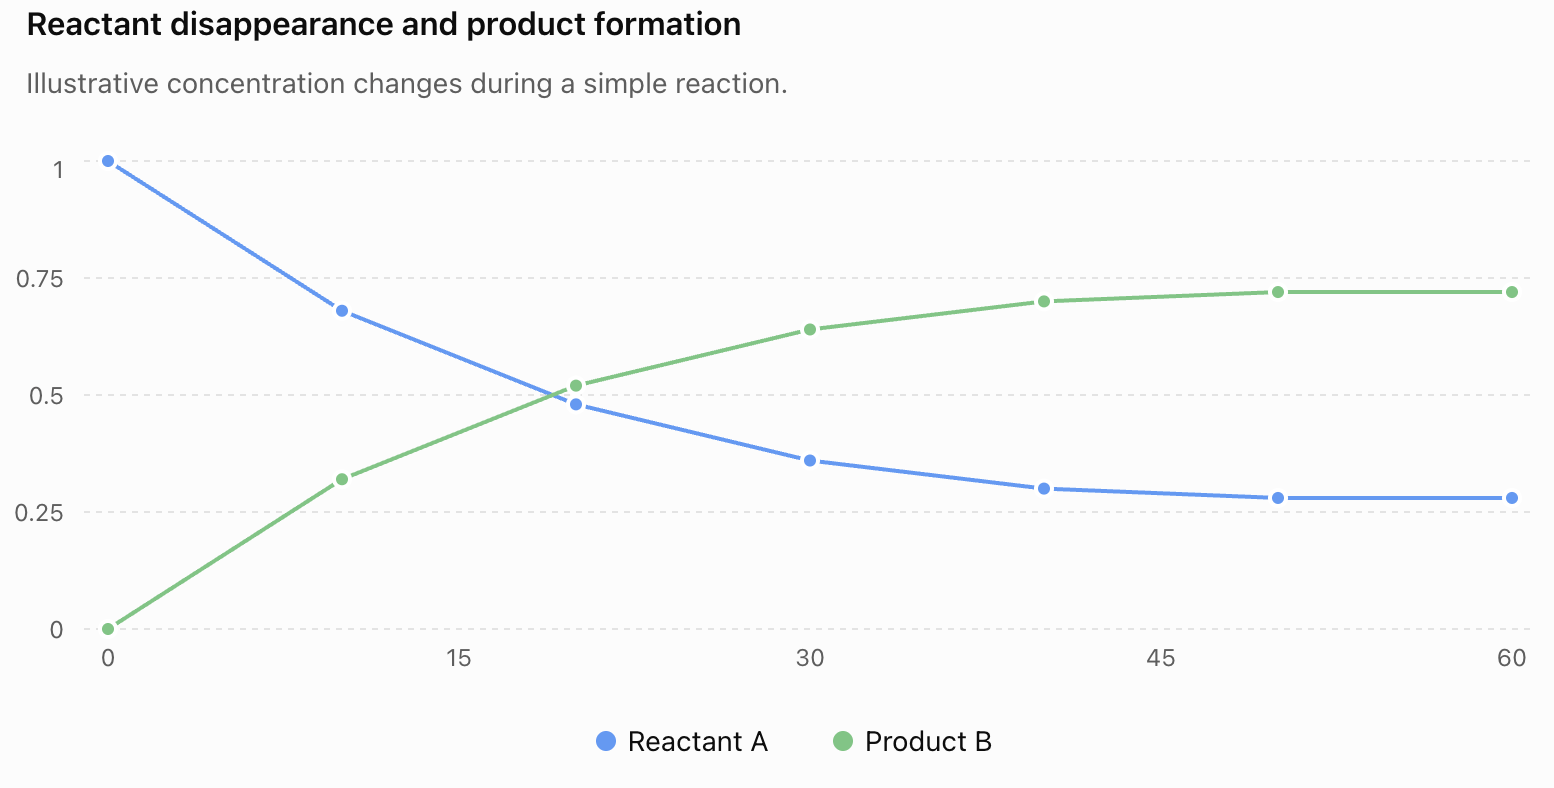
As reactant disappears:
product appears
This is one of the central ideas represented by reaction-progress graphs.
Reading a Product Graph
Suppose you are asked:
How much product has formed after 20 seconds?
Use the graph:
- Find 20 s on the x-axis.
- Move vertically to the curve.
- Move horizontally toward the y-axis.
- Read the value.
From our example:
product concentration = 0.52 mol/L
Always include the:
correct units
Product Formation and Reaction Rate
The shape of the graph also tells us about:
reaction rate
Reaction rate can be measured by how quickly product forms.
For a product:
average rate of formation = increase in product concentration ÷ time interval
or:
average rate = Δconcentration / Δtime
Gradient Represents Rate
The gradient of a product formation graph indicates how quickly product is being formed.
A:
steep positive gradient
means product is forming rapidly.
A:
shallow positive gradient
means product is forming more slowly.
A:
horizontal gradient
means there is no further net increase in product.
Therefore:
steeper graph = faster product formation
The Beginning of the Reaction
Product formation graphs are often steepest near:
the beginning
Why?
At the start:
- reactant concentrations are high
- many reactant particles are available
- collisions are relatively frequent
- successful collisions occur frequently
Therefore:
product forms quickly
The graph rises steeply.
Collision Theory
Reaction rate can be explained using:
collision theory
For particles to react, they must collide:
- with sufficient energy
- in a suitable orientation
Near the beginning of many reactions:
more reactant particles → more frequent collisions → more successful collisions → faster product formation
This produces:
a steep initial curve
Why Does the Curve Become Less Steep?
As the reaction continues:
reactants are consumed
Their concentrations decrease.
Therefore:
successful collisions become less frequent
Product continues to form, but:
more slowly
The graph becomes:
less steep


Reaction Progress and Graph Shape
We can divide a typical product graph into three stages.
Early stage
Graph is:
steep
Product is forming rapidly.
Middle stage
Graph becomes:
less steep
Product is still forming, but more slowly.
Final stage
Graph becomes:
horizontal
There is no further net increase in product.
So:
steep → fast
shallow → slower
flat → no further net product formation
Calculating Average Rate of Product Formation
Suppose product concentration increases from:
0.20 mol/L
to:
0.50 mol/L
during:
15 seconds
Change in concentration:
0.50 − 0.20 = 0.30 mol/L
Average rate:
0.30 ÷ 15
= 0.020 mol/L/s
Therefore:
average rate of product formation = 0.020 mol L⁻¹ s⁻¹
Another Example
At 10 seconds:
product concentration = 0.25 mol/L
At 30 seconds:
product concentration = 0.65 mol/L
Change in concentration:
0.65 − 0.25 = 0.40 mol/L
Change in time:
30 − 10 = 20 s
Average rate:
0.40 ÷ 20
= 0.020 mol/L/s
Positive Gradient
A product formation graph normally has a:
positive gradient
because:
product concentration increases as time increases
Mathematically:
Δproduct concentration > 0
Therefore:
gradient > 0
This contrasts with the concentration graph for a reactant, which normally has a:
negative gradient
Instantaneous Rate
The reaction rate may change continuously.
To estimate the rate at one particular moment, we can use:
a tangent
A tangent is drawn so that it touches the curve at the point being investigated.
The gradient of that tangent gives an estimate of:
instantaneous rate
Tangents on Product Graphs


A tangent near the beginning is usually:
steeper
A tangent later in the reaction is usually:
shallower
This provides mathematical evidence that:
the reaction rate decreases with time
When Is the Reaction Complete?
For a simple irreversible reaction, the reaction has effectively reached completion when:
no additional product is being formed
On a product formation graph, this is shown when the curve becomes:
horizontal
The product amount has reached a:
plateau
What Is a Plateau?
A plateau is a region of a graph where the y-value remains approximately constant.
For a product formation graph:
plateau = product concentration no longer increasing
The gradient is approximately:
zero
For a simple irreversible reaction, this generally indicates that the reaction has:
finished producing additional product
Finding the Completion Time
Suppose a graph rises until approximately:
50 seconds
and then remains horizontal.
We can say:
The reaction reaches its final product concentration at approximately 50 s.
Do not look for the very last point plotted.
Instead, look for:
where the graph first becomes essentially horizontal
Final Product Amount
The height of the plateau tells us:
the final amount or concentration of product
For example:
If the curve levels off at:
0.72 mol/L
then the final product concentration is:
0.72 mol/L
Therefore, the graph tells us two different things:
horizontal position of plateau → approximate completion time
vertical height of plateau → final product concentration
Comparing Two Reactions
Product formation graphs can be used to compare reactions under different conditions.
Suppose we have:
Reaction A
and:
Reaction B
If Reaction A rises more steeply than Reaction B:
Reaction A has the greater rate of product formation during that interval
If both eventually reach the same plateau:
they form the same final concentration of product
but at different rates.
Faster and Slower Reactions
Consider these illustrative data:
| Time (s) | Reaction A Product (mol/L) | Reaction B Product (mol/L) |
|---|---|---|
| 0 | 0.00 | 0.00 |
| 10 | 0.45 | 0.20 |
| 20 | 0.66 | 0.37 |
| 30 | 0.75 | 0.51 |
| 40 | 0.75 | 0.61 |
| 50 | 0.75 | 0.68 |
| 60 | 0.75 | 0.72 |
| 70 | 0.75 | 0.75 |
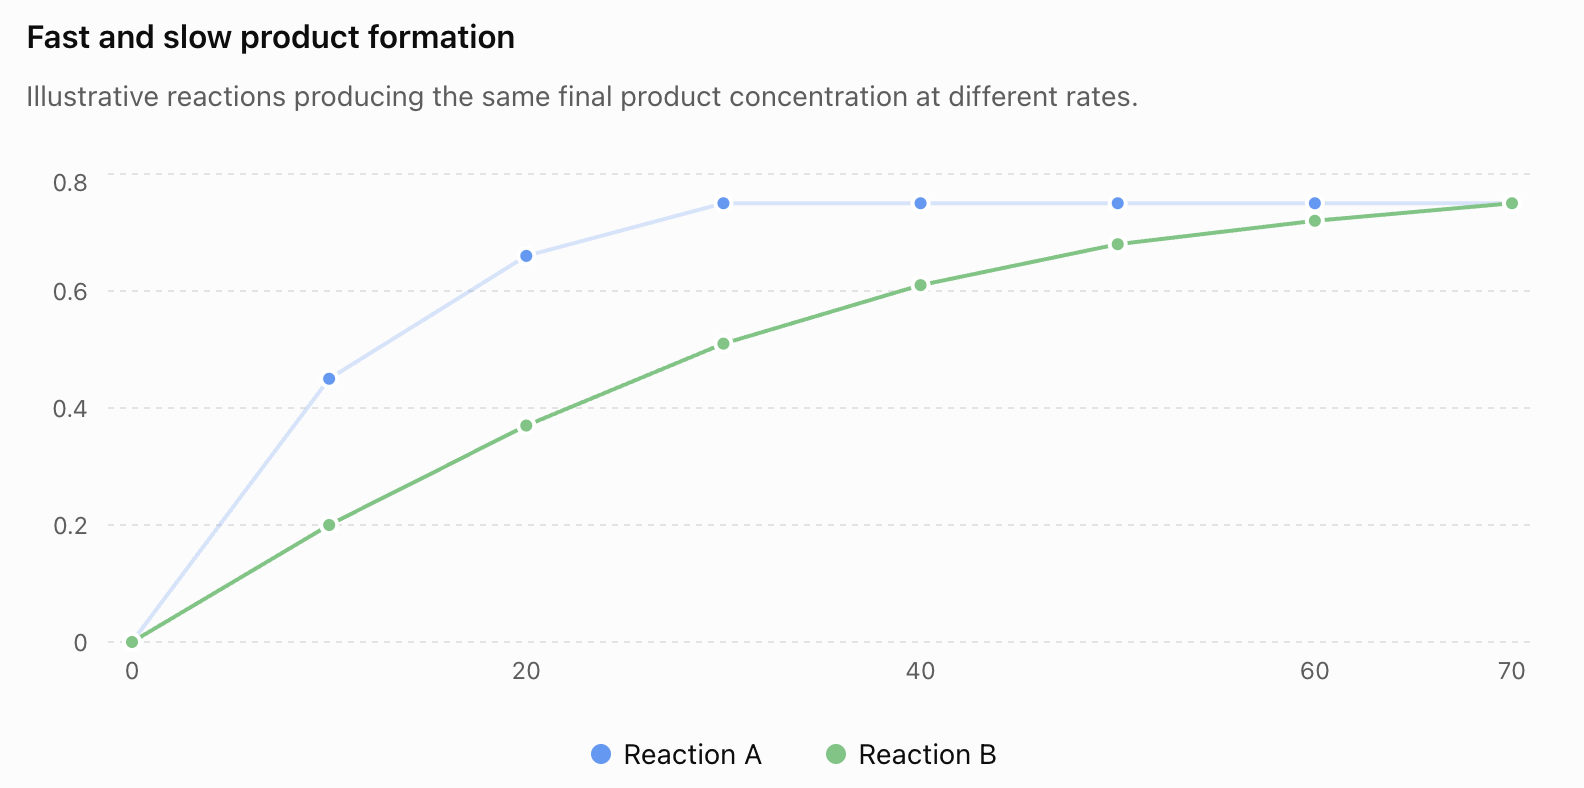
Reaction A:
- has the steeper initial curve
- forms product more quickly
- reaches the plateau sooner
Reaction B:
- has a shallower curve
- forms product more slowly
- takes longer to reach the same plateau
Same Product, Different Rate
This comparison illustrates an extremely important idea:
rate and yield are not the same thing
Both reactions eventually produce:
0.75 mol/L
But Reaction A gets there:
faster
Therefore:
Reaction A has the greater rate
but:
both have the same final product concentration
Faster Does Not Mean More
Students sometimes assume:
faster reaction = more product
That is not necessarily true.
Two reactions can produce exactly the same final amount of product.
One simply reaches that amount:
more quickly
So always distinguish between:
rate → how quickly
and:
final amount → how much
Different Plateau Heights
Now suppose:
Reaction A plateaus at 0.80 mol/L
while:
Reaction B plateaus at 0.50 mol/L
Then Reaction A has produced a:
greater final concentration of product
However, this alone does not tell us why.
Possible explanations could include differences in:
- starting quantities
- limiting reactants
- reaction conditions
- equilibrium position
The graph shows:
what happened
Additional information may be needed to explain:
why
Comparing Initial Rates
To compare the initial rates, examine the curves close to:
t = 0
The reaction with the:
steeper initial gradient
has the greater initial rate of product formation.
This is more useful than simply asking:
which curve is higher?
Rate depends on:
slope
not just height.
Effect of Temperature
Higher temperature usually increases reaction rate.
Particles have greater:
kinetic energy
This produces:
- more frequent collisions
- more energetic collisions
- a greater proportion of collisions exceeding activation energy
Therefore, a higher-temperature product graph will often:
rise more steeply
and reach its final plateau:
sooner
Temperature Comparison
If two reactions use identical quantities but different temperatures:
higher temperature → steeper initial slope → faster product formation
If temperature changes only the rate and not the overall reaction outcome:
both curves reach the same final plateau


Effect of a Catalyst
A catalyst increases reaction rate by providing an alternative pathway with:
lower activation energy
Therefore:
with catalyst → steeper curve
without catalyst → shallower curve
If both experiments begin with the same reactant quantities and proceed to the same completion:
both produce the same final amount
The catalyst changes:
how quickly product forms
not the stoichiometric amount available from the starting reactants.
Effect of Concentration
Increasing reactant concentration means there are:
more reactant particles per unit volume
This can produce:
more frequent successful collisions
and therefore:
faster product formation
The graph may initially rise:
more steeply
However, if the starting quantities themselves differ, the final product amounts may also differ.
Always check the experimental conditions.
Effect of Surface Area
When a solid reacts, increasing its surface area can increase reaction rate.
For example:
powdered solid
has more exposed surface than the same mass in:
large chunks
More exposed particles are available for collisions.
Therefore:
greater surface area → faster reaction → steeper product formation curve
Gas Production Graphs
Some reactions produce a:
gas
Instead of measuring concentration, scientists may measure the:
volume of gas produced
For example:
acid + carbonate → salt + water + carbon dioxide
The graph may show:
volume of CO₂ (cm³) vs time


The interpretation is almost identical to a product concentration graph.
Gas Volume Over Time
Suppose carbon dioxide production gives:
| Time (s) | CO₂ Volume (cm³) |
|---|---|
| 0 | 0 |
| 10 | 28 |
| 20 | 44 |
| 30 | 53 |
| 40 | 57 |
| 50 | 58 |
| 60 | 58 |
The graph would:
rise rapidly
then:
rise more slowly
and finally:
plateau at 58 cm³
Therefore:
final gas volume = 58 cm³
and the reaction reaches its final gas volume at approximately:
50 seconds
Measuring Gas Formation
Gas-producing reactions can be investigated using equipment such as a:
gas syringe


As gas forms:
gas volume increases
Measurements can be recorded at regular time intervals.
These data can then be plotted as:
gas volume vs time
This creates a product formation graph.
Mass-Loss Graphs
Some gas-producing reactions can also be followed by measuring:
mass
If gas escapes from an open reaction vessel:
total measured mass decreases
This produces a graph that slopes:
downward
even though a product is being formed.
Why?
Because the gaseous product:
leaves the apparatus
Therefore, always identify:
what the y-axis actually measures
before interpreting graph direction.
The Axis Determines the Meaning
Consider these three graphs for the same gas-producing reaction:
product concentration vs time → increases
gas volume vs time → increases
mass of reaction vessel vs time → decreases
All three can describe:
the same reaction
The direction of the graph depends on:
what is being measured
Reaction Progress
Product formation graphs provide a visual record of:
reaction progress
At the beginning:
very little product has formed
During the reaction:
product accumulates
Near the end:
product forms more slowly
At the final plateau:
no further net product accumulation occurs
The graph therefore summarizes the entire reaction in:
one curve
Percentage of Reaction Progress
If the final product amount is known, we can estimate how far the reaction has progressed.
Suppose:
final product = 80 cm³
At a certain time:
product formed = 40 cm³
Then:
40 / 80 × 100 = 50%
Approximately:
50% of the final product amount has formed
This can help compare how rapidly different reactions approach their final state.
Halfway Point
The time required to produce half the final amount can also be useful.
If the final product amount is:
60 cm³
half is:
30 cm³
Find 30 cm³ on the y-axis and determine the corresponding:
time
A faster reaction reaches the halfway point:
sooner
Reaction A vs Reaction B
Suppose both reactions produce a final gas volume of:
60 cm³
Reaction A reaches 30 cm³ in:
12 seconds
Reaction B reaches 30 cm³ in:
28 seconds
Reaction A therefore reaches half the final product amount:
more quickly
This is another way to compare reaction progress.
Graph Shape and Particle Behaviour
The macroscopic graph can be explained by microscopic particle behaviour.
Beginning
Many reactant particles are available.
Frequent successful collisions
↓
rapid product formation
↓
steep graph
Later
Fewer reactant particles remain.
Fewer successful collisions
↓
slower product formation
↓
shallower graph
Final stage
No further net product accumulation.
↓
horizontal graph
From Particles to Graphs
This connection is important:
particle behaviour → reaction rate → graph shape
A graph is not simply a mathematical picture.
Its shape represents what is happening among:
reacting particles
at the microscopic level.
A Useful Interpretation Method
For product formation graphs, use:
S-R-P
S — Slope
How steep is the curve?
This tells you about:
reaction rate
R — Rise
How much does the graph increase?
This tells you how much:
product has formed
P — Plateau
Where does the curve become horizontal?
This tells you:
the final product amount and when net product formation stops
Describing a Product Graph
Avoid:
"The graph goes up and then becomes flat."
Instead write:
"The amount of product increases rapidly at first, then increases more slowly before reaching a constant final value."
An even stronger answer:
"The steep initial gradient shows rapid product formation. As reactants are consumed, the reaction rate decreases, so the gradient becomes smaller. Eventually the graph reaches a plateau, indicating no further net product formation."
Using Numerical Evidence
Strong graph descriptions should include numbers when available.
Instead of:
"Product increases quickly."
write:
"Product concentration increases from 0.00 mol/L to 0.52 mol/L during the first 20 seconds."
Instead of:
"The reaction eventually finishes."
write:
"The graph becomes horizontal at approximately 50 s, with a final product concentration of about 0.72 mol/L."
Numerical evidence makes scientific explanations:
more precise
Worked Example 1
A reaction produces the following gas volumes:
| Time (s) | Gas Volume (cm³) |
|---|---|
| 0 | 0 |
| 10 | 24 |
| 20 | 39 |
| 30 | 47 |
| 40 | 51 |
| 50 | 52 |
| 60 | 52 |
Describe the graph.
The gas volume increases rapidly at first, then increases more slowly. It reaches a constant volume of:
52 cm³
at approximately:
50 seconds
Worked Example 2
Using the previous data, calculate the average rate of gas formation during the first 20 seconds.
Change in gas volume:
39 − 0 = 39 cm³
Change in time:
20 − 0 = 20 s
Average rate:
39 ÷ 20 = 1.95 cm³/s
Therefore:
average rate = 1.95 cm³/s
Worked Example 3
During the interval from 30 s to 50 s:
Gas volume increases from:
47 cm³ to 52 cm³
Change:
52 − 47 = 5 cm³
Time interval:
50 − 30 = 20 s
Average rate:
5 ÷ 20 = 0.25 cm³/s
Compare this with the first 20 seconds:
first 20 s = 1.95 cm³/s
30–50 s = 0.25 cm³/s
Therefore, the reaction has:
slowed considerably
Worked Example 4
Reaction A and Reaction B both eventually produce:
80 cm³ of gas
Reaction A reaches 80 cm³ in:
40 seconds
Reaction B reaches 80 cm³ in:
90 seconds
What can we conclude?
Both produce the:
same final amount of gas
but Reaction A produces it:
more rapidly
Therefore:
Reaction A has a greater overall rate of product formation.
Worked Example 5
Reaction X reaches a plateau at:
70 cm³
Reaction Y reaches a plateau at:
45 cm³
What can we conclude?
Reaction X produces:
25 cm³ more final gas
because:
70 − 45 = 25 cm³
However, we cannot determine why from the graph alone.
We would need information about:
- reactant quantities
- concentrations
- limiting reactants
- reaction conditions
Completion vs Equilibrium
A horizontal product graph does not always mean the chemical reaction has completely stopped.
For a simple irreversible reaction, a plateau often indicates:
effective completion
For a reversible reaction at equilibrium:
forward and reverse reactions continue
but:
product concentration remains constant
because the forward and reverse rates are equal.
Therefore:
flat graph = no net concentration change
not necessarily:
no molecular reactions occurring
Common Misconception: The Highest Curve Is Always Fastest
A curve being higher does not automatically mean the reaction is faster.
Rate depends on:
gradient
For example, a curve could have a high product concentration but be completely horizontal.
At that moment:
rate of net product formation = zero
Always examine:
slope, not simply height
Common Misconception: The Plateau Is the Reaction Rate
The plateau height represents:
final product amount or concentration
It does not represent:
reaction rate
Rate is determined by:
gradient
So remember:
slope → rate
height → amount
Common Misconception: A Flat Graph Means No Product
A horizontal graph means:
product amount is constant
The product concentration may actually be:
very high
For example, a horizontal line at 0.80 mol/L means:
0.80 mol/L of product remains present
It simply is not increasing further.
Common Misconception: A Catalyst Produces More Product
For a reaction that proceeds to the same completion:
catalyst → faster reaction
but not:
more final product
The catalyzed curve reaches the same plateau:
sooner
This distinction is frequently tested.
Common Misconception: Reaction Rate Is Constant
A curved product formation graph has a changing:
gradient
Therefore:
reaction rate changes
If the graph becomes progressively shallower:
reaction rate is decreasing
Common Misconception: Product Graphs Must Always Show Concentration
Product formation can be measured using several quantities.
A graph may show:
- concentration
- mass
- volume
- moles
- pressure in some experimental systems
Always examine:
what is actually being measured
Check Your Understanding
1. What does an upward-sloping product formation graph indicate?
2. Why is a product formation graph often steepest near the beginning of a reaction?
3. What does the gradient of a product formation graph represent?
4. Explain why the graph usually becomes less steep as the reaction proceeds.
5. What does a plateau represent on a simple product formation graph?
6. A product concentration increases from 0.20 mol/L to 0.60 mol/L in 20 s. Calculate the average rate of product formation.
7. Two reactions reach the same plateau, but one reaches it sooner. What does this tell you?
8. Two reactions have different plateau heights. What does this tell you about their final product amounts?
9. Explain why a catalyst can change the shape of a product formation graph without changing the final plateau in a reaction that proceeds to the same completion.
10. Explain how the changing gradient of a product formation graph can be explained using collision theory.
Key Terms
- Product: Substance formed during a chemical reaction.
- Product formation: Production of new substances as a chemical reaction proceeds.
- Concentration: Amount of a substance present per unit volume.
- Reaction rate: Measure of how quickly reactants are consumed or products are formed.
- Gradient: Slope of a graph representing rate of change.
- Average rate: Change in measured quantity divided by the corresponding time interval.
- Instantaneous rate: Reaction rate at a particular moment.
- Initial rate: Reaction rate at the beginning of a reaction.
- Tangent: Straight line used to estimate the gradient of a curve at one point.
- Plateau: Horizontal region where the measured quantity remains approximately constant.
- Reaction progress: Extent to which reactants have been converted into products.
- Completion: Stage at which a simple irreversible reaction can no longer produce significant additional product.
- Final product amount: Quantity of product present when no further net product formation occurs.
- Collision theory: Explanation of reaction rates based on collisions between reacting particles.
- Successful collision: Collision with sufficient energy and suitable orientation to produce a reaction.
- Activation energy: Minimum energy required for a successful reaction-producing collision.
- Catalyst: Substance that increases reaction rate by providing an alternative pathway with lower activation energy.
- Dynamic equilibrium: State where forward and reverse reactions continue at equal rates, causing concentrations to remain constant.
Key Takeaways
- Product formation graphs show how the amount or concentration of a product changes over time.
- Product amount usually increases as a reaction proceeds.
- Product graphs often rise rapidly at first and then more slowly.
- The gradient of the graph represents the rate of product formation.
- Steeper gradient = faster product formation.
- Shallower gradient = slower product formation.
- Horizontal graph = no further net product accumulation.
- Product formation is often fastest near the beginning because reactant concentrations are highest.
- As reactants are consumed, successful collisions generally become less frequent and reaction rate decreases.
- Average rate can be calculated using change in product amount ÷ change in time.
- Tangents can be used to estimate instantaneous rates.
- The plateau height represents the final measured amount or concentration of product.
- The time at which the plateau begins can indicate when a simple irreversible reaction effectively reaches completion.
- Two reactions can produce the same final amount at different rates.
- A faster reaction does not necessarily produce more product.
- Slope tells us how fast; plateau height tells us how much.
- Temperature, concentration, catalysts, and surface area can affect reaction rate and therefore graph shape.
- A catalyst can make the curve steeper and cause the plateau to be reached sooner without changing the final amount for a reaction that proceeds to the same completion.
- Product formation may be monitored using concentration, gas volume, mass, moles, or other suitable measurements.
- Always read the axes before interpreting a reaction graph.
- Graph features can be connected to particle behaviour using collision theory.
- For product graphs, a useful interpretation strategy is Slope → Rise → Plateau.
- A useful overall relationship is reactant particles → successful collisions → product formation → changing graph gradient → final plateau.
3. Determining Rate from Graphs
Learning outcomes
- I can calculate average rates from graphs.
- I can determine gradients from reaction graphs.
- I can estimate instantaneous rates from tangents.
- I can compare rates at different times during a reaction.
- I can interpret graphical evidence to describe reaction behavior.

Reaction Graphs Tell Us More Than What Happened
Reaction graphs do more than show how the amount of a substance changes.
They can also tell us:
how quickly the change is happening
This is the:
reaction rate
The key mathematical idea is:
gradient
A steep graph represents a rapid change.
A shallow graph represents a slower change.
A horizontal graph represents:
no net change
By calculating gradients, we can turn the shape of a graph into a numerical measurement of reaction rate.
The Basic Rate Equation
Reaction rate compares:
change in a measured quantity
with:
change in time
The general relationship is:
average rate = change in quantity ÷ change in time
This can also be written as:
Average rate = Δy / Δt
where:
- Δy = change in the quantity shown on the y-axis
- Δt = change in time
- Δ means "change in"
The quantity might be:
- concentration
- mass
- gas volume
- amount of substance
What Is Gradient?
The gradient of a graph tells us how quickly the y-value changes compared with the x-value.
For reaction graphs:
gradient = change in measured quantity / change in time
or:
gradient = Δy / Δx
Because time is normally on the x-axis:
gradient = Δy / Δt
This makes gradient extremely useful for measuring:
reaction rate
Rise Over Run
Another way to remember gradient is:
gradient = rise / run
where:
rise = vertical change
and:
run = horizontal change


For a reaction graph:
vertical change = change in concentration, mass, or volume
horizontal change = change in time
Average Rate
An average rate describes how quickly something changes over a:
time interval
Suppose a reaction produces:
60 cm³ of gas
during:
30 seconds
Average rate:
60 cm³ ÷ 30 s
= 2.0 cm³/s
Therefore:
average rate = 2.0 cm³/s
Finding Average Rate from a Graph
Consider this illustrative product-formation data:
| Time (s) | Gas Volume (cm³) |
|---|---|
| 0 | 0 |
| 10 | 28 |
| 20 | 46 |
| 30 | 57 |
| 40 | 63 |
| 50 | 66 |
| 60 | 66 |
The graph would rise rapidly at first and gradually become horizontal.
To calculate the average rate between:
10 s and 30 s
read the corresponding values:
At 10 s:
28 cm³
At 30 s:
57 cm³
Step 1: Calculate the Change in Product
Δvolume = final volume − initial volume
Δvolume = 57 − 28
Δvolume = 29 cm³
Step 2: Calculate the Change in Time
Δtime = final time − initial time
Δtime = 30 − 10
Δtime = 20 s
Step 3: Calculate the Average Rate
average rate = 29 / 20
average rate = 1.45 cm³/s
Therefore:
Average rate from 10–30 s = 1.45 cm³/s
A Common Calculation Error
Suppose we want the average rate between:
20 s and 50 s
Do not divide the product amount at 50 s by 50.
Instead, calculate the:
change between the two selected points
At 20 s:
46 cm³
At 50 s:
66 cm³
Change in product:
66 − 46 = 20 cm³
Change in time:
50 − 20 = 30 s
Therefore:
average rate = 20 / 30
= 0.67 cm³/s
approximately.
The rule is:
always calculate change in y and change in x
Units of Reaction Rate
Rate units depend on:
what the graph measures
If the graph shows:
gas volume in cm³
and:
time in seconds
then rate units are:
cm³/s
If the graph shows:
concentration in mol/L
then:
mol L⁻¹ s⁻¹
If the graph shows:
mass in grams
then:
g/s
Always derive rate units from:
y-axis unit ÷ x-axis unit
Positive Gradients
A product formation graph usually rises.
For example:
gas volume increases with time
Therefore:
Δy is positive
and:
gradient is positive
A positive gradient means the measured quantity is:
increasing
For a product graph, this usually represents:
product formation
Negative Gradients
A reactant concentration usually:
decreases
as the reaction proceeds.
Therefore, its graph may slope downward.
For example:
At 10 s:
[A] = 0.80 mol/L
At 30 s:
[A] = 0.50 mol/L
Gradient:
(0.50 − 0.80) / (30 − 10)
= −0.30 / 20
= −0.015 mol L⁻¹ s⁻¹
The negative sign tells us:
reactant concentration is decreasing
Rate of Disappearance
Although a reactant concentration graph has a negative gradient, we often report its:
rate of disappearance
as a positive magnitude.
So if:
gradient = −0.015 mol L⁻¹ s⁻¹
we may say:
rate of disappearance = 0.015 mol L⁻¹ s⁻¹
The negative gradient describes:
direction of change
The positive magnitude describes:
how quickly the reactant disappears
Straight-Line Graphs
If a reaction graph is a straight line, its gradient is:
constant
This means the measured quantity changes at a:
constant rate
For example:
0 s → 0 cm³
10 s → 20 cm³
20 s → 40 cm³
30 s → 60 cm³
Every 10 seconds:
20 cm³ more product forms
Therefore:
rate = 20 / 10 = 2 cm³/s
throughout that interval.
Curved Reaction Graphs
Most reaction graphs are not perfectly straight.
They are:
curved

A curved graph means:
the gradient is changing
Therefore:
the reaction rate is changing
This is why we need to distinguish between:
average rate
and:
instantaneous rate
Average Rate vs Instantaneous Rate
Average Rate
Measures the rate over:
a time interval
For example:
average rate between 10 s and 30 s
Instantaneous Rate
Measures the rate at:
one particular moment
For example:
rate at exactly 20 s
These are different quantities.
Why Do We Need Instantaneous Rate?
Imagine driving a car.
Your average speed during a one-hour journey might be:
60 km/h
But at one particular moment, your speedometer might show:
85 km/h
Reaction rates work similarly.
An average rate tells us about:
an interval
An instantaneous rate tells us about:
one moment
Finding Instantaneous Rate
For a curved graph, we cannot simply use the gradient of the entire curve.
Instead, we draw:
a tangent
at the point we want to investigate.
A tangent is a straight line that touches the curve at that point and follows its direction there.
The gradient of the tangent estimates:
the instantaneous rate

How to Draw a Tangent
Suppose you want to find the reaction rate at:
30 seconds
Step 1
Find:
30 s
on the x-axis.
Step 2
Find the corresponding point on the reaction curve.
Step 3
Draw a straight line that:
just touches the curve at that point
and follows the direction of the curve.
Step 4
Extend the tangent so that you can select:
two widely separated points
on the tangent.
Step 5
Calculate:
gradient = Δy / Δt
The result estimates the:
instantaneous rate at 30 s
Use Points on the Tangent
This is extremely important.
When calculating instantaneous rate:
use points on the tangent
not necessarily points on the original curve.
The tangent is a:
straight line
so its gradient can be calculated accurately.
Use a Large Triangle
When finding the gradient of a tangent, choose points that are:
far apart
on the tangent.
Why?
A larger gradient triangle generally reduces the effect of:
small reading errors
So instead of choosing two points very close together:
use as much of the tangent as practical
Worked Example: Instantaneous Rate
Suppose a tangent drawn at 20 s passes through:
(10 s, 25 cm³)
and:
(30 s, 55 cm³)
Change in product:
55 − 25 = 30 cm³
Change in time:
30 − 10 = 20 s
Gradient:
30 / 20
= 1.5 cm³/s
Therefore:
instantaneous rate at 20 s ≈ 1.5 cm³/s
The approximation symbol is useful because the tangent itself is:
an estimate
Comparing Rates at Different Times
A reaction often begins quickly and then slows.
Suppose the instantaneous rates are:
At 10 s:
2.8 cm³/s
At 30 s:
1.4 cm³/s
At 50 s:
0.3 cm³/s
We can conclude:
reaction rate decreases with time
The graph becomes progressively:
less steep
Why Does Rate Decrease?
As the reaction proceeds:
reactants are consumed
Therefore:
reactant concentrations decrease
There are fewer reactant particles available for:
successful collisions
As a result:
successful collision frequency decreases
and:
reaction rate decreases
This produces the typical curved shape.
Connecting Gradient to Collision Theory
The relationship can be summarized:
high reactant concentration
↓
frequent successful collisions
↓
fast reaction
↓
steep graph
As the reaction proceeds:
lower reactant concentration
↓
fewer successful collisions
↓
slower reaction
↓
shallower graph
Comparing Early and Late Gradients
Consider a product graph.
Near the beginning:
large gradient
Later:
smaller gradient
Finally:
gradient ≈ 0
This corresponds to:
fast → slower → no further net product formation
The gradient therefore provides a mathematical description of:
reaction progress
The Gradient at Completion
When a product graph becomes horizontal:
Δy = 0
Therefore:
gradient = 0 / Δt
and:
gradient = 0
For a simple irreversible reaction, this means:
no additional product is being formed
The reaction has effectively:
reached completion
Reaction Graph Regions
A typical reaction graph can be interpreted in three regions.
Region 1 — Steep
large gradient
The reaction is:
fast
Region 2 — Curving
decreasing gradient
The reaction is:
slowing
Region 3 — Plateau
gradient ≈ 0
There is:
no further net change
Comparing Two Reactions
Suppose Reaction A and Reaction B are plotted on the same graph.
Reaction A has a steeper initial slope.
Reaction B has a shallower initial slope.
We can conclude:
Reaction A has a greater initial rate
provided the graphs show comparable measured quantities and scales.


Same Final Amount, Different Rates
Suppose both reactions eventually produce:
80 cm³ of gas
but:
Reaction A reaches 80 cm³ in 40 s
while:
Reaction B reaches 80 cm³ in 90 s
Reaction A is:
faster
but both produce:
the same final amount
This demonstrates:
gradient → rate
while:
plateau height → final amount
Different Rates at the Same Time
Suppose at 20 s:
Reaction A has a tangent gradient of:
2.0 cm³/s
Reaction B has a tangent gradient of:
1.1 cm³/s
Therefore, at 20 s:
Reaction A is producing gas more rapidly
This is a comparison of:
instantaneous rates
Different Rates Within the Same Reaction
We can also compare the reaction with:
itself
at different times.
For example:
At 10 s:
rate = 3.0 cm³/s
At 30 s:
rate = 1.5 cm³/s
At 50 s:
rate = 0.4 cm³/s
This tells us:
the reaction is slowing down
Percentage Decrease in Rate
Sometimes we can quantify how much the rate changes.
Suppose:
Initial rate:
2.0 cm³/s
Later rate:
0.5 cm³/s
Decrease:
2.0 − 0.5 = 1.5 cm³/s
Percentage decrease:
1.5 / 2.0 × 100
= 75%
The rate has decreased by:
75%
Product Graphs
For a product formation graph:
positive gradient → product forming
large positive gradient → rapid product formation
small positive gradient → slow product formation
zero gradient → no further net product formation
The gradient generally decreases as the reaction progresses.
Reactant Graphs
For a reactant concentration graph:
negative gradient → reactant being consumed
steep negative gradient → rapid reactant consumption
shallow negative gradient → slower consumption
zero gradient → concentration no longer changing


Mass-Loss Graphs
Some reactions release gas.
If the gas escapes from the reaction vessel:
measured mass decreases
For example:
acid + carbonate → salt + water + carbon dioxide
As CO₂ escapes:
mass decreases
The graph therefore slopes:
downward
The magnitude of the gradient tells us:
how quickly mass is being lost
Gas Volume Graphs
If the gas is collected instead:
gas volume increases
The graph slopes:
upward
Even though one graph decreases and the other increases, both can measure the rate of:
the same reaction
This is why you must always read:
the axes
before interpreting the graph.
Units from Different Graphs
| Graph | Typical Rate Unit |
|---|---|
| Gas volume vs time | cm³/s |
| Mass vs time | g/s |
| Concentration vs time | mol L⁻¹ s⁻¹ |
| Amount vs time | mol/s |
The units come directly from:
y-axis units ÷ x-axis units
Graph Scale Matters
Two graphs can look very different simply because they use:
different axis scales
A visually steeper curve does not automatically mean a faster reaction if the graphs use different scales.
For reliable comparisons:
- check the x-axis scale
- check the y-axis scale
- check the units
- calculate gradients when necessary
Never compare graph steepness without first checking:
the axes
Worked Example 1: Average Rate
A gas-producing reaction gives:
| Time (s) | Gas Volume (cm³) |
|---|---|
| 0 | 0 |
| 20 | 40 |
| 40 | 64 |
| 60 | 76 |
| 80 | 80 |
Calculate the average rate from:
20 s to 60 s
Change in volume:
76 − 40 = 36 cm³
Change in time:
60 − 20 = 40 s
Rate:
36 / 40
= 0.90 cm³/s
Worked Example 2: Overall Average Rate
Using the same data, calculate the average rate from:
0 to 80 s
Change in volume:
80 − 0 = 80 cm³
Change in time:
80 − 0 = 80 s
Average rate:
80 / 80
= 1.0 cm³/s
Notice that this does not mean the reaction rate was:
1.0 cm³/s at every moment
It is only the:
average over the entire interval
Worked Example 3: Reactant Concentration
A reactant concentration decreases from:
1.20 mol/L
at 10 s to:
0.60 mol/L
at 40 s.
Gradient:
(0.60 − 1.20) / (40 − 10)
= −0.60 / 30
= −0.020 mol L⁻¹ s⁻¹
Therefore:
gradient = −0.020 mol L⁻¹ s⁻¹
and the average rate of disappearance is:
0.020 mol L⁻¹ s⁻¹
Worked Example 4: Tangent
A tangent drawn at 25 s passes through:
(10 s, 18 cm³)
and:
(40 s, 60 cm³)
Change in volume:
60 − 18 = 42 cm³
Change in time:
40 − 10 = 30 s
Gradient:
42 / 30
= 1.4 cm³/s
Therefore:
instantaneous rate at 25 s ≈ 1.4 cm³/s
Worked Example 5: Comparing Rates
Reaction A has an initial gradient of:
2.4 cm³/s
Reaction B has an initial gradient of:
1.6 cm³/s
Difference:
2.4 − 1.6 = 0.8 cm³/s
Therefore, Reaction A initially produces product:
0.8 cm³/s faster
than Reaction B.
Worked Example 6: Rate at Completion
A product graph becomes horizontal after:
70 seconds
What is the gradient after 70 seconds?
Because the product amount remains constant:
Δy = 0
Therefore:
gradient = 0
For a simple irreversible reaction:
no further product is being formed
Experimental Data and Scatter
Real experimental results rarely produce perfectly smooth curves.
Data may contain:
scatter


Small variations may occur because of:
- measurement uncertainty
- timing uncertainty
- temperature fluctuations
- reading errors
- limitations of equipment
Scientists therefore often draw:
a smooth curve of best fit
rather than connecting every data point with straight lines.
Tangents and Experimental Data
When using experimental data:
- Draw an appropriate curve of best fit.
- Identify the required time.
- Draw a tangent to the curve.
- Choose two widely separated points on the tangent.
- Calculate the gradient.
This provides an estimate of:
instantaneous reaction rate
Why Tangent Rates Are Estimates
A tangent drawn by hand will not be:
perfectly exact
Two students may draw slightly different tangents and calculate slightly different rates.
This is acceptable if:
- the tangent is reasonable
- a large gradient triangle is used
- calculations are correct
- units are included
Therefore, instantaneous rates obtained graphically are often reported as:
approximate values
Interpreting Graphical Evidence
Calculations are only part of graph analysis.
You should also be able to explain:
what the graph tells us about the reaction
For example:
The curve is steepest during the first 10 seconds, indicating the greatest reaction rate. The gradient decreases with time as reactants are consumed. After approximately 60 seconds, the graph becomes horizontal, showing that there is no further net product formation.
This combines:
observation + calculation + chemical explanation
A Strong Graph Analysis Structure
Use:
Observe → Quantify → Explain
Observe
Describe what the graph does.
"The curve becomes less steep."
Quantify
Use numbers or gradients.
"The rate decreases from approximately 2.5 cm³/s to 0.6 cm³/s."
Explain
Use chemistry.
"Reactants are being consumed, so successful collisions become less frequent."
This creates a much stronger scientific response.
Comparing Reaction Conditions
Suppose two curves represent the same reaction:
Curve A: higher temperature
Curve B: lower temperature
If Curve A has a greater initial gradient:
higher temperature produced a faster initial reaction
This can be explained because particles have:
greater kinetic energy
and a larger fraction of collisions can overcome:
activation energy
Catalyst Graphs
Suppose two experiments differ only by the presence of a catalyst.
The catalyzed reaction generally has:
a greater gradient
and reaches the plateau:
sooner
If both experiments contain the same reactant amounts and reach the same completion:
final product amount remains the same
The catalyst changes:
rate
not the stoichiometric amount of product available.
Concentration and Graph Gradient
Higher reactant concentration usually increases:
collision frequency
Therefore, the initial gradient may be:
greater
A graph can therefore provide evidence about how concentration affects:
reaction rate
Surface Area and Graph Gradient
For reactions involving solids:
greater surface area
means more particles are exposed.
This increases collision opportunities.
Therefore:
greater surface area → greater initial gradient
For example:
powdered calcium carbonate
will generally react faster than the same mass of:
large calcium carbonate pieces
under otherwise identical conditions.
Common Misconception: Rate Is the Height of the Graph
Rate is not determined by:
how high the graph is
Rate is determined by:
gradient
A graph can be very high but completely horizontal.
In that case:
rate of change = 0
Remember:
height → amount
gradient → rate
Common Misconception: Use y ÷ x for Every Gradient
This only works if your interval begins at:
(0,0)
For any two general points, you must calculate:
(y₂ − y₁) / (x₂ − x₁)
Always use:
change in y ÷ change in x
Common Misconception: Use Curve Points to Calculate a Tangent Gradient
For instantaneous rate:
draw the tangent first
Then select two points:
on the tangent
They do not have to be points on the original reaction curve.
Common Misconception: A Steep Downward Graph Means a Slow Reaction
A steep downward slope has a:
large negative gradient
Its magnitude is large.
Therefore, it represents:
rapid decrease
For a reactant:
steep downward slope = rapid reactant consumption
Common Misconception: Negative Rate Means the Reaction Is Going Backward
A negative gradient usually means:
the measured quantity is decreasing
For example:
reactant concentration decreases
or:
mass decreases because gas escapes
It does not automatically mean the chemical reaction is:
running backward
Common Misconception: Average Rate Equals Rate at Every Moment
If the graph is curved:
rate changes continuously
The average rate describes the entire selected interval.
It does not necessarily equal the rate at:
any particular moment
Common Misconception: The Steepest-Looking Graph Is Always Fastest
Before comparing curves on different graphs, check:
- axis scales
- units
- quantities measured
- time intervals
Visual appearance alone can be:
misleading
Calculating gradients provides stronger evidence.
Graph Interpretation Checklist
When given a reaction graph, ask:
1. What is on the x-axis?
Usually:
time
2. What is on the y-axis?
Concentration? Mass? Gas volume?
3. Is the graph increasing or decreasing?
This tells you the:
direction of change
4. How steep is the graph?
This tells you the:
rate
5. Does the gradient change?
This tells you whether the reaction:
speeds up or slows down
6. Does the graph become horizontal?
This indicates:
no further net change in the measured quantity
Check Your Understanding
1. What does the gradient of a reaction graph represent?
2. A reaction produces 48 cm³ of gas in 24 s. Calculate the average rate.
3. Product volume increases from 30 cm³ at 10 s to 70 cm³ at 30 s. Calculate the average rate between these times.
4. A reactant concentration decreases from 0.90 mol/L to 0.50 mol/L over 20 s. Calculate the gradient.
5. Why is the gradient of a reactant concentration graph usually negative?
6. Explain the difference between average rate and instantaneous rate.
7. Describe how a tangent can be used to estimate instantaneous reaction rate.
8. Why should two widely separated points be selected when calculating a tangent gradient?
9. A reaction graph is steep at 10 s but almost horizontal at 50 s. What does this tell you about how the reaction rate has changed?
10. Explain why reaction graphs often become less steep as the reaction proceeds.
Key Terms
- Reaction rate: Measure of how quickly reactants are consumed or products are formed.
- Gradient: Change in the y-value divided by the corresponding change in the x-value.
- Average rate: Rate calculated over a specified time interval.
- Instantaneous rate: Rate at one particular moment.
- Initial rate: Reaction rate at the beginning of a reaction.
- Tangent: Straight line touching a curve at a particular point and following its direction there.
- Rate of formation: Speed at which a product is produced.
- Rate of disappearance: Speed at which a reactant is consumed.
- Positive gradient: Gradient produced when the measured quantity increases.
- Negative gradient: Gradient produced when the measured quantity decreases.
- Plateau: Horizontal region where the measured quantity remains approximately constant.
- Curve of best fit: Smooth curve representing the overall pattern of experimental data.
- Collision theory: Model explaining reaction rates through collisions between reacting particles.
- Successful collision: Collision that results in a chemical reaction.
- Activation energy: Minimum energy required for a successful reaction.
Key Takeaways
- Reaction rates can be determined from the gradients of reaction graphs.
- Average rate = change in measured quantity ÷ change in time.
- Always calculate Δy ÷ Δt, not simply y ÷ t unless the interval begins at the origin.
- Rate units depend on the quantities shown on the graph.
- Gas-volume graphs may give rates in cm³/s.
- Concentration graphs may give rates in mol L⁻¹ s⁻¹.
- Mass graphs may give rates in g/s.
- Product formation graphs usually have positive gradients.
- Reactant concentration graphs usually have negative gradients.
- The magnitude of a gradient indicates how quickly the measured quantity is changing.
- Steep gradient = rapid change.
- Shallow gradient = slow change.
- Horizontal graph = zero net change in the measured quantity.
- A curved graph indicates that reaction rate is changing.
- Average rate describes a time interval.
- Instantaneous rate describes one particular moment.
- Instantaneous rate can be estimated by drawing a tangent to the curve.
- Calculate the gradient using two widely separated points on the tangent.
- Tangent-based rates are estimates and should usually be treated as approximate.
- Reaction rates often decrease with time because reactants are consumed.
- Lower reactant concentrations generally lead to fewer successful collisions.
- Different reaction rates can be compared using gradients at the same time or over equivalent intervals.
- Graph scales and units must be checked before comparing curves.
- Graph height tells us amount; graph gradient tells us rate.
- Strong graph analysis uses Observe → Quantify → Explain.
4. Industrial and Biological Reactions
Learning outcomes
- I can identify industrial applications of reaction rates.
- I can explain why reaction rate control is important in industry.
- I can describe the role of enzymes in biological reactions.
- I can analyze factors affecting industrial and biological processes.
- I can evaluate methods used to optimize reaction rates.


5. Energy, Rates, and Real-World Applications
Learning outcomes
- I can explain the relationship between energy changes and reaction rates.
- I can analyze real-world examples involving chemical energetics.
- I can evaluate the importance of catalysts in society.
- I can explain how reaction rates affect everyday products and processes.
- I can apply concepts from the course to unfamiliar situations.


Bringing Energy and Reaction Rates Together
Chemical reactions involve two closely related ideas:
energy changes
and:
reaction rates
Energy changes tell us whether energy is:
released or absorbed
Reaction rates tell us:
how quickly a reaction occurs
These ideas are connected, but they are not the same.
A reaction can:
- release a large amount of energy but occur slowly
- release a small amount of energy but occur quickly
- absorb energy and occur quickly
- absorb energy and occur slowly
To understand real chemical processes, we often need to consider:
both energetics and kinetics
Energetics and Kinetics
Two important branches of chemistry help us understand reactions.
Energetics
Concerned with:
energy changes during reactions
Questions include:
- Is energy released?
- Is energy absorbed?
- How much energy changes?
Kinetics
Concerned with:
reaction rates
Questions include:
- How quickly does the reaction occur?
- What factors affect its rate?
- What mechanism does it follow?
A complete understanding of a reaction often requires:
energetics + kinetics
Exothermic Reactions
An exothermic reaction transfers energy from the reacting system to the surroundings.
The surroundings may become:
warmer
Examples include:
- combustion
- many oxidation reactions
- acid-base neutralization
- some respiration-related reactions
For an exothermic reaction:
energy released forming new bonds > energy required to break bonds
The overall energy change is:
energy released to the surroundings


Endothermic Reactions
An endothermic reaction absorbs energy from the surroundings.
The surroundings may become:
cooler
Examples include:
- some thermal decomposition reactions
- reactions used in certain instant cold packs
- some dissolution processes
For an endothermic reaction:
more energy is required to break bonds than is released when new bonds form
The reaction therefore requires a net input of:
energy
Energy Profile Diagrams
An energy profile diagram shows the energy changes occurring during a reaction.
The vertical axis represents:
energy
The horizontal axis represents:
reaction progress
Important features include:
- reactant energy
- product energy
- activation energy
- overall energy change


Activation Energy
Even reactions that release energy usually require some energy to:
get started
This minimum energy is called:
activation energy
Symbol:
Eₐ
Particles must collide with sufficient energy to overcome this barrier.
Therefore:
collision + sufficient energy + suitable orientation → successful reaction
A Hill Analogy
Imagine pushing a ball over a hill.
The ball may eventually roll down to a:
lower-energy position
But first, you must provide enough energy to push it:
over the hill
The hill represents:
activation energy
This helps explain why an energetically favorable reaction may still:
occur slowly
Energy Released Does Not Determine Rate
Consider a piece of wood.
Wood can react with oxygen:
wood + oxygen → combustion products + energy
The reaction releases substantial energy.
Yet a piece of wood can sit in air for:
years
without suddenly bursting into flames.
Why?
Because the reaction requires sufficient:
activation energy
A flame or spark can provide this energy.


This demonstrates:
exothermic does not automatically mean fast
Collision Theory
Reaction rate can be explained using:
collision theory
Reacting particles must:
- collide
- collide with sufficient energy
- collide with suitable orientation
Only some collisions are:
successful collisions
The reaction rate depends on:
how frequently successful collisions occur
Temperature Connects Energy and Rate
Increasing temperature gives particles more:
kinetic energy
This affects reaction rate in two important ways.
Particles:
move faster
so collisions occur more frequently.
More importantly, a greater fraction of particles have enough energy to overcome:
activation energy
Therefore:
higher temperature → more successful collisions → faster reaction


Why Temperature Has Such a Strong Effect
Increasing temperature does not merely make particles:
slightly faster
It also increases the proportion of collisions that have enough energy to overcome the activation-energy barrier.
Therefore, even a moderate increase in temperature can sometimes produce:
a substantial increase in reaction rate
Catalysts Connect Energy and Rate
A catalyst increases reaction rate by providing:
an alternative reaction pathway
with a lower:
activation energy
This allows a greater proportion of collisions to become:
successful
Therefore:
lower Eₐ → more successful collisions → faster reaction
Catalysts and Energy Profile Diagrams
A catalyst changes the pathway between:
reactants and products
but does not change their starting and finishing energy levels.


Therefore, a catalyst:
lowers activation energy
but does not change the overall energy change of the reaction.
What a Catalyst Does NOT Change
A catalyst does not change:
- the energy of the reactants
- the energy of the products
- the overall energy change
- the stoichiometric amount of product possible from given starting amounts
For a reversible reaction, a catalyst also does not change:
the equilibrium position
It simply allows equilibrium to be reached:
more quickly
Why Catalysts Matter to Society
Catalysts are enormously important because many useful chemical reactions would otherwise be:
too slow
or require:
more extreme conditions
Catalysts are used in:
- fertilizer manufacture
- fuel processing
- polymer production
- pharmaceuticals
- food production
- vehicle exhaust systems
- biotechnology
- biological metabolism


Catalysts Can Save Energy
Suppose an industrial reaction is too slow at:
300°C
Without a catalyst, it might require:
500°C
to reach a useful rate.
If a catalyst allows an acceptable rate at 300°C, the factory may require:
less heating
This can reduce:
- energy consumption
- operating costs
- fuel use
- associated emissions
Catalysts can therefore contribute to:
more efficient chemical production
Catalysts Can Improve Selectivity
Some catalysts help favor a particular:
reaction pathway
This can increase production of the:
desired product
and reduce:
unwanted side products
Greater selectivity can mean:
- less waste
- easier purification
- better use of raw materials
This is especially important in:
pharmaceutical and fine-chemical manufacturing
Catalysts Also Have Limitations
Catalysts are extremely useful, but their use can involve challenges.
They may:
- be expensive
- require rare materials
- become contaminated
- lose activity
- require replacement
- require recovery after use
Therefore, evaluating a catalyst involves more than simply asking:
"Does it make the reaction faster?"
Catalytic Converters
Vehicle engines produce gases that can include harmful pollutants.
A catalytic converter contains catalysts that speed up reactions converting some harmful exhaust gases into:
less harmful products


Catalytic converters demonstrate how catalysts can be used for:
pollution reduction
Catalysts and Fertilizer Production
Ammonia is an important starting material for many:
fertilizers
It is manufactured industrially through the Haber process:
N₂ + 3H₂ ⇌ 2NH₃
An iron-based catalyst helps the system reach equilibrium:
more quickly
Without effective catalysis, ammonia production would be:
less practical and more energy-intensive
Biological Catalysts
Living organisms also depend on catalysts.
These biological catalysts are:
enzymes
Enzymes allow reactions to occur rapidly at the relatively mild temperatures found inside:
cells
Without enzymes, many reactions required for life would occur:
far too slowly


Energy and Respiration
Cells require energy for:
- muscle contraction
- active transport
- growth
- cell division
- protein synthesis
- nerve activity
Cells obtain usable energy through controlled biochemical pathways such as:
cellular respiration
The overall aerobic respiration reaction releases energy:
glucose + oxygen → carbon dioxide + water
But cells do not simply burn glucose in one uncontrolled step.
Instead, enzymes control:
a sequence of reactions
Why Controlled Energy Release Matters
Imagine releasing all the chemical energy in glucose:
instantly
Much of it would be released as:
heat
and could damage cells.
Biological pathways allow energy to be released through:
controlled reaction steps
This allows cells to capture useful energy for:
biological work
Everyday Example: Food Storage
Reaction rates explain why food is often stored in:
refrigerators
Lower temperatures reduce particle kinetic energy and generally slow:
- enzyme-controlled reactions
- microbial growth and metabolism
- many chemical reactions involved in food deterioration


Therefore:
lower temperature → slower deterioration → longer storage life
Refrigeration Does Not Stop Reactions
A refrigerator does not normally stop chemical and biological processes completely.
It:
slows them
This is why refrigerated food still eventually:
spoils
Freezing can slow many processes even further, although it also does not necessarily destroy all microorganisms or permanently stop all chemical change.
Everyday Example: Cooking
Cooking involves many chemical changes.
Increasing temperature increases reaction rates.
Processes include:
- protein denaturation
- browning reactions
- starch changes
- breakdown of plant tissues
- flavor-producing reactions


Higher temperatures can make these changes occur:
more quickly
But excessive temperature can cause:
- burning
- unwanted products
- nutrient loss
- undesirable textures
Again:
faster is not always better
Everyday Example: Baking
Baking depends on carefully controlled reaction rates.
For example:
baking soda or baking powder
can produce:
carbon dioxide
The gas expands and contributes to:
rising
If gas is produced too early, too late, too quickly, or too slowly, the final texture can be affected.
This demonstrates how reaction rate influences:
product quality
Everyday Example: Combustion
Combustion reactions release:
energy
Fuels include:
- natural gas
- gasoline
- diesel
- biomass
A combustion reaction needs:
- fuel
- oxygen
- sufficient activation energy
Once initiated, combustion may proceed rapidly because it releases:
heat


Why Fuels Need Ignition
Gasoline contains chemical energy.
Yet gasoline does not necessarily combust immediately simply because oxygen is present.
The reaction requires:
activation energy
A spark in an engine can provide the initial energy needed to begin:
combustion
This is another example showing the distinction between:
stored chemical energy
and:
reaction rate
Everyday Example: Hand Warmers
Some hand warmers use chemical reactions that:
release energy
A common type uses oxidation of iron.
The reaction is designed to occur:
slowly enough
to provide useful warmth over an extended period.
If the same energy were released almost instantly, the product would be:
less useful and potentially unsafe


This demonstrates:
usefulness depends on both energy released and rate of release
Energy Release: Slow vs Fast
Imagine two reactions release the same total amount of energy.
Reaction A
Releases the energy in:
5 seconds
Reaction B
Releases the energy in:
5 hours
The total energy change may be similar.
But their:
power and practical effects
are very different.
Reaction A releases energy:
much more rapidly
This could make it:
hotter or more difficult to control
Everyday Example: Instant Cold Packs
Some cold packs use processes that absorb:
thermal energy
from the surroundings.
The pack becomes:
cooler
This is an example of an:
endothermic process
The usefulness of the pack depends on both:
- the amount of energy absorbed
- how quickly that energy is absorbed


Everyday Example: Rusting
Rusting is an oxidation process involving:
iron
It is energetically possible under ordinary conditions, but usually occurs:
relatively slowly
Factors such as:
- water
- oxygen
- salts
- temperature
can affect the rate.


Rusting again shows that:
a reaction can be favorable but slow
Why Salt Can Accelerate Corrosion
Dissolved salts can increase the conductivity of water and help electrochemical corrosion processes proceed.
This is why corrosion can be particularly important in:
marine environments
or where roads are treated with:
de-icing salts
Understanding reaction rates helps engineers develop strategies to:
slow corrosion
Slowing Reactions Can Be Useful
We often discuss ways to:
increase reaction rate
But sometimes we want the opposite.
Examples include:
- slowing food spoilage
- reducing corrosion
- preventing unwanted oxidation
- slowing decomposition of medicines
- preventing fires
- extending product shelf life
Reaction-rate science is therefore about:
controlling rate
not simply increasing it.
Everyday Example: Medicines
Medicines can undergo chemical changes during:
storage
Temperature, light, moisture, and oxygen can affect these reactions.
This is why medicines may have instructions such as:
store below a specified temperature
or:
protect from light
The goal is often to:
slow unwanted chemical reactions
and preserve product quality.
Shelf Life
The shelf life of a product is the period during which it remains suitable for its intended use under specified storage conditions.
Reaction rates influence the shelf life of:
- foods
- medicines
- cosmetics
- batteries
- chemicals
Slowing unwanted reactions can:
extend shelf life
Everyday Example: Glow Sticks
Glow sticks produce light through:
chemiluminescence
A chemical reaction releases energy that ultimately appears partly as:
visible light
Temperature affects the reaction rate.
A warmer glow stick generally reacts:
faster and more brightly for a shorter time
A colder glow stick generally reacts:
more slowly and less brightly for longer


This is an excellent example of:
temperature → reaction rate → product performance
Batteries
Batteries rely on:
redox reactions
to convert chemical energy into electrical energy.
Reaction rates affect:
- current delivery
- performance
- charging and discharging
- temperature behavior
At low temperatures, some battery reactions proceed:
more slowly
This can reduce battery performance.
Reaction Rate and Safety
Some reactions can become dangerous if their rate increases too much.
For an exothermic reaction:
reaction releases heat
If heat cannot escape quickly enough:
temperature rises
Higher temperature can:
increase reaction rate
which releases:
even more heat
This positive feedback can lead to:
thermal runaway
Thermal Runaway
The basic pattern is:
reaction produces heat
↓
temperature increases
↓
reaction becomes faster
↓
more heat is produced
↓
temperature rises further


This is why temperature control is extremely important in:
industrial chemistry and battery systems
Surface Area and Energy Release
Surface area can dramatically affect reaction rate.
Consider:
a block of wood
and:
fine wood shavings
The shavings have a much greater:
surface-area-to-volume ratio
More material is exposed to oxygen.
Therefore, combustion can occur:
more rapidly
The chemical energy stored in the material may be similar per unit mass, but the:
rate of energy release
can be very different.
Concentration and Everyday Reactions
Increasing reactant concentration often increases:
collision frequency
This can increase reaction rate.
This principle is important in:
- cleaning products
- industrial manufacturing
- laboratory reactions
- combustion
- biological processes
However, higher concentration can also increase:
- cost
- hazards
- corrosiveness
- environmental impact
Therefore, concentration must be:
optimized
Pressure and Gas Reactions
For gaseous reactants, increasing pressure places particles:
closer together
This generally increases:
collision frequency
and can increase reaction rate.
Industrial gas reactions may therefore use:
elevated pressures
But higher pressure requires:
- stronger equipment
- more energy
- greater safety controls
Again, the practical question is:
What conditions provide the best balance?
Applying Ideas to an Unfamiliar Situation
Suppose you are told:
A company produces a chemical using a reaction that is too slow at room temperature. Heating greatly increases the rate, but temperatures above 150°C produce unwanted products.
How could the process be improved?
A strong response might consider:
Use a catalyst
because it may increase the rate without requiring such a high temperature.
Also consider:
- moderate heating
- optimized concentration
- improved mixing
- increased surface area if solids are involved
The goal is not simply:
maximum rate
but:
useful rate + desired product + acceptable cost and safety
Another Unfamiliar Situation
Suppose a food manufacturer discovers that a product spoils rapidly at:
25°C
but much more slowly at:
5°C
Explain why.
At lower temperature:
- particles have less kinetic energy
- collisions occur less energetically
- fewer collisions overcome activation energy
- enzyme and microbial processes generally slow
Therefore:
spoilage reactions occur more slowly
This applies reaction-rate theory to:
food preservation
Another Unfamiliar Situation
A manufacturer wants a hand warmer to remain warm for:
eight hours
rather than becoming extremely hot for:
ten minutes
What should engineers consider?
They need to control:
reaction rate
Possible approaches might involve controlling:
- oxygen availability
- reactant concentration
- surface area
- catalyst conditions
- heat transfer
The desired product requires:
controlled energy release
rather than simply a large energy change.
Another Unfamiliar Situation
A biological reaction works well at 35°C but becomes extremely slow at 5°C and almost stops at 70°C.
What might explain this?
At 5°C:
low kinetic energy reduces enzyme-substrate collision frequency
At 70°C:
the enzyme may be denatured
Therefore, the reaction has an:
optimum temperature range
This applies ideas about:
energy + collisions + enzyme structure
Evaluating a Catalyst
When evaluating whether a catalyst should be used, consider:
Benefits
- faster reaction
- lower activation energy
- potentially lower operating temperature
- lower energy use
- possible improved selectivity
- increased production rate
Limitations
- catalyst cost
- availability of catalyst materials
- possible toxicity
- catalyst deactivation
- recovery and recycling requirements
A strong evaluation considers:
both benefits and limitations
Evaluating Reaction Conditions
Suppose increasing temperature doubles production rate.
Is that automatically worthwhile?
Not necessarily.
We must also ask:
- How much additional energy is required?
- Does product yield change?
- Are unwanted reactions increased?
- Does the catalyst degrade?
- Does equipment need upgrading?
- Are safety risks increased?
- What is the environmental cost?
Real chemistry involves:
trade-offs
Rate, Energy, and Sustainability
Modern chemical processes increasingly aim to reduce:
- energy consumption
- waste
- hazardous materials
- greenhouse gas emissions
- unnecessary resource use
Catalysts can help because they may allow reactions to proceed efficiently at:
lower temperatures or pressures
Enzymes can sometimes allow industrial reactions to occur under:
mild conditions
These ideas contribute to:
green chemistry
Green Chemistry
Green chemistry focuses on designing chemical products and processes that reduce environmental harm.
Reaction-rate control can contribute through:
- efficient catalysts
- lower-energy pathways
- reduced waste
- greater selectivity
- renewable raw materials
- safer reaction conditions


The goal is not merely to make chemistry:
faster
but to make it:
more efficient, safer, and more sustainable
The Central Connection
We can now connect the major ideas of chemical energetics and reaction rates.
Reactants
↓
must overcome
activation energy
↓
through
successful collisions
↓
to form
products
The frequency of successful collisions determines:
reaction rate
The energy difference between reactants and products determines:
overall energy change
A catalyst:
lowers the activation-energy barrier
without changing the overall energy difference.
Energy Profile Summary
For an exothermic reaction:
reactants → activation-energy barrier → lower-energy products
For an endothermic reaction:
reactants → activation-energy barrier → higher-energy products
With a catalyst:
activation-energy barrier becomes lower
but:
reactant and product energy levels remain unchanged
This distinction is one of the most important concepts in:
chemical energetics
A Powerful Problem-Solving Framework
When given an unfamiliar reaction-rate situation, ask:
1. What reaction is occurring?
Identify:
reactants and products
2. What energy changes are involved?
Is the process:
exothermic or endothermic?
3. What limits the rate?
Consider:
- temperature
- concentration
- pressure
- surface area
- activation energy
- catalysts
4. What could change the rate?
Apply:
collision theory
5. What are the consequences?
Consider:
- cost
- safety
- yield
- quality
- energy use
- environmental effects
This approach allows you to apply familiar chemistry to:
new situations
Common Misconception: Exothermic Means Fast
False.
Exothermic describes:
energy change
It does not describe:
reaction rate
Rusting is an example of an oxidation process that can occur:
slowly
while combustion can occur:
rapidly
Both can release energy.
Common Misconception: Endothermic Means Slow
Also false.
Endothermic describes:
energy transfer
not:
speed
An endothermic process can occur rapidly if conditions allow a sufficiently high:
reaction rate
Common Misconception: Catalysts Add Energy
Catalysts do not supply the reaction with extra energy.
They provide:
an alternative pathway with lower activation energy
This allows more collisions to be:
successful
Common Misconception: Catalysts Change the Energy Released
A catalyst does not change the overall energy difference between:
reactants and products
Therefore, it does not change the overall reaction energy change.
It changes:
the pathway and rate
Common Misconception: Higher Temperature Is Always Better
Higher temperature often increases reaction rate.
But it may also:
- increase energy costs
- cause unwanted reactions
- damage products
- denature enzymes
- increase safety risks
The best temperature depends on:
the purpose of the process
Common Misconception: We Always Want Faster Reactions
Sometimes we deliberately want reactions to be:
slower
Examples include:
- food spoilage
- corrosion
- medicine degradation
- oxidation
- battery self-discharge
Reaction-rate science is fundamentally about:
control
Check Your Understanding
1. Explain the difference between chemical energetics and chemical kinetics.
2. Why can an exothermic reaction still occur slowly?
3. Define activation energy.
4. Explain why increasing temperature usually increases reaction rate.
5. How does a catalyst affect activation energy?
6. Does a catalyst change the overall energy change of a reaction? Explain.
7. Explain why refrigeration slows food spoilage.
8. Why does a glow stick usually glow more brightly but for less time when warmed?
9. Explain why wood shavings may burn faster than a large block of wood.
10. Explain why catalysts can reduce industrial energy requirements.
11. Why might an industrial chemist deliberately avoid the highest possible reaction rate?
12. Explain how enzymes allow living organisms to carry out chemical reactions efficiently.
13. A reaction releases a large amount of energy but occurs very slowly at room temperature. Suggest two ways its rate might be increased.
14. Explain why slowing reaction rates can sometimes be useful.
15. Evaluate why catalysts are important for modern society.
Key Terms
- Energetics: Study of energy changes associated with chemical reactions.
- Kinetics: Study of reaction rates and the factors affecting them.
- Exothermic reaction: Reaction that transfers energy to the surroundings.
- Endothermic reaction: Reaction that absorbs energy from the surroundings.
- Activation energy: Minimum energy required for a successful reaction.
- Reaction rate: Measure of how quickly reactants are consumed or products are formed.
- Collision theory: Model explaining reactions through collisions between particles.
- Successful collision: Collision with sufficient energy and suitable orientation to produce a reaction.
- Catalyst: Substance that increases reaction rate by providing an alternative pathway with lower activation energy.
- Enzyme: Biological catalyst.
- Energy profile diagram: Diagram showing energy changes during the progress of a reaction.
- Reaction pathway: Sequence of steps through which reactants become products.
- Combustion: Rapid reaction with oxygen that releases energy.
- Corrosion: Chemical deterioration of a material through reactions with its environment.
- Shelf life: Period during which a product remains suitable for its intended use under specified storage conditions.
- Thermal runaway: Self-accelerating process in which heat increases reaction rate, causing still more heat production.
- Selectivity: Tendency of a reaction or catalyst to produce a particular desired product.
- Green chemistry: Design of chemical products and processes to reduce hazardous substances, waste, and environmental impact.
- Optimization: Selection of conditions that provide the best practical balance among competing factors.
Key Takeaways
- Chemical energetics describes energy changes, while kinetics describes reaction rates.
- Energy change and reaction rate are related but are not the same thing.
- Exothermic does not mean fast.
- Endothermic does not mean slow.
- Most reactions require particles to overcome an activation-energy barrier.
- Reaction rate depends on the frequency of successful collisions.
- Increasing temperature generally increases particle kinetic energy and the proportion of collisions that overcome activation energy.
- Catalysts provide alternative reaction pathways with lower activation energies.
- Catalysts increase reaction rate without changing the overall energy difference between reactants and products.
- Catalysts are essential in many industrial, environmental, and biological processes.
- Catalysts can reduce energy requirements by allowing useful rates under less extreme conditions.
- Enzymes are biological catalysts that allow life-sustaining reactions to proceed rapidly under mild conditions.
- Combustion demonstrates how activation energy and energy release interact.
- Refrigeration preserves food by slowing chemical and biological processes.
- Cooking uses increased temperature to accelerate chemical changes.
- Hand warmers depend on controlled rates of energy-releasing reactions.
- Cold packs depend on processes that absorb thermal energy.
- Glow sticks demonstrate how temperature can change reaction rate and product performance.
- Corrosion demonstrates why slowing reactions can be useful.
- Surface area, concentration, temperature, pressure, and catalysts can all influence reaction rates.
- The amount of energy released and the rate at which it is released are different quantities.
- Very rapid exothermic reactions can create safety risks, including thermal runaway.
- Industry must balance reaction rate with yield, cost, energy use, safety, quality, and environmental impact.
- Green chemistry uses catalysts and optimized reaction conditions to improve efficiency and sustainability.
- When faced with an unfamiliar situation, consider reaction → energy → rate factor → collision theory → practical consequences.
- The central relationship is activation energy → successful collisions → reaction rate, while the difference between reactant and product energy determines the overall energy change.