Rates of Reaction
2. Measuring Reaction Rates
Learning outcomes
- I can describe methods used to measure reaction rates.
- I can collect data from reaction rate experiments.
- I can calculate average reaction rates.
- I can compare reaction rates using experimental data.
- I can evaluate the reliability of reaction rate measurements.
Why Do We Measure Reaction Rate?
Knowing that one reaction is "fast" and another is "slow" is useful, but scientists usually need quantitative evidence.
To measure reaction rate, we monitor a quantity that changes as the reaction takes place.
For example, we might measure:
- the volume of gas produced
- the mass lost from a reaction mixture
- the concentration of a reactant or product
- the amount of precipitate formed
- a change in colour
- the time required to reach a particular endpoint
The general relationship is:
Rate = change in measured quantity ÷ time taken
The most appropriate method depends on what can be measured reliably during the particular reaction.
What Makes a Good Rate Measurement?
A useful reaction-rate measurement needs two things:
1. A quantity that changes as the reaction proceeds
and
2. Accurate measurements of time
For example:
gas volume vs time
mass vs time
concentration vs time
A single observation such as "there were lots of bubbles" is not normally enough for a good quantitative investigation.
Method 1: Measuring Gas Volume with a Gas Syringe
One of the most useful methods is to measure the volume of gas produced.
This works when one of the reaction products is a gas.
For example:
CaCO₃ + 2HCl → CaCl₂ + H₂O + CO₂
Carbon dioxide is produced.
The reaction flask can be connected to a gas syringe.

As carbon dioxide forms, it travels through the delivery tube and pushes the syringe plunger outward.
The gas volume can be recorded at regular intervals.
For example:
every 10 seconds
or:
every 20 seconds
Gas-syringe methods allow gas production to be followed throughout the reaction.
Collecting Gas-Syringe Data
A results table might look like this:
| Time (s) | Volume of CO₂ (cm³) |
|---|---|
| 0 | 0 |
| 10 | 18 |
| 20 | 31 |
| 30 | 41 |
| 40 | 48 |
| 50 | 52 |
| 60 | 54 |
| 70 | 55 |
Notice that the increase in gas volume becomes smaller with time.
This indicates that the reaction is slowing down.
Plotting Gas Volume Against Time
The data can be plotted as:
Volume of gas vs time

At the beginning:
large gradient → fast reaction
Later:
smaller gradient → slower reaction
Eventually:
horizontal graph → no more gas being produced
The gradient of a gas-volume graph therefore gives a measure of the reaction rate.
Average Rate from Gas Volume
Suppose:
72 cm³
of gas is produced in:
40 s
Average rate:
Rate = 72 ÷ 40
Rate = 1.8 cm³ s⁻¹
Therefore:
Average reaction rate = 1.8 cm³ s⁻¹
The units reflect what was measured:
cm³ s⁻¹
Rate Over a Particular Time Interval
We do not always calculate rate from the beginning.
Suppose:
At 20 s:
30 cm³
At 50 s:
54 cm³
Change in volume:
54 − 30 = 24 cm³
Change in time:
50 − 20 = 30 s
Therefore:
Average rate = 24 ÷ 30
= 0.80 cm³ s⁻¹
This is the average rate between 20 s and 50 s.
Gas Collection by Water Displacement
A gas syringe is not the only way to collect gas.
Gas can also be collected over water using an inverted measuring cylinder.
The gas enters the measuring cylinder and displaces the water.
The volume of displaced water corresponds approximately to the volume of gas collected.
This method is useful for gases that do not dissolve significantly or react rapidly with water.
Gas Syringe vs Water Displacement
A gas syringe often gives a direct volume reading.
Water displacement can also work well, but some gases dissolve in water, which may reduce the measured volume.
Gas collection can also be affected by:
- leaks
- gas escaping before the bung is fitted
- friction in the gas-syringe plunger
- reading the scale incorrectly
- delays when starting the timer
These become important when evaluating experimental reliability.
Method 2: Measuring Loss of Mass
If a reaction releases a gas into the air, the mass of the reaction system decreases.
Consider:
CaCO₃ + 2HCl → CaCl₂ + H₂O + CO₂
The carbon dioxide escapes.
A conical flask can be placed on an electronic balance.
As CO₂ leaves the flask:
mass decreases
The faster the mass decreases:
the faster the reaction
A cotton-wool plug can reduce loss of liquid spray while still allowing gas to escape.
Example Mass-Loss Data
Suppose a reaction gives:
| Time (s) | Mass (g) |
|---|---|
| 0 | 125.80 |
| 20 | 125.25 |
| 40 | 124.86 |
| 60 | 124.62 |
| 80 | 124.49 |
| 100 | 124.45 |
| 120 | 124.45 |
The mass decreases rapidly near the beginning.
Later, the change becomes smaller.
Eventually:
mass stays constant
This indicates that the measurable gas-producing reaction has stopped.
Calculating Rate from Mass Loss
Initial mass:
125.80 g
Mass after 40 s:
124.86 g
Mass lost:
125.80 − 124.86
= 0.94 g
Average rate:
0.94 ÷ 40
= 0.0235 g s⁻¹
Therefore:
Average rate of mass loss = 0.0235 g s⁻¹
A Mass-Loss Graph
Mass-loss data can also be represented graphically.
A steep gradient indicates rapid mass loss.
A shallow gradient indicates slower mass loss.
A flat section indicates that the measured mass is no longer changing.
The same basic interpretation therefore applies to both mass and gas-volume graphs.
When Is Mass Loss a Good Method?
Mass loss is particularly useful when the escaping gas causes a measurable decrease in mass.
Carbon dioxide is often suitable.
Hydrogen can be less suitable because its mass is so small that the change may be difficult to detect accurately with an ordinary school balance.
This illustrates an important experimental principle:
Choose a measuring method that produces a change large enough for the instrument to detect reliably.
Method 3: The Disappearing Cross Method
Some reactions form a solid precipitate that causes a solution to become cloudy.
A classic example uses:
sodium thiosulfate + hydrochloric acid
Sulfur forms during the reaction.
The sulfur makes the mixture increasingly cloudy.
A black cross is placed underneath the flask.
The stopwatch is stopped when the cross can no longer be seen.
A shorter time means:
faster reaction
A longer time means:
slower reaction
The method is simple, but the endpoint is partly subjective because different observers may decide that the cross disappeared at slightly different times.
Using 1 ÷ Time as a Relative Rate
Suppose the same visual endpoint is used for every experiment.
A useful relative-rate measure is:
Relative rate = 1 ÷ time
For example:
Experiment A:
time = 20 s
Relative rate:
1 ÷ 20 = 0.050 s⁻¹
Experiment B:
time = 50 s
Relative rate:
1 ÷ 50 = 0.020 s⁻¹
Therefore:
Experiment A is faster.
The reciprocal-time method is a comparative measure and works only when every experiment uses the same endpoint.
Why Is the Disappearing Cross Less Precise?
The gas-syringe method provides many measurements:
0 s, 10 s, 20 s, 30 s, and so on.
The disappearing-cross experiment usually gives one main measurement:
time until the cross disappears
It also depends on human judgement.
One person might stop the timer at:
31.2 s
while another stops it at:
33.0 s
This makes the method less objective.
Improving the Disappearing Cross Method
Reliability can be improved by:
- using the same cross every time
- using the same flask
- using the same observer
- viewing from the same position
- using identical lighting conditions
- repeating each experiment
- calculating a mean
- identifying anomalous results
An even more objective approach is to use a light sensor or colorimeter.
Method 4: Measuring Colour Change
Some reactions involve coloured reactants or products.
A colorimeter measures how strongly a solution absorbs light.
The basic arrangement includes:
- a light source
- a filter or selected wavelength
- a cuvette containing the solution
- a detector
- a meter or data logger
If the coloured substance becomes less concentrated during the reaction, its absorbance will generally decrease.
Colorimetry can provide continuous quantitative data and avoids relying entirely on human judgement about colour changes.
Absorbance and Concentration
A calibration graph can relate absorbance to concentration.
Once the relationship is established, colorimeter measurements can be converted into concentrations.
This makes it possible to monitor:
concentration vs time
rather than relying only on a visible endpoint.
Method 5: Measuring Concentration Directly
For some reactions, samples can be taken at different times and analysed to determine concentration.
For example, scientists may use:
- titration
- conductivity
- pH measurements
- spectroscopy
- colorimetry
The rate can then be expressed as:
Rate = change in concentration ÷ change in time
Typical units are:
mol dm⁻³ s⁻¹
This is particularly important in more advanced chemical kinetics.
Collecting Good Experimental Data
A good results table should include:
the independent variable
the dependent variable
units
sensible measurement intervals
For example:
| Time (s) | Gas Volume (cm³) |
|---|---|
| 0 | 0 |
| 10 | 16 |
| 20 | 29 |
| 30 | 39 |
| 40 | 46 |
| 50 | 50 |
| 60 | 52 |
Measurements should normally be taken at regular intervals unless there is a good reason to do otherwise.
Why Take Several Measurements?
Suppose you measured only:
0 cm³ at 0 s
and:
52 cm³ at 60 s
You could calculate an overall average rate.
But you would not know how the rate changed during the reaction.
Taking many measurements allows us to construct a curve.
That curve can show:
- initial rate
- slowing of the reaction
- when the reaction finishes
- anomalous data
- differences between experiments
Continuous monitoring therefore provides much more information than a single endpoint.
Plotting Reaction-Rate Data
Suppose two experiments produce the following curves:
The steepest curve represents the fastest reaction.
The reaction reaching the plateau first has completed sooner.
If all curves reach the same final gas volume, the same total amount of gas was produced even though the rates were different.
Comparing Surface Area Experiments
Consider equal masses of calcium carbonate used as:
- large chunks
- small chips
- powder

If all other variables are controlled, powdered calcium carbonate usually reacts fastest because it has the largest surface area.
The purpose of good rate measurements is to make this comparison quantitative, not simply to say that one flask "looked fizzier."
Initial Rate
Many reactions are fastest immediately after the reactants are mixed.
The initial rate is the rate at:
t = 0
On a graph, we can estimate it by drawing a tangent at the beginning of the curve.
A steeper initial tangent indicates a larger initial rate.
Instantaneous Rate
A reaction does not normally proceed at exactly the same rate throughout.
Therefore, we may want the rate at a particular moment.
This is called the instantaneous rate.
We estimate it using a tangent.
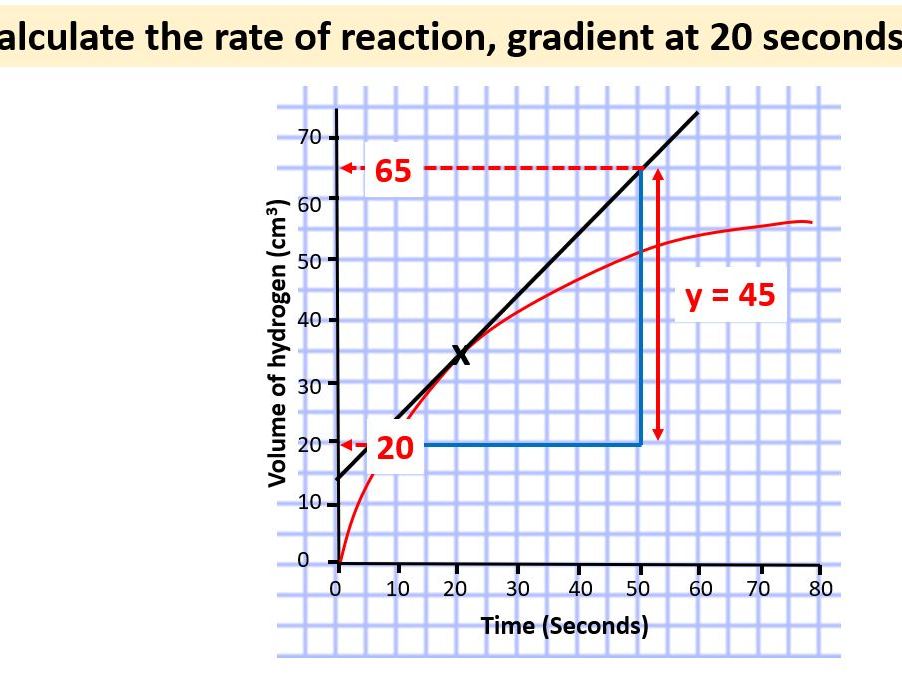
The rate is:
gradient = change in y ÷ change in x
For example:
Change in gas volume:
65 − 20 = 45 cm³
Change in time:
52 − 12 = 40 s
Approximate rate:
45 ÷ 40
= 1.125 cm³ s⁻¹
Average Rate vs Instantaneous Rate
These two terms are different.
Average rate
Rate over a time interval.
For example:
0–40 s
Instantaneous rate
Rate at one particular moment.
For example:
at 20 s
A reaction-rate curve is usually not a straight line because the rate changes as the reaction proceeds.
Worked Example 1: Average Gas Production Rate
A reaction produces:
84 cm³ of gas
in:
35 s
Rate:
84 ÷ 35
= 2.4 cm³ s⁻¹
Therefore:
average rate = 2.4 cm³ s⁻¹
Worked Example 2: Mass Loss
Mass at the start:
98.62 g
Mass after 50 s:
97.37 g
Mass lost:
98.62 − 97.37
= 1.25 g
Rate:
1.25 ÷ 50
= 0.025 g s⁻¹
Worked Example 3: Comparing Two Experiments
Experiment A produces:
60 cm³ in 30 s
Experiment B produces:
60 cm³ in 75 s
Experiment A:
60 ÷ 30 = 2.0 cm³ s⁻¹
Experiment B:
60 ÷ 75 = 0.80 cm³ s⁻¹
Therefore:
Experiment A is 2.5 times faster by this average-rate comparison.
Worked Example 4: Using Reciprocal Time
Three disappearing-cross trials give:
| Trial | Time (s) | 1/time (s⁻¹) |
|---|---|---|
| A | 80 | 0.0125 |
| B | 40 | 0.0250 |
| C | 20 | 0.0500 |
The fastest is:
C
because it has:
the shortest time
and:
the largest 1/time value
Comparing Reaction Curves
Consider curves for several experiments.
When comparing curves, look for two things:
Gradient
This tells us about rate.
Plateau height
This tells us about the final quantity measured, such as total gas produced.
These two features should not be confused.
A reaction can be faster but produce the same final amount of product.
Reliability, Accuracy and Precision
When evaluating rate measurements, it is useful to distinguish several ideas.
Reliability
Do repeated experiments give similar results?
Accuracy
How close is the measurement to the true value?
Precision
How closely repeated measurements agree and how finely the measuring instrument can discriminate.
A reliable investigation normally includes repeated trials.
Repeat Experiments
Suppose three measurements of the same reaction time are:
42.1 s
42.4 s
42.2 s
These results are very similar.
They suggest good repeatability.
Now suppose the results are:
41 s
58 s
39 s
There is much greater variation.
We should investigate the 58 s result before drawing a strong conclusion.
Calculating a Mean
Suppose three repeated reaction times are:
32 s
34 s
33 s
Mean:
(32 + 34 + 33) ÷ 3
= 33 s
Using repeated measurements and calculating a mean reduces the influence of small random variations.
Anomalous Results
An anomalous result is a measurement that does not fit the general pattern of the other results.
For example:
31.4 s
31.8 s
45.7 s
31.6 s
The 45.7 s measurement looks suspicious.
Possible causes include:
- stopwatch started late
- gas escaped before the apparatus was sealed
- incorrect volume of reactant
- temperature difference
- incorrect reading
- equipment malfunction
An anomalous result should not simply be deleted without justification.
The experiment should ideally be repeated.
Sources of Random Error
Random errors cause measurements to vary unpredictably.
Examples include:
- reaction-time differences when starting a stopwatch
- small differences in marble-chip size
- uncertainty when reading a gas syringe
- slight temperature fluctuations
- deciding exactly when a cross disappears
Random error can often be reduced by:
repeating measurements and calculating a mean
Sources of Systematic Error
A systematic error shifts measurements consistently in one direction.
Examples might include:
- a balance that is incorrectly zeroed
- a gas syringe with an incorrect scale
- a temperature probe consistently reading 2°C too high
Repeating the experiment does not automatically remove systematic error.
The equipment or method itself must be corrected.
Gas Leaks
Gas leaks are a major problem in gas-volume experiments.
If some gas escapes around the bung:
measured volume < actual volume produced
This may make the measured reaction rate appear lower than it actually is.
The apparatus should therefore be:
airtight
Connections should be checked before measurements begin.
Timing Error
A reaction may begin as soon as the reactants touch.
If it takes several seconds to:
- add the reactant
- fit the bung
- start the stopwatch
then part of the early reaction may not be recorded.
This is particularly important for very fast reactions.
A faster and more consistent starting procedure improves reliability.
Instrument Resolution
Every measuring instrument has a limit to how finely it can measure.
For example:
A balance reading to:
0.01 g
cannot reliably detect a mass change of:
0.001 g
A gas syringe marked every:
1 cm³
does not support readings such as:
27.384 cm³
Reporting more digits than the instrument can measure creates false precision.
Reading Scales Correctly
Measurements can be affected by viewing angle.
When reading scales:
- view at eye level
- avoid parallax error
- use consistent technique
- record appropriate significant figures
The same principle applies to:
- measuring cylinders
- gas syringes
- burettes
- thermometers
- balances
Controlling Variables
When comparing two reaction rates, only the variable being investigated should deliberately change.
For example, when investigating temperature, keep constant:
- reactant concentrations
- reactant volumes
- mass of solid
- surface area of solid
- apparatus
- measurement intervals
Otherwise, we may not know which variable caused the difference in rate.
Example: Fair Temperature Investigation
Suppose we compare a reaction at:
20°C
40°C
60°C
The other conditions should remain the same.
The graph shows that the higher-temperature reaction has the steeper initial gradient.
However, all three curves reach approximately the same final gas volume because the initial amount of limiting reactant is unchanged.
Evaluating the Best Method
Different reaction-rate methods have different strengths.
| Method | Main Measurement | Strength | Limitation |
|---|---|---|---|
| Gas syringe | Gas volume | Quantitative, many readings | Leaks can affect results |
| Water displacement | Gas volume | Simple equipment | Gas may dissolve in water |
| Mass loss | Mass | Easy continuous measurements | Poor for very light gases |
| Disappearing cross | Time to endpoint | Simple and inexpensive | Subjective endpoint |
| Colorimeter | Absorbance | Objective, continuous data | Requires specialised equipment |
| Concentration analysis | Concentration | Chemically informative | Can be more complicated |
There is no single "best" method for every reaction.
The best method depends on the reaction and the type of change that can be measured most reliably.
Which Method Would You Choose?
Reaction produces carbon dioxide
Gas syringe or mass loss could work.
Reaction produces hydrogen
Gas syringe may be better than mass loss because hydrogen has very little mass.
Reaction forms a cloudy precipitate
Disappearing cross or a light sensor could work.
Reaction changes from strongly coloured to colourless
Colorimetry may be useful.
Reaction does not produce gas or colour
Concentration sampling, conductivity or another chemical measurement may be needed.
Choosing an appropriate method is part of good experimental design.
Improving Reliability
A reaction-rate experiment can usually be improved by:
- repeating each condition several times
- calculating a mean
- investigating anomalous results
- using calibrated equipment
- using a consistent starting procedure
- controlling all other variables
- using regular measurement intervals
- reducing subjective judgement
- collecting more data points
- using data loggers where appropriate
These improvements make conclusions more defensible.
Digital Data Collection
Modern rate experiments can use electronic sensors and data loggers.
For example:
- pressure sensors
- temperature probes
- colorimeters
- electronic balances
- conductivity probes
- pH probes
A data logger can collect many measurements automatically.
This reduces the need for a person to read an instrument manually every few seconds and can produce a much more detailed reaction curve.
Continuous Monitoring
A gas syringe, balance connected to a computer, or colorimeter can allow continuous monitoring.
This provides information about the reaction throughout its progress.
Advantages include:
- many data points
- a complete reaction curve
- ability to estimate initial rate
- ability to calculate rate at different times
- easier identification of anomalies
Continuous monitoring is often more informative than recording only the time to one endpoint.
Endpoint Methods
The disappearing-cross method is an example of an endpoint method.
Instead of tracking the entire reaction, we measure:
time to reach a fixed observable condition
Endpoint methods are often:
- simple
- quick
- inexpensive
but may provide less detailed information than continuous monitoring.
Interpreting Experimental Data
Suppose two reactions give:
| Time (s) | Gas A (cm³) | Gas B (cm³) |
|---|---|---|
| 0 | 0 | 0 |
| 10 | 25 | 12 |
| 20 | 42 | 24 |
| 30 | 52 | 34 |
| 40 | 58 | 42 |
| 50 | 60 | 48 |
| 60 | 60 | 53 |
| 70 | 60 | 57 |
| 80 | 60 | 60 |
We can conclude:
Reaction A is faster.
Why?
It produces gas more rapidly and reaches 60 cm³ sooner.
Both reactions eventually produce:
60 cm³
Therefore, the final amount of gas is the same.
The difference is the rate, not the total amount produced.
Quantitative Comparison
For the first 20 seconds:
Reaction A:
42 ÷ 20 = 2.1 cm³ s⁻¹
Reaction B:
24 ÷ 20 = 1.2 cm³ s⁻¹
Therefore:
Reaction A has the greater average rate during the first 20 seconds.
This is stronger scientific evidence than saying:
"A looks faster."
Did You Know?
Modern chemical research often measures reaction rates using instruments capable of taking thousands or even millions of measurements.
Very fast reactions may occur too quickly for a person with a stopwatch to measure.
Scientists can instead use techniques involving:
- lasers
- spectroscopy
- rapid electronic detectors
- computer-controlled sensors
At the school level, a gas syringe and stopwatch demonstrate the same fundamental idea:
measure how much something changes and how long the change takes.
Common Mistakes
"The experiment with the most gas is always the fastest."
Incorrect. Final quantity and rate are different.
"A shorter disappearing-cross time means a lower rate."
Incorrect.
For the same endpoint:
shorter time = faster rate
and:
larger 1/time value = faster relative rate
"One measurement is enough to prove a result."
Usually weak evidence. Repeated trials improve reliability.
"Repeating an experiment fixes every error."
Incorrect.
Repeats help reduce random error but do not necessarily correct systematic error.
"A gas syringe measures reaction rate directly."
Not quite.
It measures gas volume.
Reaction rate is calculated from how that gas volume changes with time.
"A flat graph means the reaction is still occurring slowly."
If the measured product-time graph is truly horizontal, the measured rate at that stage is:
zero
"More decimal places always make data better."
Incorrect.
Measurements should match the resolution of the instrument.
A Good Evaluation Statement
Instead of writing:
"The experiment was accurate."
A stronger evaluation might say:
"The three repeated trials produced similar gas volumes, suggesting good repeatability. However, some carbon dioxide may have escaped before the bung was fitted, which could cause the measured gas volumes to be lower than the true values."
This identifies:
- evidence of reliability
- a specific limitation
- the likely effect of the limitation
That is much stronger scientific evaluation.
A Useful Evaluation Framework
When evaluating a reaction-rate experiment, ask:
Was the method appropriate?
Could the measured quantity show the progress of the reaction clearly?
Were variables controlled?
Was only one variable deliberately changed?
Were measurements repeated?
Could a mean be calculated?
Were there anomalies?
Were unusual values investigated?
Was the measuring equipment suitable?
Was its resolution sufficient?
Could material escape unexpectedly?
Gas leaks or splashing may affect results.
Was the endpoint subjective?
Could a sensor make it more objective?
Was enough data collected?
More measurements usually provide a clearer reaction curve.
Key Terms
Reaction rate – Change in the amount or concentration of a reactant or product per unit time.
Average rate – Rate calculated over a particular time interval.
Instantaneous rate – Rate at one specific moment.
Initial rate – Reaction rate at the beginning of a reaction.
Gradient – Slope of a graph; often used to calculate rate.
Gas syringe – Apparatus used to collect and measure gas volume.
Precipitate – Insoluble solid formed during a reaction.
Endpoint – A defined observation used to indicate that a particular stage of an experiment has been reached.
Colorimeter – Instrument that measures the absorption or transmission of light through a sample.
Reliability – The extent to which repeated measurements give similar results.
Repeatability – Agreement between repeated measurements made using the same method and equipment.
Anomalous result – A result that does not fit the general pattern.
Random error – Unpredictable variation between measurements.
Systematic error – Consistent error that shifts measurements in the same direction.
Resolution – Smallest change that a measuring instrument can distinguish.
Key Takeaways
- Reaction rates are measured by monitoring a quantity that changes with time.
- The basic relationship is:
Rate = change in quantity ÷ time
- Gas-producing reactions can be monitored using a gas syringe.
- Gas can also be collected by water displacement.
- Reactions releasing gas can sometimes be monitored by mass loss.
- Precipitate-forming reactions can be investigated using the disappearing-cross method.
- Colour changes can be monitored quantitatively using a colorimeter.
- Continuous monitoring provides multiple data points throughout a reaction.
- Endpoint methods measure the time required to reach one defined condition.
- Average rates can be calculated from experimental data.
- The gradient of a reaction graph gives information about reaction rate.
- A steeper gradient usually represents a faster rate.
- A horizontal product-time graph represents a rate of zero.
- Reaction rates should be compared using numerical evidence rather than qualitative observations alone.
- Repeated trials and means improve reliability.
- Anomalous values should be investigated rather than automatically discarded.
- Random and systematic errors affect experiments differently.
- Gas leaks, timing delays, subjective endpoints and limited instrument resolution can reduce data quality.
- A fair comparison requires other important variables to be controlled.
- The best measurement method depends on the particular reaction.
- Good scientific evaluation identifies both strengths and specific limitations of the experimental method.