Rates of Reaction
| Sitio: | Young Education |
| Curso: | Chemical Energetics |
| Libro: | Rates of Reaction |
| Impreso por: | Guest user |
| Fecha: | lunes, 5 de octubre de 2026, 04:04 |
1. What Is Reaction Rate?
Learning outcomes
- I can define reaction rate.
- I can explain how reaction rate is measured.
- I can compare fast and slow reactions.
- I can identify factors that influence reaction rate.
- I can interpret reaction rate data.
What Is Reaction Rate?
Chemical reactions do not all happen at the same speed.
Some reactions happen almost instantly, while others may take minutes, hours, days, or even years.
The reaction rate describes how quickly reactants are converted into products.
More precisely:
Reaction rate is the change in the amount or concentration of a reactant or product per unit time.
For example, we might measure:
- how quickly a reactant disappears
- how quickly a product forms
- how quickly gas is produced
- how quickly mass decreases
- how quickly concentration changes
The steeper curve represents a faster reaction because product is being produced more quickly.
Chemical Kinetics
The study of reaction rates is called chemical kinetics.
Kinetics helps chemists answer questions such as:
- How quickly will a reaction occur?
- Why is one reaction faster than another?
- How does temperature affect the rate?
- How does concentration affect the rate?
- Can a catalyst make the reaction faster?
- How can we measure the reaction experimentally?
Reaction rates are extremely important in industry, biology, medicine, food science, environmental science and engineering.
Fast and Slow Reactions
Chemical reactions can occur over enormously different timescales.
A reaction may be:
very fast
such as some combustion or explosive reactions,
or:
very slow
such as rusting.
A fast reaction produces a large change in a short period of time.
A slow reaction produces the same kind of change over a longer period of time.
Examples of Fast Reactions
Examples of relatively fast reactions include:
- burning fuels
- fireworks
- some acid-base reactions
- some precipitation reactions
- combustion of hydrogen
- some metal-acid reactions
For example:
Mg + 2HCl → MgCl₂ + H₂
Magnesium can react rapidly with hydrochloric acid, producing hydrogen gas.
The faster hydrogen gas is produced, the faster the chemical reaction is occurring.
Examples of Slow Reactions
Some chemical reactions occur much more slowly.
Examples include:
- rusting of iron
- weathering of rocks
- some decomposition reactions
- slow oxidation of foods
- chemical changes involved in ageing materials
Rust may take days, months or years to become obvious.
A slow reaction does not mean that no reaction is occurring.
It means the change per unit time is relatively small.
Measuring Reaction Rate
To measure a reaction rate, we need to observe some quantity that changes as the reaction proceeds.
A simple general equation is:
Reaction rate = change in quantity ÷ change in time
The quantity might be:
- concentration
- mass
- volume of gas
- amount of substance
- colour intensity
- cloudiness
For concentration:
Rate = change in concentration ÷ time
Reaction rate expressed using concentration is commonly measured in units such as:
mol dm⁻³ s⁻¹
or:
mol L⁻¹ s⁻¹.
Measuring the Disappearance of a Reactant
One way of measuring reaction rate is to monitor how quickly a reactant disappears.
Imagine a reactant has concentration:
1.00 mol dm⁻³
at the start.
After 20 seconds its concentration has fallen to:
0.60 mol dm⁻³
The concentration change is:
1.00 − 0.60 = 0.40 mol dm⁻³
Average rate of reactant disappearance:
0.40 ÷ 20
= 0.020 mol dm⁻³ s⁻¹
On a concentration-time graph, reactant concentration normally decreases as the reaction proceeds.
Measuring the Formation of a Product
Instead of measuring a disappearing reactant, we can measure a product that forms.
Suppose a reaction produces:
60 cm³ of gas
in:
30 s
Average rate:
60 ÷ 30
= 2.0 cm³ s⁻¹
The rate can therefore be expressed as:
2.0 cm³ of gas per second

A steep part of the graph indicates rapid gas production.
A shallow part indicates slower gas production.
A horizontal section means no additional gas is being produced.
Why Does the Rate Usually Change?
Many reactions are fastest near the beginning.
This is because there are usually more reactant particles present at the start.
As reactants are consumed:
reactant concentration decreases
so:
collisions become less frequent
and the reaction often slows down.
Eventually, one of the reactants may be used up.
Then:
reaction rate = 0
Notice how the curve begins steep and gradually becomes flatter.
Measuring Gas Volume
If a reaction produces a gas, a gas syringe can be used.
For example:
Mg + 2HCl → MgCl₂ + H₂
The hydrogen gas can be collected in a gas syringe.
Measurements might be recorded every:
10 s
or:
20 s
For example:
| Time (s) | Gas Volume (cm³) |
|---|---|
| 0 | 0 |
| 10 | 18 |
| 20 | 31 |
| 30 | 40 |
| 40 | 46 |
| 50 | 49 |
| 60 | 50 |
The gas volume increases rapidly at first and then levels off.
Why Does the Gas-Volume Graph Level Off?
Consider this graph:
At first:
the gradient is large
so:
reaction rate is high
Later:
the gradient becomes smaller
so:
reaction rate decreases
Finally:
gradient = 0
so:
reaction has stopped
The flat section does not mean the gas has disappeared.
It means no additional gas is being produced.
Measuring Rate by Mass Loss
If a reaction produces a gas that escapes from the apparatus, the total mass of the apparatus may decrease.
A common example is:
CaCO₃ + 2HCl → CaCl₂ + H₂O + CO₂
Carbon dioxide escapes into the air.
The mass therefore decreases.

A balance can be used to record the mass at regular time intervals.
A loose cotton wool plug can reduce liquid spray while still allowing the gas to escape.
Example: Mass Loss
Suppose the initial mass is:
150.0 g
After 40 seconds:
148.8 g
Mass lost:
150.0 − 148.8 = 1.2 g
Average rate of mass loss:
1.2 ÷ 40
= 0.030 g s⁻¹
The rate is:
0.030 g s⁻¹
This provides a convenient measure of how quickly the gas-producing reaction is occurring.
Measuring a Change in Appearance
Not every rate experiment requires a gas syringe or balance.
Sometimes a visible change can be timed.
A classic example is the reaction between sodium thiosulfate and hydrochloric acid.
Sulfur forms as a solid precipitate, making the mixture increasingly cloudy.
A cross is placed underneath the flask.
The time taken for the cross to disappear is measured.
A shorter time means:
faster reaction
A longer time means:
slower reaction
For this type of experiment, a simple relative measure is often:
Rate ∝ 1 ÷ time
Comparing Fast and Slow Reactions on a Graph
Two reactions may produce the same final amount of product but at different rates.
The faster reaction:
- rises more steeply
- reaches the plateau sooner
The slower reaction:
- rises more gradually
- takes longer to reach the plateau
If both finish at the same height, they have produced the same final amount of product.
The difference is how quickly they got there.
Gradient and Reaction Rate
The gradient, or slope, of a reaction graph tells us how quickly the measured quantity is changing.
For a product-time graph:
steeper gradient = faster reaction
shallower gradient = slower reaction
horizontal line = zero rate
Gradient can be calculated using:
Gradient = change in y ÷ change in x
For a gas-volume graph:
Rate = change in gas volume ÷ change in time
Worked Example: Rate from a Graph
Suppose gas volume increases from:
20 cm³
to:
50 cm³
between:
10 s
and:
30 s
Change in volume:
50 − 20 = 30 cm³
Change in time:
30 − 10 = 20 s
Average rate:
30 ÷ 20
= 1.5 cm³ s⁻¹
Therefore:
average reaction rate = 1.5 cm³ s⁻¹
Average Rate
An average reaction rate describes the rate over a particular time interval.
For example:
Between 0 and 20 s:
Rate = change ÷ 20 s
This does not mean the reaction was occurring at exactly that rate at every instant during those 20 seconds.
It is an average.
Instantaneous Rate
The instantaneous rate is the rate at a specific moment.
On a curved graph, this can be estimated by drawing a tangent at the point of interest and finding its gradient.

A steep tangent has a large gradient and represents a faster rate.
A shallow tangent represents a slower rate.
For an introductory course, the most important concept is:
slope tells us rate.
Initial Rate
The initial rate is the reaction rate at the very beginning of the reaction.
This is often particularly useful because reactant concentrations are known accurately at the start.
For many reactions, the initial rate is also the greatest rate because reactant concentrations are highest at the beginning.
The steeper initial curve corresponds to the faster initial reaction.
Reactant and Product Graphs
During a reaction:
reactant concentration normally decreases
while:
product concentration normally increases
At the start:
there is a lot of reactant and little product.
As time passes:
reactant is consumed and product accumulates.
Eventually, if the reaction reaches completion:
the curves level off.
Why Do Chemical Reactions Need Collisions?
For particles to react, they usually need to encounter one another.
This idea forms the basis of collision theory.
Reacting particles must:
- collide
- collide with sufficient energy
- often collide with a suitable orientation
Not every collision causes a reaction.
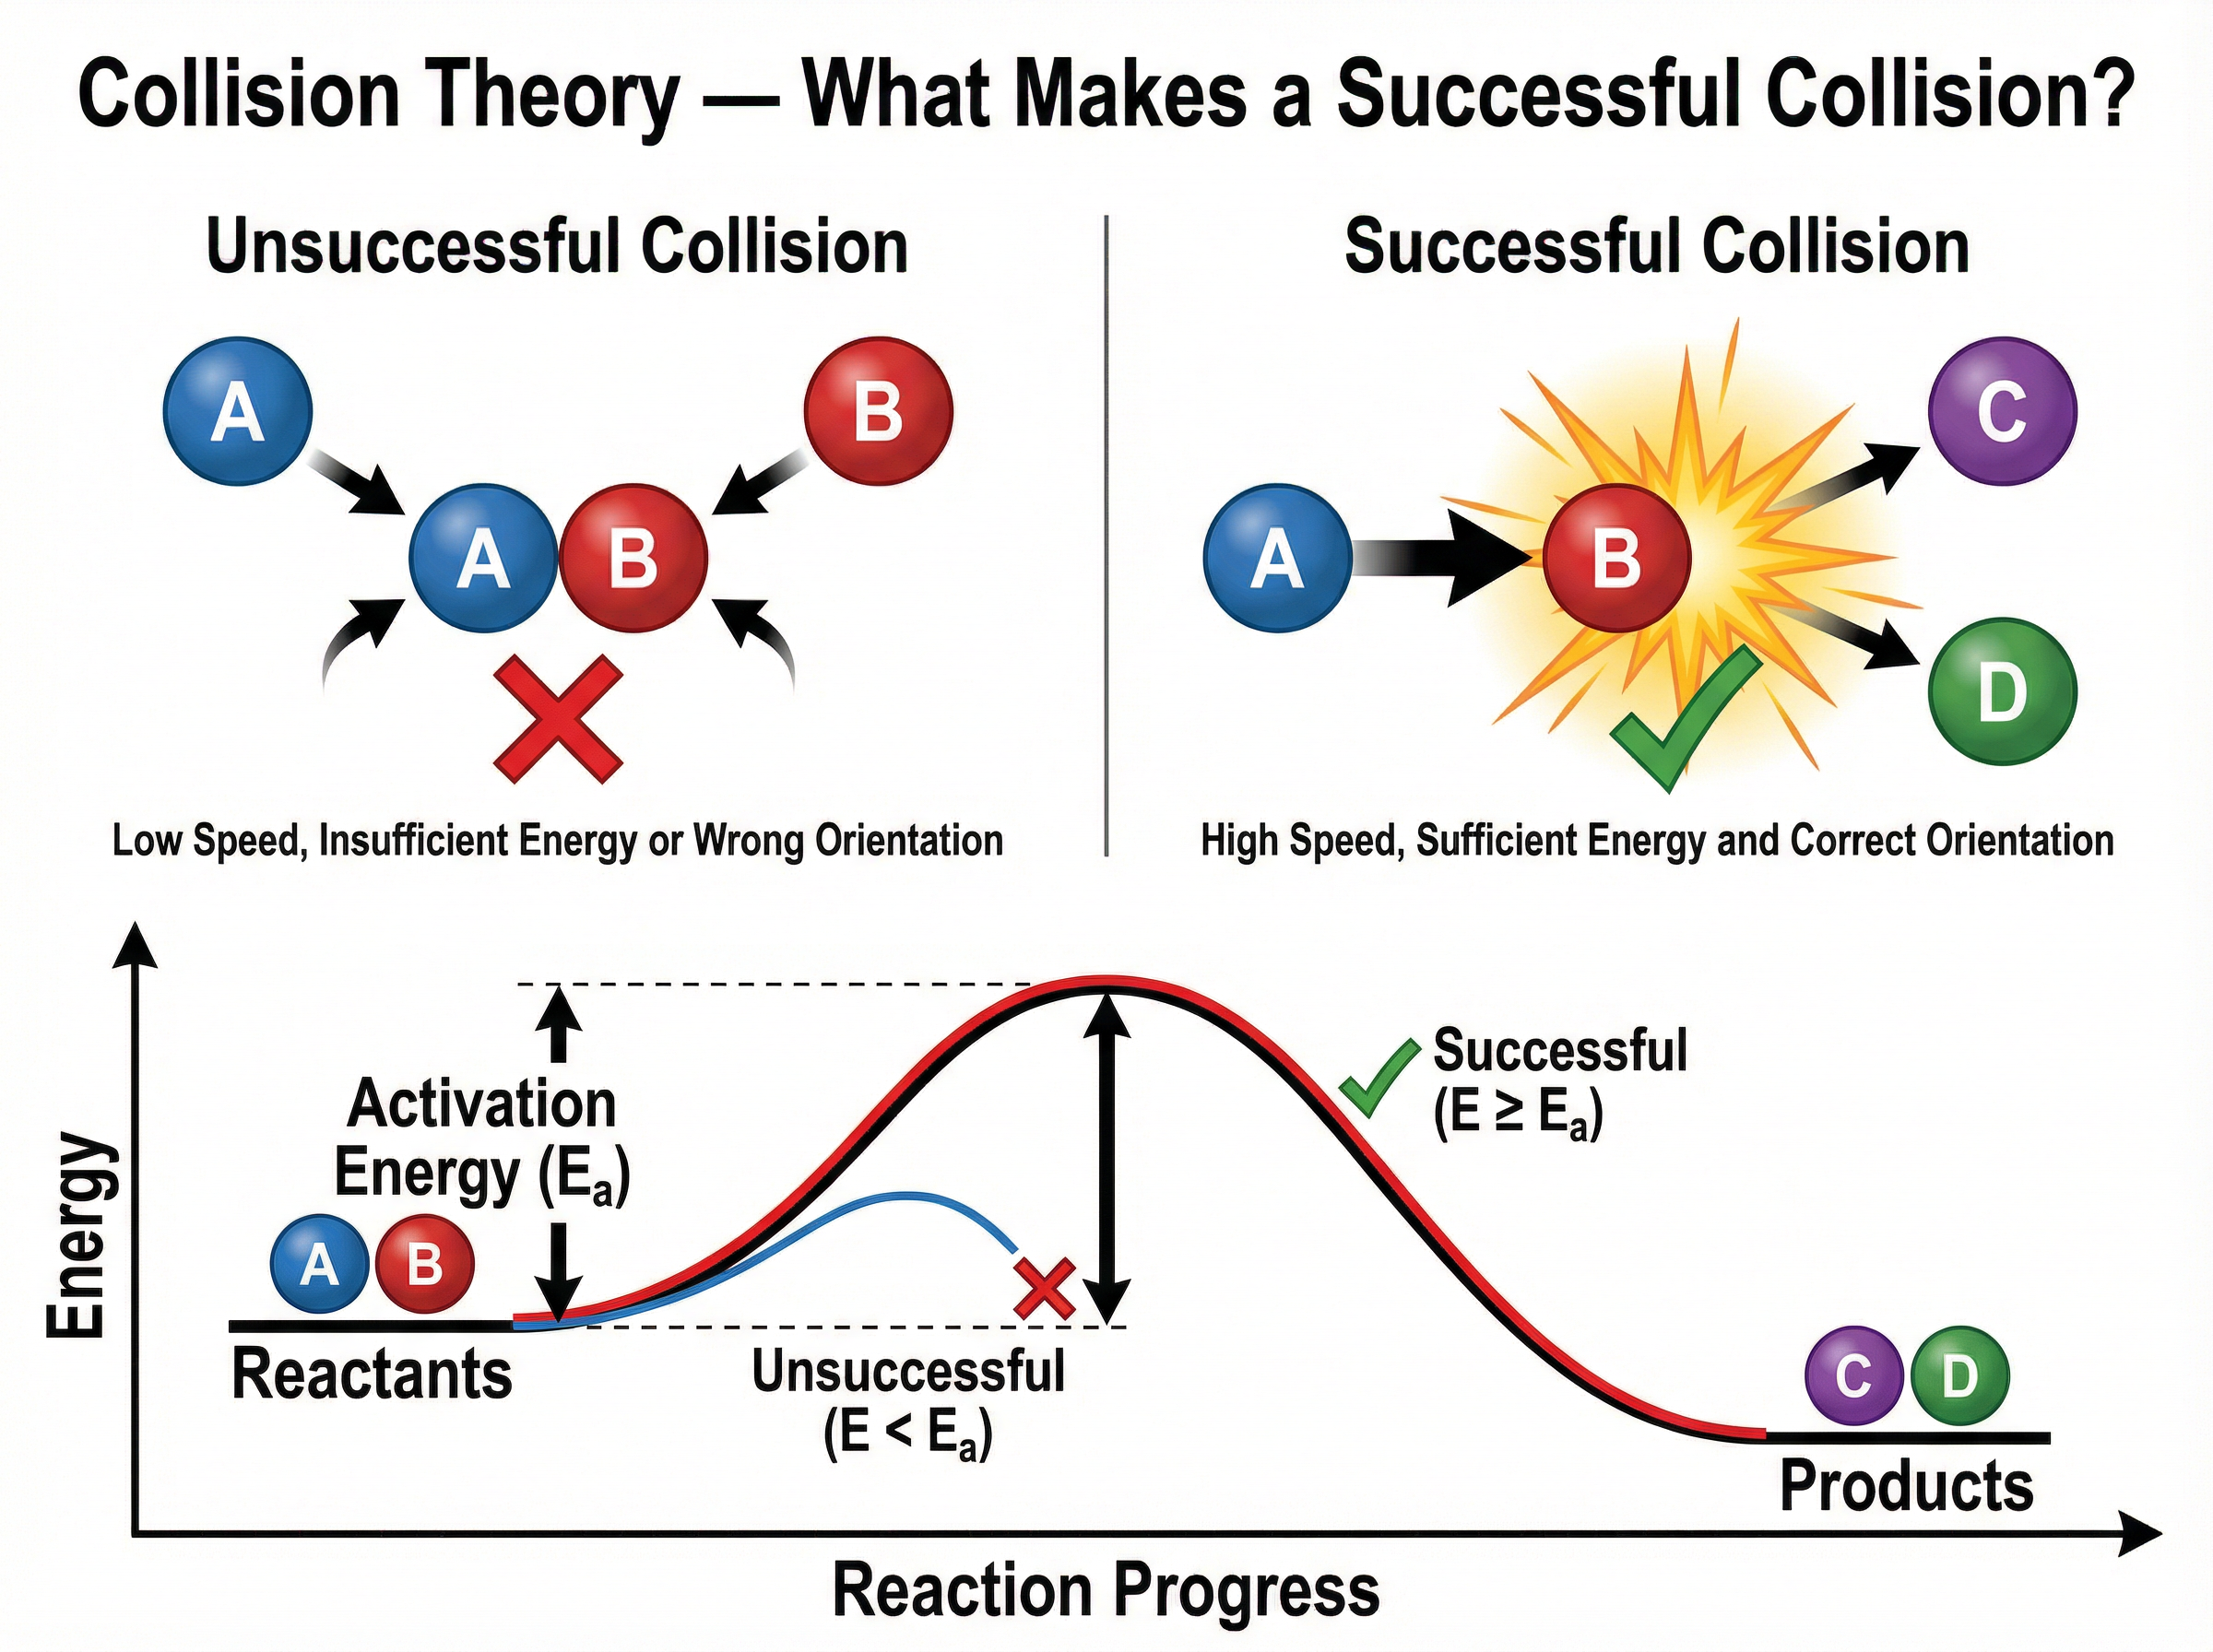
A collision that leads to reaction is called a successful collision.
What Determines Reaction Rate?
Reaction rate depends strongly on the number of successful collisions per unit time.
If successful collisions happen frequently:
reaction rate is high
If successful collisions happen rarely:
reaction rate is low
Several factors can change the frequency or effectiveness of collisions.
Main Factors Affecting Reaction Rate
Important factors include:
- temperature
- concentration
- pressure of gases
- surface area of solids
- catalysts
- nature of the reactants

These factors will be examined in more detail later in the unit.
For now, the key idea is:
anything that increases the frequency of successful collisions can increase reaction rate.
Effect of Concentration
Increasing the concentration of a reactant means there are more reactant particles in the same volume.
This usually causes:
more frequent collisions
and therefore:
more successful collisions per second
so:
reaction rate increases
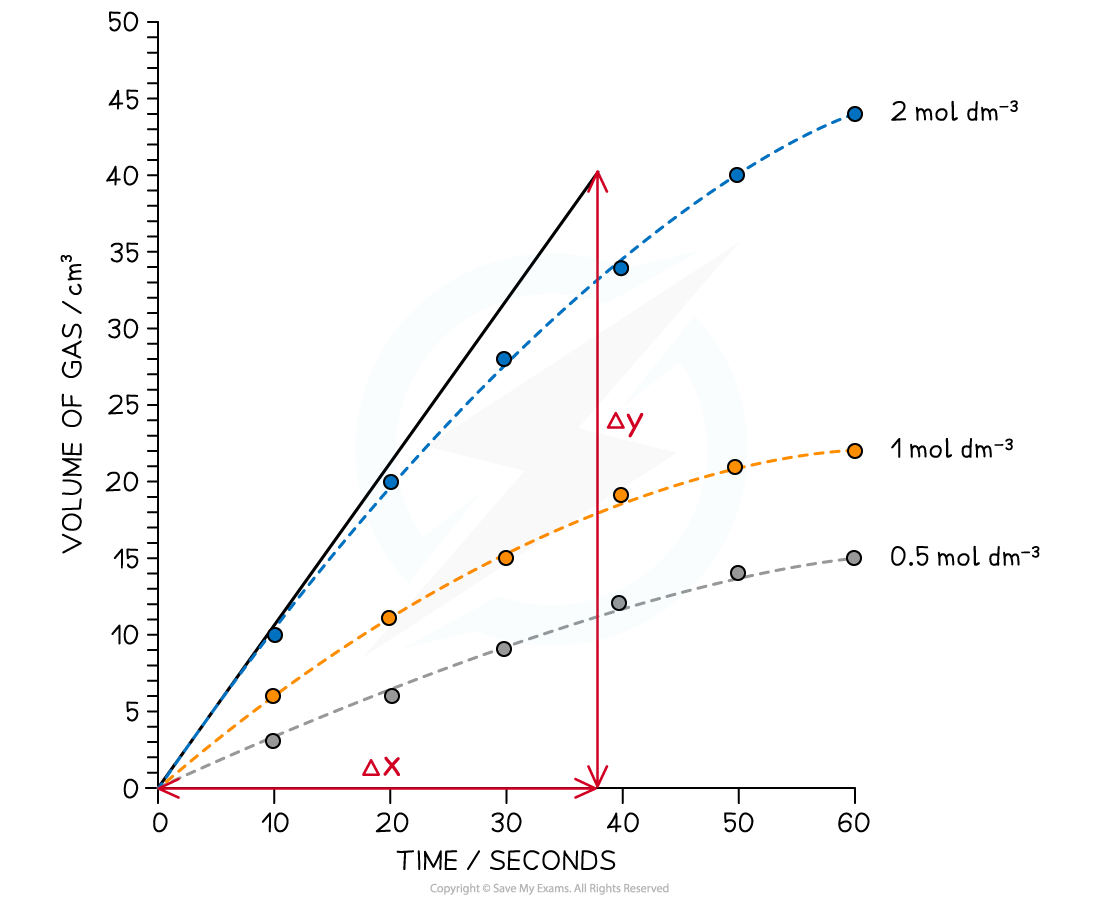
Notice that the higher-concentration reaction has the steeper initial gradient.
Effect of Temperature
Increasing temperature gives particles more kinetic energy.
They move faster.
This can increase reaction rate in two important ways:
- collisions occur more frequently
- a greater fraction of collisions have enough energy to react
Higher temperature therefore generally produces a faster reaction.
Effect of Surface Area
When a solid reactant is involved, only particles at its exposed surface can directly collide with particles from another reactant.
Breaking a solid into smaller pieces increases its total surface area.
That exposes more particles.
Therefore:
larger surface area → more collisions → faster reaction
Powders usually react more rapidly than large pieces of the same mass because they have a much larger total exposed surface area.
Effect of a Catalyst
A catalyst increases reaction rate without being consumed overall.
A catalyst provides an alternative reaction pathway with a lower activation energy.
This allows a greater fraction of collisions to be successful.
A catalyst changes the rate, but it does not change the overall amount of reactant or product expected from the same limiting reactant.
Faster Does Not Mean More Product
This is an important distinction.
Suppose the same quantity of reactant is used in two experiments.
Experiment A is faster.
Experiment B is slower.
If both eventually react completely, they may produce the same final amount of product.
The faster reaction simply reaches the final amount sooner.
So:
reaction rate tells us how quickly something happens
not necessarily:
how much product is ultimately produced.
Reading Reaction-Rate Data
Consider this table:
| Time (s) | Volume of Gas (cm³) |
|---|---|
| 0 | 0 |
| 10 | 20 |
| 20 | 35 |
| 30 | 45 |
| 40 | 51 |
| 50 | 54 |
| 60 | 55 |
What can we learn?
Between 0 and 10 seconds:
20 cm³ gas forms.
Between 50 and 60 seconds:
only 1 cm³ forms.
Therefore:
the reaction is much faster near the beginning than near the end.
Calculating Rates from the Data
From 0 to 10 s:
Rate = 20 ÷ 10
= 2.0 cm³ s⁻¹
From 50 to 60 s:
Rate = (55 − 54) ÷ 10
= 0.10 cm³ s⁻¹
Comparison:
2.0 cm³ s⁻¹ > 0.10 cm³ s⁻¹
Therefore, the reaction was much faster during the first ten seconds.
Turning Data into a Graph
The table can be plotted as:
volume of gas vs time
The result would resemble this:
The graph tells the story of the reaction:
At first:
steep slope → fast reaction
Later:
shallower slope → slower reaction
Finally:
horizontal → reaction finished
Comparing Two Data Sets
Suppose two experiments give:
| Time (s) | Reaction A Gas Volume (cm³) | Reaction B Gas Volume (cm³) |
|---|---|---|
| 0 | 0 | 0 |
| 10 | 30 | 15 |
| 20 | 47 | 28 |
| 30 | 55 | 39 |
| 40 | 60 | 48 |
| 50 | 60 | 55 |
| 60 | 60 | 60 |
Reaction A reaches:
60 cm³ at 40 s
Reaction B reaches:
60 cm³ at 60 s
Therefore:
Reaction A is faster.
Both produce:
60 cm³ total gas
so the final amount of product is the same.
Reaction Rate and Units
The units of reaction rate depend on what is being measured.
If measuring mass:
g s⁻¹
If measuring gas volume:
cm³ s⁻¹
If measuring concentration:
mol dm⁻³ s⁻¹
If measuring amount of substance:
mol s⁻¹
So there is no single rate unit for every school-level experiment.
The units must match the measured quantity and the time unit.
Reaction Rate in Everyday Life
Reaction rate matters in many situations.
Food
Refrigeration slows many chemical and biological processes.
Cooking
Higher temperatures generally make chemical changes occur faster.
Medicines
Reaction and decomposition rates affect how drugs are manufactured and stored.
Engines
Fuel must react rapidly enough to release useful energy.
Corrosion
Engineers try to slow oxidation and rusting.
Industry
Factories may use catalysts and controlled temperatures to produce chemicals quickly and economically.
Why Do We Refrigerate Food?
Food spoilage involves many chemical and biological reactions.
Reducing temperature generally decreases reaction rate.
Particles have less kinetic energy, and fewer collisions have sufficient energy to produce chemical change.
This is one reason food lasts longer in a refrigerator than at room temperature.
The reactions have not completely stopped.
They have been slowed down.
Why Can Powdered Materials React Quickly?
Consider the same mass of calcium carbonate as:
one large piece
versus:
many small pieces
The smaller pieces have a greater total surface area.
More calcium carbonate particles are exposed to the acid.
Therefore, more collisions can occur at the same time.
This explains why finely divided substances can sometimes react very rapidly.
Reaction Rate and Safety
Reaction rate is not merely an academic idea.
It can also affect safety.
A reaction that releases energy slowly may be manageable.
The same chemical change occurring extremely rapidly could produce:
- rapid heating
- high pressures
- large amounts of gas
- fire
- an explosion
Understanding reaction kinetics helps scientists and engineers control reactions safely.
Reaction Rate vs Reaction Energy
Do not confuse reaction rate with reaction energy.
Reaction rate asks:
How quickly does the reaction occur?
Reaction energy asks:
How much energy is absorbed or released?
A highly exothermic reaction could still be slow if it has a large activation-energy barrier.
A less energetic reaction could occur much faster.
The two ideas are related but are not the same.
Reaction Rate vs Activation Energy
Activation energy is the minimum energy required for a successful reaction pathway.
A reaction with a large activation-energy barrier may be slow because relatively few particle collisions have enough energy.
A catalyst can lower that barrier.
Lowering activation energy allows a larger fraction of collisions to become successful.
Worked Example 1: Product Formation
A reaction produces:
48 cm³ of gas
in:
24 s
Calculate the average rate.
Rate = change in volume ÷ time
Rate = 48 ÷ 24
Rate = 2.0 cm³ s⁻¹
Therefore:
Average rate = 2.0 cm³ s⁻¹
Worked Example 2: Mass Loss
A flask loses:
3.6 g
in:
120 s
Rate:
3.6 ÷ 120
= 0.030 g s⁻¹
Therefore:
Average rate = 0.030 g s⁻¹
Worked Example 3: Concentration Change
A reactant concentration decreases from:
0.80 mol dm⁻³
to:
0.50 mol dm⁻³
in:
30 s
Change in concentration:
0.80 − 0.50
= 0.30 mol dm⁻³
Rate of disappearance:
0.30 ÷ 30
= 0.010 mol dm⁻³ s⁻¹
Worked Example 4: Comparing Rates
Reaction A produces:
100 cm³ gas in 50 s
Reaction B produces:
100 cm³ gas in 80 s
Average rate A:
100 ÷ 50 = 2.0 cm³ s⁻¹
Average rate B:
100 ÷ 80 = 1.25 cm³ s⁻¹
Therefore:
Reaction A is faster.
Worked Example 5: Interpreting a Graph
Suppose two curves reach the same plateau.
Curve A reaches the plateau in:
30 seconds
Curve B reaches it in:
70 seconds
We can conclude:
- A is faster
- B is slower
- both produce the same final amount of product
We cannot automatically conclude that Reaction A released more energy.
Rate and energy are different properties.
What Does a Flat Graph Mean?
Students sometimes interpret a flat section as a "slow reaction."
A completely horizontal product-time line actually means:
no further change is occurring
Therefore:
rate = 0
The reaction may have stopped because:
- a limiting reactant has been used up
- the system has reached equilibrium
- conditions no longer allow measurable progress
For simple introductory experiments, it is commonly because one reactant has been used up.
Common Misconceptions
"A fast reaction makes more product."
Not necessarily. A faster reaction may simply produce the same final quantity in less time.
"A flat graph means the reaction is slow."
A flat product-time graph means the rate is zero at that stage.
"Reaction rate is the amount of product formed."
Not by itself. Rate involves change divided by time.
"All reactions start at the same rate."
Incorrect. Rates depend on reactants and conditions.
"A reaction that releases lots of energy must be fast."
Incorrect. Reaction energy and reaction rate are different concepts.
"Every collision causes a reaction."
Incorrect. Only suitable collisions produce reaction.
"A catalyst makes more product."
Not necessarily. A catalyst mainly changes how quickly the system reaches its final state.
Did You Know?
Reaction rates can vary by an enormous amount.
Some reactions occur so rapidly that they appear almost instantaneous.
Others can proceed so slowly that their effects become noticeable only after years.
The difference often comes down to the frequency of successful particle collisions and the size of the activation-energy barrier.
This is why chemists can sometimes dramatically alter reaction rate without changing the chemical equation itself.
Interpreting Reaction Rate Data: Quick Guide
When looking at a table or graph, ask:
What is being measured?
Mass? Gas volume? Concentration?
What is the time unit?
Seconds? Minutes?
Where is the graph steepest?
That is where the measured quantity is changing most rapidly.
Where does the graph flatten?
The rate is approaching or has reached zero.
Do two curves reach the same plateau?
If so, they may produce the same final amount but at different rates.
Which curve reaches the plateau first?
That reaction is faster.
Key Terms
Reaction rate – The change in amount or concentration of a reactant or product per unit time.
Chemical kinetics – The study of reaction rates and the factors that influence them.
Reactant – A substance consumed during a chemical reaction.
Product – A substance produced during a chemical reaction.
Average rate – Change in a measured quantity divided by a time interval.
Instantaneous rate – Rate at a particular moment during a reaction.
Initial rate – Rate at the beginning of a reaction.
Gradient – The slope of a graph; for many reaction graphs it indicates rate.
Collision theory – A model explaining reactions in terms of collisions between particles.
Successful collision – A collision that results in a chemical reaction.
Activation energy – The minimum energy barrier that must be overcome for a reaction to occur.
Catalyst – A substance that increases reaction rate without being consumed overall.
Key Takeaways
- Reaction rate describes how quickly a chemical reaction occurs.
- Reaction rate can be defined as the change in amount or concentration per unit time.
- Reactant quantities normally decrease during a reaction.
- Product quantities normally increase.
- Rate can be measured using:
- concentration
- mass change
- gas volume
- visible changes
- A steeper reaction graph indicates a faster rate.
- A horizontal product-time graph indicates a rate of zero.
- Many reactions are fastest at the start and slow as reactants are consumed.
- Average rate can be calculated using:
Rate = change in quantity ÷ change in time
- Common rate units include:
- g s⁻¹
- cm³ s⁻¹
- mol dm⁻³ s⁻¹
- Reaction rate depends on the number of successful collisions occurring per unit time.
- Important factors affecting reaction rate include:
- temperature
- concentration
- pressure
- surface area
- catalysts
- nature of the reactants
- Faster reactions do not necessarily produce more product.
- Reaction rate is not the same as reaction energy.
- Tables and graphs provide quantitative evidence that can be used to compare reaction rates.
2. Measuring Reaction Rates
Learning outcomes
- I can describe methods used to measure reaction rates.
- I can collect data from reaction rate experiments.
- I can calculate average reaction rates.
- I can compare reaction rates using experimental data.
- I can evaluate the reliability of reaction rate measurements.
Why Do We Measure Reaction Rate?
Knowing that one reaction is "fast" and another is "slow" is useful, but scientists usually need quantitative evidence.
To measure reaction rate, we monitor a quantity that changes as the reaction takes place.
For example, we might measure:
- the volume of gas produced
- the mass lost from a reaction mixture
- the concentration of a reactant or product
- the amount of precipitate formed
- a change in colour
- the time required to reach a particular endpoint
The general relationship is:
Rate = change in measured quantity ÷ time taken
The most appropriate method depends on what can be measured reliably during the particular reaction.
What Makes a Good Rate Measurement?
A useful reaction-rate measurement needs two things:
1. A quantity that changes as the reaction proceeds
and
2. Accurate measurements of time
For example:
gas volume vs time
mass vs time
concentration vs time
A single observation such as "there were lots of bubbles" is not normally enough for a good quantitative investigation.
Method 1: Measuring Gas Volume with a Gas Syringe
One of the most useful methods is to measure the volume of gas produced.
This works when one of the reaction products is a gas.
For example:
CaCO₃ + 2HCl → CaCl₂ + H₂O + CO₂
Carbon dioxide is produced.
The reaction flask can be connected to a gas syringe.

As carbon dioxide forms, it travels through the delivery tube and pushes the syringe plunger outward.
The gas volume can be recorded at regular intervals.
For example:
every 10 seconds
or:
every 20 seconds
Gas-syringe methods allow gas production to be followed throughout the reaction.
Collecting Gas-Syringe Data
A results table might look like this:
| Time (s) | Volume of CO₂ (cm³) |
|---|---|
| 0 | 0 |
| 10 | 18 |
| 20 | 31 |
| 30 | 41 |
| 40 | 48 |
| 50 | 52 |
| 60 | 54 |
| 70 | 55 |
Notice that the increase in gas volume becomes smaller with time.
This indicates that the reaction is slowing down.
Plotting Gas Volume Against Time
The data can be plotted as:
Volume of gas vs time

At the beginning:
large gradient → fast reaction
Later:
smaller gradient → slower reaction
Eventually:
horizontal graph → no more gas being produced
The gradient of a gas-volume graph therefore gives a measure of the reaction rate.
Average Rate from Gas Volume
Suppose:
72 cm³
of gas is produced in:
40 s
Average rate:
Rate = 72 ÷ 40
Rate = 1.8 cm³ s⁻¹
Therefore:
Average reaction rate = 1.8 cm³ s⁻¹
The units reflect what was measured:
cm³ s⁻¹
Rate Over a Particular Time Interval
We do not always calculate rate from the beginning.
Suppose:
At 20 s:
30 cm³
At 50 s:
54 cm³
Change in volume:
54 − 30 = 24 cm³
Change in time:
50 − 20 = 30 s
Therefore:
Average rate = 24 ÷ 30
= 0.80 cm³ s⁻¹
This is the average rate between 20 s and 50 s.
Gas Collection by Water Displacement
A gas syringe is not the only way to collect gas.
Gas can also be collected over water using an inverted measuring cylinder.
The gas enters the measuring cylinder and displaces the water.
The volume of displaced water corresponds approximately to the volume of gas collected.
This method is useful for gases that do not dissolve significantly or react rapidly with water.
Gas Syringe vs Water Displacement
A gas syringe often gives a direct volume reading.
Water displacement can also work well, but some gases dissolve in water, which may reduce the measured volume.
Gas collection can also be affected by:
- leaks
- gas escaping before the bung is fitted
- friction in the gas-syringe plunger
- reading the scale incorrectly
- delays when starting the timer
These become important when evaluating experimental reliability.
Method 2: Measuring Loss of Mass
If a reaction releases a gas into the air, the mass of the reaction system decreases.
Consider:
CaCO₃ + 2HCl → CaCl₂ + H₂O + CO₂
The carbon dioxide escapes.
A conical flask can be placed on an electronic balance.
As CO₂ leaves the flask:
mass decreases
The faster the mass decreases:
the faster the reaction
A cotton-wool plug can reduce loss of liquid spray while still allowing gas to escape.
Example Mass-Loss Data
Suppose a reaction gives:
| Time (s) | Mass (g) |
|---|---|
| 0 | 125.80 |
| 20 | 125.25 |
| 40 | 124.86 |
| 60 | 124.62 |
| 80 | 124.49 |
| 100 | 124.45 |
| 120 | 124.45 |
The mass decreases rapidly near the beginning.
Later, the change becomes smaller.
Eventually:
mass stays constant
This indicates that the measurable gas-producing reaction has stopped.
Calculating Rate from Mass Loss
Initial mass:
125.80 g
Mass after 40 s:
124.86 g
Mass lost:
125.80 − 124.86
= 0.94 g
Average rate:
0.94 ÷ 40
= 0.0235 g s⁻¹
Therefore:
Average rate of mass loss = 0.0235 g s⁻¹
A Mass-Loss Graph
Mass-loss data can also be represented graphically.
A steep gradient indicates rapid mass loss.
A shallow gradient indicates slower mass loss.
A flat section indicates that the measured mass is no longer changing.
The same basic interpretation therefore applies to both mass and gas-volume graphs.
When Is Mass Loss a Good Method?
Mass loss is particularly useful when the escaping gas causes a measurable decrease in mass.
Carbon dioxide is often suitable.
Hydrogen can be less suitable because its mass is so small that the change may be difficult to detect accurately with an ordinary school balance.
This illustrates an important experimental principle:
Choose a measuring method that produces a change large enough for the instrument to detect reliably.
Method 3: The Disappearing Cross Method
Some reactions form a solid precipitate that causes a solution to become cloudy.
A classic example uses:
sodium thiosulfate + hydrochloric acid
Sulfur forms during the reaction.
The sulfur makes the mixture increasingly cloudy.
A black cross is placed underneath the flask.
The stopwatch is stopped when the cross can no longer be seen.
A shorter time means:
faster reaction
A longer time means:
slower reaction
The method is simple, but the endpoint is partly subjective because different observers may decide that the cross disappeared at slightly different times.
Using 1 ÷ Time as a Relative Rate
Suppose the same visual endpoint is used for every experiment.
A useful relative-rate measure is:
Relative rate = 1 ÷ time
For example:
Experiment A:
time = 20 s
Relative rate:
1 ÷ 20 = 0.050 s⁻¹
Experiment B:
time = 50 s
Relative rate:
1 ÷ 50 = 0.020 s⁻¹
Therefore:
Experiment A is faster.
The reciprocal-time method is a comparative measure and works only when every experiment uses the same endpoint.
Why Is the Disappearing Cross Less Precise?
The gas-syringe method provides many measurements:
0 s, 10 s, 20 s, 30 s, and so on.
The disappearing-cross experiment usually gives one main measurement:
time until the cross disappears
It also depends on human judgement.
One person might stop the timer at:
31.2 s
while another stops it at:
33.0 s
This makes the method less objective.
Improving the Disappearing Cross Method
Reliability can be improved by:
- using the same cross every time
- using the same flask
- using the same observer
- viewing from the same position
- using identical lighting conditions
- repeating each experiment
- calculating a mean
- identifying anomalous results
An even more objective approach is to use a light sensor or colorimeter.
Method 4: Measuring Colour Change
Some reactions involve coloured reactants or products.
A colorimeter measures how strongly a solution absorbs light.
The basic arrangement includes:
- a light source
- a filter or selected wavelength
- a cuvette containing the solution
- a detector
- a meter or data logger
If the coloured substance becomes less concentrated during the reaction, its absorbance will generally decrease.
Colorimetry can provide continuous quantitative data and avoids relying entirely on human judgement about colour changes.
Absorbance and Concentration
A calibration graph can relate absorbance to concentration.
Once the relationship is established, colorimeter measurements can be converted into concentrations.
This makes it possible to monitor:
concentration vs time
rather than relying only on a visible endpoint.
Method 5: Measuring Concentration Directly
For some reactions, samples can be taken at different times and analysed to determine concentration.
For example, scientists may use:
- titration
- conductivity
- pH measurements
- spectroscopy
- colorimetry
The rate can then be expressed as:
Rate = change in concentration ÷ change in time
Typical units are:
mol dm⁻³ s⁻¹
This is particularly important in more advanced chemical kinetics.
Collecting Good Experimental Data
A good results table should include:
the independent variable
the dependent variable
units
sensible measurement intervals
For example:
| Time (s) | Gas Volume (cm³) |
|---|---|
| 0 | 0 |
| 10 | 16 |
| 20 | 29 |
| 30 | 39 |
| 40 | 46 |
| 50 | 50 |
| 60 | 52 |
Measurements should normally be taken at regular intervals unless there is a good reason to do otherwise.
Why Take Several Measurements?
Suppose you measured only:
0 cm³ at 0 s
and:
52 cm³ at 60 s
You could calculate an overall average rate.
But you would not know how the rate changed during the reaction.
Taking many measurements allows us to construct a curve.
That curve can show:
- initial rate
- slowing of the reaction
- when the reaction finishes
- anomalous data
- differences between experiments
Continuous monitoring therefore provides much more information than a single endpoint.
Plotting Reaction-Rate Data
Suppose two experiments produce the following curves:
The steepest curve represents the fastest reaction.
The reaction reaching the plateau first has completed sooner.
If all curves reach the same final gas volume, the same total amount of gas was produced even though the rates were different.
Comparing Surface Area Experiments
Consider equal masses of calcium carbonate used as:
- large chunks
- small chips
- powder

If all other variables are controlled, powdered calcium carbonate usually reacts fastest because it has the largest surface area.
The purpose of good rate measurements is to make this comparison quantitative, not simply to say that one flask "looked fizzier."
Initial Rate
Many reactions are fastest immediately after the reactants are mixed.
The initial rate is the rate at:
t = 0
On a graph, we can estimate it by drawing a tangent at the beginning of the curve.
A steeper initial tangent indicates a larger initial rate.
Instantaneous Rate
A reaction does not normally proceed at exactly the same rate throughout.
Therefore, we may want the rate at a particular moment.
This is called the instantaneous rate.
We estimate it using a tangent.
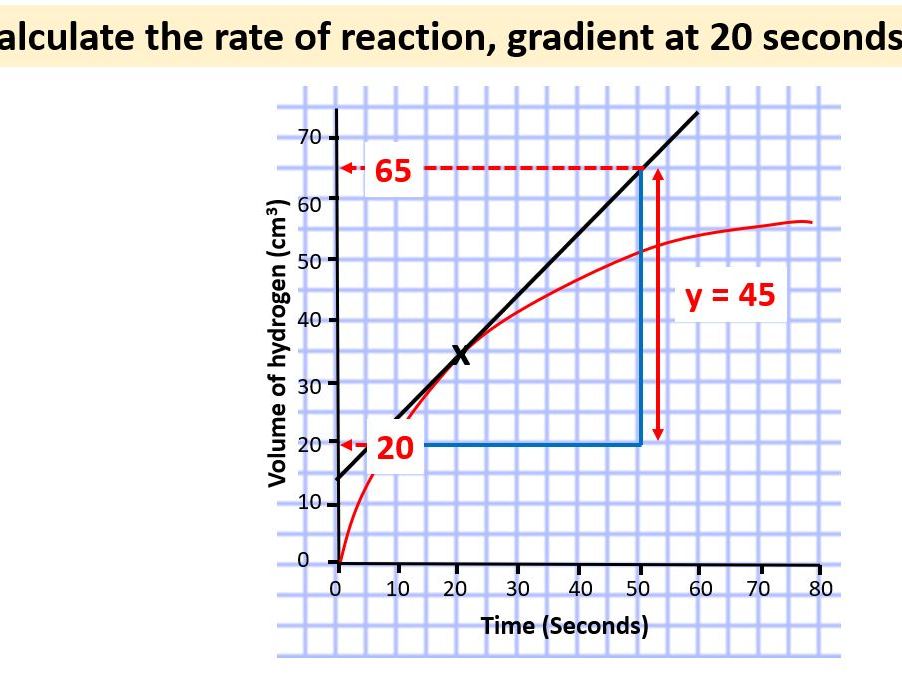
The rate is:
gradient = change in y ÷ change in x
For example:
Change in gas volume:
65 − 20 = 45 cm³
Change in time:
52 − 12 = 40 s
Approximate rate:
45 ÷ 40
= 1.125 cm³ s⁻¹
Average Rate vs Instantaneous Rate
These two terms are different.
Average rate
Rate over a time interval.
For example:
0–40 s
Instantaneous rate
Rate at one particular moment.
For example:
at 20 s
A reaction-rate curve is usually not a straight line because the rate changes as the reaction proceeds.
Worked Example 1: Average Gas Production Rate
A reaction produces:
84 cm³ of gas
in:
35 s
Rate:
84 ÷ 35
= 2.4 cm³ s⁻¹
Therefore:
average rate = 2.4 cm³ s⁻¹
Worked Example 2: Mass Loss
Mass at the start:
98.62 g
Mass after 50 s:
97.37 g
Mass lost:
98.62 − 97.37
= 1.25 g
Rate:
1.25 ÷ 50
= 0.025 g s⁻¹
Worked Example 3: Comparing Two Experiments
Experiment A produces:
60 cm³ in 30 s
Experiment B produces:
60 cm³ in 75 s
Experiment A:
60 ÷ 30 = 2.0 cm³ s⁻¹
Experiment B:
60 ÷ 75 = 0.80 cm³ s⁻¹
Therefore:
Experiment A is 2.5 times faster by this average-rate comparison.
Worked Example 4: Using Reciprocal Time
Three disappearing-cross trials give:
| Trial | Time (s) | 1/time (s⁻¹) |
|---|---|---|
| A | 80 | 0.0125 |
| B | 40 | 0.0250 |
| C | 20 | 0.0500 |
The fastest is:
C
because it has:
the shortest time
and:
the largest 1/time value
Comparing Reaction Curves
Consider curves for several experiments.
When comparing curves, look for two things:
Gradient
This tells us about rate.
Plateau height
This tells us about the final quantity measured, such as total gas produced.
These two features should not be confused.
A reaction can be faster but produce the same final amount of product.
Reliability, Accuracy and Precision
When evaluating rate measurements, it is useful to distinguish several ideas.
Reliability
Do repeated experiments give similar results?
Accuracy
How close is the measurement to the true value?
Precision
How closely repeated measurements agree and how finely the measuring instrument can discriminate.
A reliable investigation normally includes repeated trials.
Repeat Experiments
Suppose three measurements of the same reaction time are:
42.1 s
42.4 s
42.2 s
These results are very similar.
They suggest good repeatability.
Now suppose the results are:
41 s
58 s
39 s
There is much greater variation.
We should investigate the 58 s result before drawing a strong conclusion.
Calculating a Mean
Suppose three repeated reaction times are:
32 s
34 s
33 s
Mean:
(32 + 34 + 33) ÷ 3
= 33 s
Using repeated measurements and calculating a mean reduces the influence of small random variations.
Anomalous Results
An anomalous result is a measurement that does not fit the general pattern of the other results.
For example:
31.4 s
31.8 s
45.7 s
31.6 s
The 45.7 s measurement looks suspicious.
Possible causes include:
- stopwatch started late
- gas escaped before the apparatus was sealed
- incorrect volume of reactant
- temperature difference
- incorrect reading
- equipment malfunction
An anomalous result should not simply be deleted without justification.
The experiment should ideally be repeated.
Sources of Random Error
Random errors cause measurements to vary unpredictably.
Examples include:
- reaction-time differences when starting a stopwatch
- small differences in marble-chip size
- uncertainty when reading a gas syringe
- slight temperature fluctuations
- deciding exactly when a cross disappears
Random error can often be reduced by:
repeating measurements and calculating a mean
Sources of Systematic Error
A systematic error shifts measurements consistently in one direction.
Examples might include:
- a balance that is incorrectly zeroed
- a gas syringe with an incorrect scale
- a temperature probe consistently reading 2°C too high
Repeating the experiment does not automatically remove systematic error.
The equipment or method itself must be corrected.
Gas Leaks
Gas leaks are a major problem in gas-volume experiments.
If some gas escapes around the bung:
measured volume < actual volume produced
This may make the measured reaction rate appear lower than it actually is.
The apparatus should therefore be:
airtight
Connections should be checked before measurements begin.
Timing Error
A reaction may begin as soon as the reactants touch.
If it takes several seconds to:
- add the reactant
- fit the bung
- start the stopwatch
then part of the early reaction may not be recorded.
This is particularly important for very fast reactions.
A faster and more consistent starting procedure improves reliability.
Instrument Resolution
Every measuring instrument has a limit to how finely it can measure.
For example:
A balance reading to:
0.01 g
cannot reliably detect a mass change of:
0.001 g
A gas syringe marked every:
1 cm³
does not support readings such as:
27.384 cm³
Reporting more digits than the instrument can measure creates false precision.
Reading Scales Correctly
Measurements can be affected by viewing angle.
When reading scales:
- view at eye level
- avoid parallax error
- use consistent technique
- record appropriate significant figures
The same principle applies to:
- measuring cylinders
- gas syringes
- burettes
- thermometers
- balances
Controlling Variables
When comparing two reaction rates, only the variable being investigated should deliberately change.
For example, when investigating temperature, keep constant:
- reactant concentrations
- reactant volumes
- mass of solid
- surface area of solid
- apparatus
- measurement intervals
Otherwise, we may not know which variable caused the difference in rate.
Example: Fair Temperature Investigation
Suppose we compare a reaction at:
20°C
40°C
60°C
The other conditions should remain the same.
The graph shows that the higher-temperature reaction has the steeper initial gradient.
However, all three curves reach approximately the same final gas volume because the initial amount of limiting reactant is unchanged.
Evaluating the Best Method
Different reaction-rate methods have different strengths.
| Method | Main Measurement | Strength | Limitation |
|---|---|---|---|
| Gas syringe | Gas volume | Quantitative, many readings | Leaks can affect results |
| Water displacement | Gas volume | Simple equipment | Gas may dissolve in water |
| Mass loss | Mass | Easy continuous measurements | Poor for very light gases |
| Disappearing cross | Time to endpoint | Simple and inexpensive | Subjective endpoint |
| Colorimeter | Absorbance | Objective, continuous data | Requires specialised equipment |
| Concentration analysis | Concentration | Chemically informative | Can be more complicated |
There is no single "best" method for every reaction.
The best method depends on the reaction and the type of change that can be measured most reliably.
Which Method Would You Choose?
Reaction produces carbon dioxide
Gas syringe or mass loss could work.
Reaction produces hydrogen
Gas syringe may be better than mass loss because hydrogen has very little mass.
Reaction forms a cloudy precipitate
Disappearing cross or a light sensor could work.
Reaction changes from strongly coloured to colourless
Colorimetry may be useful.
Reaction does not produce gas or colour
Concentration sampling, conductivity or another chemical measurement may be needed.
Choosing an appropriate method is part of good experimental design.
Improving Reliability
A reaction-rate experiment can usually be improved by:
- repeating each condition several times
- calculating a mean
- investigating anomalous results
- using calibrated equipment
- using a consistent starting procedure
- controlling all other variables
- using regular measurement intervals
- reducing subjective judgement
- collecting more data points
- using data loggers where appropriate
These improvements make conclusions more defensible.
Digital Data Collection
Modern rate experiments can use electronic sensors and data loggers.
For example:
- pressure sensors
- temperature probes
- colorimeters
- electronic balances
- conductivity probes
- pH probes
A data logger can collect many measurements automatically.
This reduces the need for a person to read an instrument manually every few seconds and can produce a much more detailed reaction curve.
Continuous Monitoring
A gas syringe, balance connected to a computer, or colorimeter can allow continuous monitoring.
This provides information about the reaction throughout its progress.
Advantages include:
- many data points
- a complete reaction curve
- ability to estimate initial rate
- ability to calculate rate at different times
- easier identification of anomalies
Continuous monitoring is often more informative than recording only the time to one endpoint.
Endpoint Methods
The disappearing-cross method is an example of an endpoint method.
Instead of tracking the entire reaction, we measure:
time to reach a fixed observable condition
Endpoint methods are often:
- simple
- quick
- inexpensive
but may provide less detailed information than continuous monitoring.
Interpreting Experimental Data
Suppose two reactions give:
| Time (s) | Gas A (cm³) | Gas B (cm³) |
|---|---|---|
| 0 | 0 | 0 |
| 10 | 25 | 12 |
| 20 | 42 | 24 |
| 30 | 52 | 34 |
| 40 | 58 | 42 |
| 50 | 60 | 48 |
| 60 | 60 | 53 |
| 70 | 60 | 57 |
| 80 | 60 | 60 |
We can conclude:
Reaction A is faster.
Why?
It produces gas more rapidly and reaches 60 cm³ sooner.
Both reactions eventually produce:
60 cm³
Therefore, the final amount of gas is the same.
The difference is the rate, not the total amount produced.
Quantitative Comparison
For the first 20 seconds:
Reaction A:
42 ÷ 20 = 2.1 cm³ s⁻¹
Reaction B:
24 ÷ 20 = 1.2 cm³ s⁻¹
Therefore:
Reaction A has the greater average rate during the first 20 seconds.
This is stronger scientific evidence than saying:
"A looks faster."
Did You Know?
Modern chemical research often measures reaction rates using instruments capable of taking thousands or even millions of measurements.
Very fast reactions may occur too quickly for a person with a stopwatch to measure.
Scientists can instead use techniques involving:
- lasers
- spectroscopy
- rapid electronic detectors
- computer-controlled sensors
At the school level, a gas syringe and stopwatch demonstrate the same fundamental idea:
measure how much something changes and how long the change takes.
Common Mistakes
"The experiment with the most gas is always the fastest."
Incorrect. Final quantity and rate are different.
"A shorter disappearing-cross time means a lower rate."
Incorrect.
For the same endpoint:
shorter time = faster rate
and:
larger 1/time value = faster relative rate
"One measurement is enough to prove a result."
Usually weak evidence. Repeated trials improve reliability.
"Repeating an experiment fixes every error."
Incorrect.
Repeats help reduce random error but do not necessarily correct systematic error.
"A gas syringe measures reaction rate directly."
Not quite.
It measures gas volume.
Reaction rate is calculated from how that gas volume changes with time.
"A flat graph means the reaction is still occurring slowly."
If the measured product-time graph is truly horizontal, the measured rate at that stage is:
zero
"More decimal places always make data better."
Incorrect.
Measurements should match the resolution of the instrument.
A Good Evaluation Statement
Instead of writing:
"The experiment was accurate."
A stronger evaluation might say:
"The three repeated trials produced similar gas volumes, suggesting good repeatability. However, some carbon dioxide may have escaped before the bung was fitted, which could cause the measured gas volumes to be lower than the true values."
This identifies:
- evidence of reliability
- a specific limitation
- the likely effect of the limitation
That is much stronger scientific evaluation.
A Useful Evaluation Framework
When evaluating a reaction-rate experiment, ask:
Was the method appropriate?
Could the measured quantity show the progress of the reaction clearly?
Were variables controlled?
Was only one variable deliberately changed?
Were measurements repeated?
Could a mean be calculated?
Were there anomalies?
Were unusual values investigated?
Was the measuring equipment suitable?
Was its resolution sufficient?
Could material escape unexpectedly?
Gas leaks or splashing may affect results.
Was the endpoint subjective?
Could a sensor make it more objective?
Was enough data collected?
More measurements usually provide a clearer reaction curve.
Key Terms
Reaction rate – Change in the amount or concentration of a reactant or product per unit time.
Average rate – Rate calculated over a particular time interval.
Instantaneous rate – Rate at one specific moment.
Initial rate – Reaction rate at the beginning of a reaction.
Gradient – Slope of a graph; often used to calculate rate.
Gas syringe – Apparatus used to collect and measure gas volume.
Precipitate – Insoluble solid formed during a reaction.
Endpoint – A defined observation used to indicate that a particular stage of an experiment has been reached.
Colorimeter – Instrument that measures the absorption or transmission of light through a sample.
Reliability – The extent to which repeated measurements give similar results.
Repeatability – Agreement between repeated measurements made using the same method and equipment.
Anomalous result – A result that does not fit the general pattern.
Random error – Unpredictable variation between measurements.
Systematic error – Consistent error that shifts measurements in the same direction.
Resolution – Smallest change that a measuring instrument can distinguish.
Key Takeaways
- Reaction rates are measured by monitoring a quantity that changes with time.
- The basic relationship is:
Rate = change in quantity ÷ time
- Gas-producing reactions can be monitored using a gas syringe.
- Gas can also be collected by water displacement.
- Reactions releasing gas can sometimes be monitored by mass loss.
- Precipitate-forming reactions can be investigated using the disappearing-cross method.
- Colour changes can be monitored quantitatively using a colorimeter.
- Continuous monitoring provides multiple data points throughout a reaction.
- Endpoint methods measure the time required to reach one defined condition.
- Average rates can be calculated from experimental data.
- The gradient of a reaction graph gives information about reaction rate.
- A steeper gradient usually represents a faster rate.
- A horizontal product-time graph represents a rate of zero.
- Reaction rates should be compared using numerical evidence rather than qualitative observations alone.
- Repeated trials and means improve reliability.
- Anomalous values should be investigated rather than automatically discarded.
- Random and systematic errors affect experiments differently.
- Gas leaks, timing delays, subjective endpoints and limited instrument resolution can reduce data quality.
- A fair comparison requires other important variables to be controlled.
- The best measurement method depends on the particular reaction.
- Good scientific evaluation identifies both strengths and specific limitations of the experimental method.
3. Collision Theory
Learning outcomes
- I can explain collision theory.
- I can describe the conditions required for successful collisions.
- I can explain the relationship between collisions and reaction rate.
- I can relate activation energy to collision theory.
- I can use collision theory to explain experimental observations.
What Is Collision Theory?
Collision theory explains chemical reactions by considering what happens when reactant particles collide.
For a chemical reaction to occur, reactant particles must first come into contact with one another.
However:
not every collision produces a reaction.
A successful reaction normally requires the particles to:
- collide
- collide with sufficient energy
- collide with a suitable orientation
A collision that produces products is called a successful collision or effective collision.
The central idea of collision theory is:
More successful collisions per second → faster reaction
Particles Are Constantly Moving
Particles in gases and liquids are constantly moving.
As they move, they collide with:
- other reactant particles
- solvent particles
- the walls of their container
Many of these collisions do not cause any chemical change.
The particles simply collide and move apart again.
A chemical reaction occurs only when a collision satisfies the conditions necessary for atoms and bonds to rearrange.
Successful and Unsuccessful Collisions
Consider a simple reaction:
A + B → AB
Particles A and B may collide many times before a reaction occurs.
Unsuccessful collision
The particles collide but:
- have insufficient energy, or
- approach in an unsuitable orientation
They separate unchanged.
Successful collision
The particles collide:
- with enough energy
- in a suitable orientation
Bonds can rearrange and product AB forms.
An important distinction is therefore:
collision ≠ successful collision
Condition 1: Particles Must Collide
The first requirement is that reactant particles actually encounter one another.
If two particles never meet:
they cannot react with each other.
This explains why factors that increase collision frequency often increase reaction rate.
Examples include:
- increasing concentration
- increasing pressure of gases
- increasing the exposed surface area of a solid
These changes create more opportunities for reactant particles to collide.
Condition 2: Sufficient Energy
Particles also need enough energy when they collide.
The minimum energy barrier associated with a reaction is called the:
activation energy
Symbol:
Eₐ
If particles collide with energy below the activation-energy requirement:
no reaction occurs
If they collide with enough energy and have an appropriate orientation:
a reaction may occur
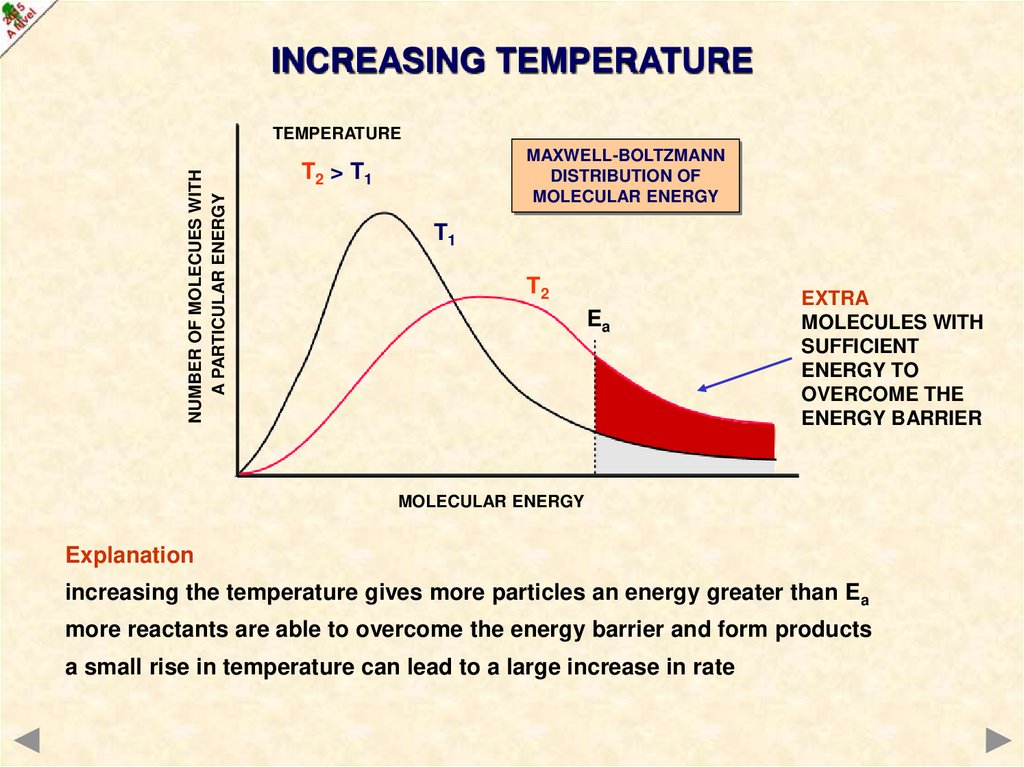
The vertical Eₐ line shows the energy threshold that reacting particles must overcome.
What Happens During a Successful Collision?
During a successful collision:
- atoms move very close together
- electron distributions change
- existing bonds may stretch and weaken
- some bonds may break
- atoms rearrange
- new bonds may form
The collision briefly takes the system toward a high-energy arrangement called the transition state.
If the particles do not have enough energy to reach this state, they separate without reacting.
Activation Energy as an Energy Barrier
Activation energy can be visualised using a reaction profile.
Reactants begin at one energy level.
The reaction pathway rises to a maximum before falling toward the products.
The energy difference between the reactants and the top of the barrier is:
Eₐ
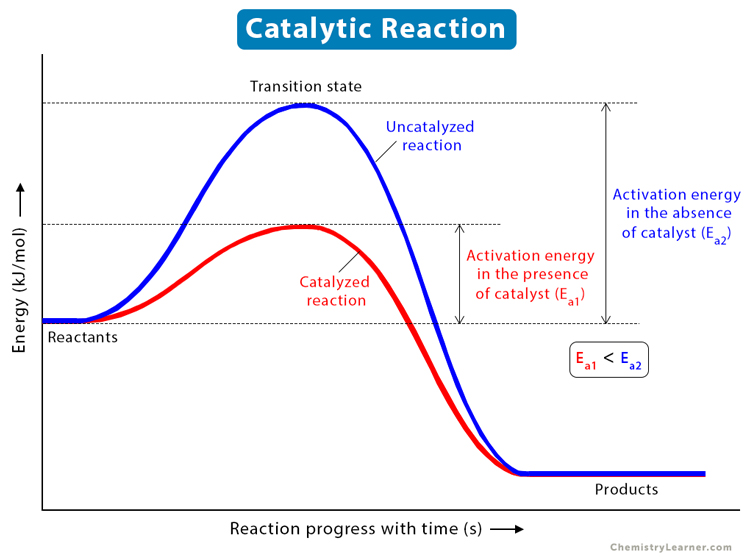
A large activation-energy barrier means that, at the same temperature, relatively few collisions may have enough energy to react.
A smaller barrier allows a larger proportion of collisions to be successful.
Activation Energy Is Not the Same as ΔH
Do not confuse:
Activation energy, Eₐ
with:
Enthalpy change, ΔH
Activation energy tells us about the energy barrier that must be overcome.
ΔH tells us about the overall energy difference between reactants and products.
A reaction can therefore be:
- exothermic with a large Eₐ
- exothermic with a small Eₐ
- endothermic with a large Eₐ
- endothermic with a small Eₐ
This is why knowing whether a reaction is exothermic does not automatically tell us whether it will be fast.
Why Can an Exothermic Reaction Need a Spark?
Consider combustion.
A fuel may react strongly with oxygen and release a large amount of energy.
Yet the fuel does not necessarily ignite immediately at room temperature.
An initial flame or spark provides energy that allows some particles to overcome the activation-energy barrier.
Once the reaction begins, the energy released can help sustain further reactions.
Therefore:
exothermic does not mean zero activation energy.
Condition 3: Correct Orientation
Sufficient energy alone may not be enough.
For many molecular reactions, particles must also collide in a suitable orientation.
Imagine:
A–B + C → A + B–C
Particle C may need to approach the B end of A–B.
If C strikes near A instead, the required bonds may not rearrange.
Even though the collision occurred, it may be unsuccessful.
Orientation is especially important when reacting molecules have complicated shapes or particular reactive regions.
Reaction Rate and Successful Collisions
Reaction rate depends primarily on how frequently successful collisions occur.
Imagine two reactions.
Reaction A:
100 successful collisions each second
Reaction B:
600 successful collisions each second
All other things being comparable:
Reaction B will proceed more rapidly.
Therefore:
Higher frequency of successful collisions → higher reaction rate
This idea connects microscopic particle behaviour with the macroscopic reaction rates we measure in experiments.
Collision Frequency
Collision frequency describes how often particles collide.
Suppose:
1000 collisions occur each second
and:
10 are successful.
Now imagine conditions change so that:
5000 collisions occur each second
while the same fraction remains successful.
There will now be many more successful collisions per second.
The reaction rate will increase.
Collision Theory and Concentration
Increasing the concentration of a solution means:
more reactant particles occupy the same volume.
The particles are therefore more likely to encounter each other.
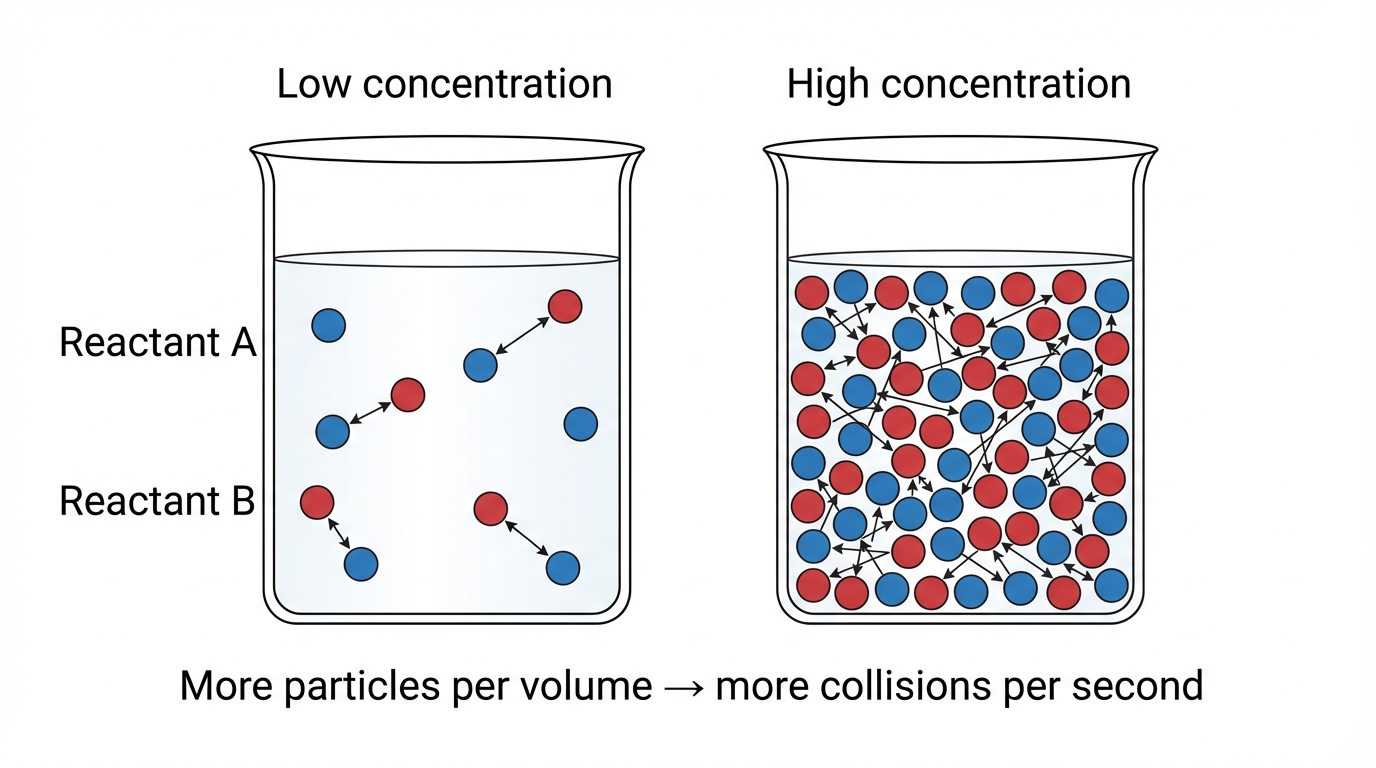
Therefore:
higher concentration
→ more particles per unit volume
→ more frequent collisions
→ more successful collisions per second
→ higher reaction rate
Increasing concentration increases collision frequency; it does not normally increase the kinetic energy of each particle.
Example: Magnesium and Hydrochloric Acid
Consider:
Mg + 2HCl → MgCl₂ + H₂
Suppose magnesium is reacted with:
0.5 mol dm⁻³ HCl
and then with:
2.0 mol dm⁻³ HCl
The more concentrated acid contains more reacting particles per unit volume.
Therefore:
collision frequency at the magnesium surface increases
and the reaction is faster.
What Would We Observe?
If hydrogen gas were collected:
The higher-concentration experiment would normally show:
- more rapid bubbling
- faster gas production
- a steeper graph
- a shorter time to reach the plateau
If the same amount of limiting reactant is used, both experiments may still eventually produce the same final amount of gas.
This is an important distinction:
higher concentration can change the rate without changing the final yield.
Concentration and Reaction Graphs
A faster reaction produces a steeper initial curve.
A slower reaction produces a shallower curve.
If both curves reach the same plateau:
the same final amount of product formed
but one reaction reached that amount faster.
The gradient gives information about the reaction rate.
Collision Theory and Gas Pressure
Pressure is particularly important for reactions involving gases.
Increasing the pressure of a gas usually means forcing the same number of particles into a smaller volume.
The particles become closer together.
Therefore:
collision frequency increases.
This leads to:
more successful collisions per second
and therefore:
a faster reaction.
Low Pressure vs High Pressure
Imagine two containers containing the same number of reacting gas particles.
Low pressure
Particles are spread throughout a larger volume.
They collide relatively infrequently.
High pressure
Particles occupy a smaller volume.
They encounter each other more frequently.
Therefore:
higher pressure → faster reaction
for many gas-phase reactions.
Collision Theory and Temperature
Temperature has an especially important effect on reaction rate.
Increasing temperature increases the average kinetic energy of the particles.
The particles move faster.
This produces two effects:
- collisions generally become more frequent
- a larger fraction of collisions has enough energy to overcome Eₐ
The second effect is particularly important.
At higher temperature, more collisions have sufficient energy to become successful.
Temperature and Particle Energy
Particles at the same temperature do not all have exactly the same kinetic energy.
Some have relatively low energies.
Some have intermediate energies.
A smaller number have very high energies.
The distribution can be represented using a Maxwell–Boltzmann distribution.
The area to the right of the activation-energy line represents particles with sufficient energy to overcome the activation-energy barrier.
When temperature increases:
a greater fraction of particles lies beyond Eₐ.
Therefore:
more collisions can be successful.
Why Temperature Has Such a Strong Effect
Suppose at a lower temperature only:
5%
of collisions have enough energy to overcome Eₐ.
After increasing temperature, perhaps:
15%
have sufficient energy.
The particles have not merely begun colliding a little faster.
The fraction of collisions capable of reacting has increased considerably.
That is why temperature can have such a strong effect on reaction rate.
Temperature Does Not Normally Lower Activation Energy
A common mistake is to say:
"Heating lowers the activation energy."
It does not.
Increasing temperature gives the particles greater average kinetic energy.
The activation-energy barrier remains essentially unchanged for the same reaction pathway.
So:
Higher temperature → more particles exceed Eₐ
rather than:
Higher temperature → lower Eₐ
Example: Temperature Experiment
Suppose the disappearing-cross reaction takes:
20°C → 80 s
40°C → 38 s
60°C → 18 s
The shorter time indicates a faster reaction.
Collision theory explains this because, at higher temperature:
- particles move faster
- collision frequency increases
- more importantly, more collisions have energy ≥ Eₐ
Therefore there are more successful collisions per second.
Collision Theory and Surface Area
Surface area matters when one reactant is a solid.
Only particles at the exposed surface of the solid can collide directly with particles from the other reactant.
Consider the same mass of solid as:
- one large lump
- several smaller chips
- a fine powder
The powder has the greatest total surface area.
Therefore:
smaller particle size
→ greater surface area
→ more exposed particles
→ more collisions per second
→ faster reaction
Why Does Crushing a Solid Help?
Imagine a large cube of calcium carbonate.
Many calcium carbonate particles are trapped inside the solid.
The acid cannot collide directly with them.
If the cube is crushed into many smaller pieces, new surfaces are exposed.
Particles that were previously inside the solid can now come into contact with acid.
This greatly increases the number of possible collisions.
Example: Calcium Carbonate and Acid
Consider:
CaCO₃ + 2HCl → CaCl₂ + H₂O + CO₂
Experiment A:
5 g large marble chips
Experiment B:
5 g powdered calcium carbonate
Same temperature, concentration and acid volume.
The powder should react faster.
Why?
The powder has a larger surface area, exposing more calcium carbonate particles to collisions with acid particles. Therefore, more successful collisions occur per second.
What Would the Graph Show?
If the same amount of limiting reactant is used, both experiments may eventually produce the same volume of carbon dioxide.
But the powder would:
- have a steeper initial gradient
- reach the plateau earlier
The large chips would:
- have a shallower gradient
- take longer to reach the plateau
The total product may be the same even though the rates are different.
Collision Theory and Catalysts
A catalyst increases reaction rate by providing an alternative reaction pathway with a lower activation energy.
Without a catalyst:
higher Eₐ
With a catalyst:
lower Eₐ
At the same temperature, lowering Eₐ means that a larger fraction of particles can overcome the energy barrier.
Therefore:
more collisions are successful
and:
reaction rate increases.
A catalyst changes the pathway, not the overall ΔH of the reaction.
A Catalyst Does Not Give Particles More Energy
This distinction is very important.
A catalyst does not:
- heat the particles
- increase their average kinetic energy
- make them move faster
Instead, it:
reduces the activation-energy requirement.
Suppose particles have collision energies of:
40, 60, 80, 100 and 120 kJ mol⁻¹.
Without catalyst:
Eₐ = 110 kJ mol⁻¹
Only the 120 kJ mol⁻¹ collision has sufficient energy.
With catalyst:
Eₐ = 70 kJ mol⁻¹
Now the:
80, 100 and 120 kJ mol⁻¹
collisions all exceed the barrier.
Many more collisions can therefore succeed.
Catalyst and Maxwell–Boltzmann Distribution
Adding a catalyst does not change the energy distribution of the particles if temperature remains constant.
Instead, the activation-energy threshold effectively moves to a lower energy.
So a larger portion of the existing particle distribution can react.
This gives another way to see why a catalyst increases reaction rate.
Comparing the Main Factors
| Factor | What changes? | Collision-theory explanation |
|---|---|---|
| Higher concentration | More particles per volume | More frequent collisions |
| Higher gas pressure | Particles closer together | More frequent collisions |
| Higher temperature | Greater kinetic energy | More collisions exceed Eₐ |
| Greater surface area | More particles exposed | More collisions at solid surface |
| Catalyst | Lower activation-energy pathway | Larger fraction of collisions succeeds |
Each factor increases rate, but not for exactly the same reason.
Using Collision Theory to Explain Experimental Results
Collision theory becomes most useful when we use it to explain observations.
For example:
Observation: Higher acid concentration makes a reaction faster.
Good explanation:
Increasing concentration puts more reactant particles in the same volume. This increases collision frequency, causing more successful collisions per second and therefore increasing reaction rate.
Example: Increasing Temperature
Observation: A reaction occurs much faster at 50°C than at 20°C.
Good explanation:
At higher temperature the particles have greater average kinetic energy. They move faster, and a larger fraction of collisions has energy equal to or greater than the activation energy. Therefore more successful collisions occur per second and the reaction rate increases.
Example: Crushing a Solid
Observation: Powdered calcium carbonate reacts faster than large marble chips.
Good explanation:
Powdered calcium carbonate has a larger surface area. More calcium carbonate particles are exposed to acid particles, increasing the collision frequency at the solid surface. More successful collisions occur per second, so the reaction is faster.
Example: Increasing Pressure
Observation: A gas-phase reaction speeds up when pressure increases.
Good explanation:
Increasing pressure places the gas particles closer together in a smaller volume. The particles collide more frequently, producing more successful collisions per second and increasing reaction rate.
Example: Adding a Catalyst
Observation: A reaction finishes sooner when a catalyst is added.
Good explanation:
The catalyst provides an alternative reaction pathway with a lower activation energy. A larger proportion of collisions therefore has enough energy to react. More collisions are successful each second, increasing reaction rate.
Explaining Why Reactions Slow Down
Reaction-rate graphs often begin steeply and gradually become flatter.
Why?
At the start:
reactant concentrations are relatively high
so:
collisions occur frequently
As reactants are consumed:
there are fewer reactant particles available
so:
collision frequency falls
Therefore:
successful collisions occur less frequently
and the reaction slows.
Eventually, a limiting reactant may be used up and the measured rate becomes zero.
Connecting Collision Theory to a Reaction Graph
Imagine gas is being produced.
At the beginning:
steep gradient
→ many successful collisions per second
Later:
shallower gradient
→ fewer successful collisions per second
At the plateau:
gradient = 0
→ no further measurable product formation
This connects the particle model directly to experimental observations.
Same Plateau, Different Rates
Suppose two experiments both produce:
60 cm³ gas
Experiment A reaches 60 cm³ after:
25 s
Experiment B reaches 60 cm³ after:
70 s
Experiment A experienced more successful collisions per unit time.
However, both eventually produced the same amount of gas.
Therefore:
successful-collision frequency determines rate
while:
amount of limiting reactant helps determine total product.
Different Plateau Heights
Now suppose:
Reaction A produces:
40 cm³
Reaction B produces:
80 cm³
The different final amounts cannot be explained simply by saying that B reacted faster.
The experiments probably involved different amounts of limiting reactant.
Collision theory is mainly used to explain:
how rapidly products form
rather than:
the maximum amount of product that can form.
Correct Collision-Theory Language
When explaining observations, avoid vague statements such as:
"The particles get more reactive."
"There are more reactions."
"The particles hit harder."
Instead, use precise scientific language:
collision frequency
kinetic energy
activation energy
successful collisions
particles per unit volume
surface area
These terms make explanations much stronger.
A Useful Explanation Pattern
For concentration:
Increase concentration
→ more particles per unit volume
→ more frequent collisions
→ more successful collisions per second
→ faster reaction
For surface area:
Increase surface area
→ more exposed solid particles
→ more collisions at the surface
→ more successful collisions per second
→ faster reaction
For temperature:
Increase temperature
→ higher average kinetic energy
→ more particles have E ≥ Eₐ
→ more successful collisions per second
→ faster reaction
For catalyst:
Add catalyst
→ lower activation energy pathway
→ larger fraction of collisions can overcome Eₐ
→ more successful collisions per second
→ faster reaction
Temperature vs Concentration
These two factors are commonly confused.
Increasing concentration
Main effect:
more frequent collisions
It does not normally increase individual particle kinetic energy.
Increasing temperature
Main effects:
particles have greater kinetic energy
and:
a larger fraction exceeds Eₐ
So temperature and concentration both increase reaction rate, but they do so in different ways.
Surface Area vs Temperature
Crushing a solid:
does not give its particles more kinetic energy.
It exposes more particles to collisions.
Heating:
does not increase the solid's surface area.
It increases particle kinetic energy.
Again, both may increase reaction rate, but through different mechanisms.
Catalyst vs Temperature
This is another important comparison.
Increasing temperature
Changes the energy distribution of the particles.
Adding a catalyst
Changes the reaction pathway and lowers Eₐ.
Both lead to more successful collisions, but by different mechanisms.
Everyday Example: Refrigerating Food
Many chemical and biochemical reactions are involved in food spoilage.
In a refrigerator:
temperature is lower
Particles have lower average kinetic energy.
A smaller fraction of collisions has enough energy to overcome activation barriers.
Therefore many spoilage reactions occur more slowly.
This helps food remain usable for longer.
Everyday Example: Cooking Food
Heating increases the kinetic energy of particles.
More collisions have sufficient energy to overcome activation barriers.
Chemical reactions involved in cooking therefore occur much faster at high temperatures than at room temperature.
This is why temperature control is such an important part of cooking.
Everyday Example: Fire
Wood can remain surrounded by oxygen for a very long time without burning.
The particles are colliding, but most collisions do not overcome the activation-energy barrier.
A match or spark supplies energy.
Once enough initial reactions begin, the combustion process releases energy that helps maintain further successful collisions.
Collision theory therefore helps explain why:
fuel + oxygen does not necessarily mean immediate combustion.
Orientation and Complex Molecules
Orientation becomes increasingly important when molecules become more complicated.
Simple ions may be able to react whenever they encounter each other appropriately.
Large molecules may contain only a small reactive region.
If two large molecules collide in the wrong orientation:
their reactive sites may never meet.
Therefore the collision remains unsuccessful even if substantial kinetic energy is present.
Enzymes and Orientation
Biological enzymes provide an interesting extension of collision theory.
An enzyme's active site can hold reactant molecules in favourable positions.
This can make productive interactions more likely.

Enzymes also lower activation-energy barriers, which is why they can dramatically increase biological reaction rates.
Experimental Evidence and Collision Theory
Imagine an experiment gives these reaction times:
| Condition | Reaction Time |
|---|---|
| Low concentration | 90 s |
| High concentration | 42 s |
| Low temperature | 110 s |
| High temperature | 35 s |
| Large chunks | 95 s |
| Powder | 28 s |
Collision theory helps explain each result.
Higher concentration:
more collisions
Higher temperature:
more energetic collisions
Powder:
more surface collisions
The observed changes provide evidence consistent with the collision model.
Evaluating an Explanation
Suppose a student writes:
"Powder reacts faster because there is more of it."
This is incorrect if the same mass was used.
A better explanation is:
"The powder has a greater surface area, so more reactant particles are exposed. This increases collision frequency with the other reactant, resulting in more successful collisions per second."
The amount of substance did not necessarily change.
The available surface changed.
Another Common Error
Statement:
"A catalyst increases the number of collisions."
This misses the main mechanism.
A better explanation is:
"A catalyst provides an alternative reaction pathway with lower activation energy, so a larger proportion of collisions can be successful."
Another Common Error
Statement:
"Heating lowers activation energy."
Incorrect.
A better explanation is:
"Heating increases the kinetic energy of the particles, so a greater proportion of collisions has sufficient energy to overcome the unchanged activation-energy barrier."
Another Common Error
Statement:
"Every collision above Eₐ creates products."
Not necessarily.
For many reactions, particles must also collide with an appropriate orientation.
A more complete statement is:
A successful collision requires sufficient energy and, where relevant, suitable orientation.
Did You Know?
In many reaction mixtures, particles may undergo an enormous number of collisions every second.
Yet the reaction may still be slow.
The reason is that only a small fraction of those collisions may satisfy all the requirements for reaction.
Some collisions have:
too little energy
Others have:
the wrong orientation
Only successful collisions contribute to chemical change.
This is why successful collisions per unit time is the key concept in collision theory.
Key Terms
Collision theory – A model that explains reaction rates using collisions between reacting particles.
Collision – An encounter between two or more particles.
Successful collision – A collision that results in a chemical reaction.
Unsuccessful collision – A collision in which products do not form.
Activation energy, Eₐ – The minimum energy barrier that must be overcome for a reaction pathway to proceed.
Kinetic energy – Energy possessed by a particle because of its motion.
Orientation – The way reacting particles are positioned relative to one another during a collision.
Collision frequency – The number of collisions occurring per unit time.
Surface area – The exposed area of a solid available for collisions.
Catalyst – A substance that increases reaction rate by providing an alternative pathway with lower activation energy and is regenerated overall.
Transition state – A temporary high-energy arrangement along a reaction pathway.
Key Takeaways
- Collision theory explains reaction rate in terms of particle collisions.
- Reactant particles must collide before they can react.
- Not every collision produces a reaction.
- A successful collision requires sufficient energy.
- The required energy is related to the activation energy, Eₐ.
- Many reactions also require suitable particle orientation.
- Reaction rate depends on the number of successful collisions per unit time.
- Higher concentration produces more frequent collisions.
- Higher gas pressure produces more frequent collisions.
- Greater solid surface area exposes more particles for collisions.
- Higher temperature increases average kinetic energy.
- At higher temperature, a larger fraction of collisions can overcome Eₐ.
- Heating does not normally lower activation energy.
- Catalysts provide an alternative pathway with a lower activation energy.
- Catalysts do not simply give particles more kinetic energy.
- Reactions often slow down as reactants are consumed because collision frequency decreases.
- Collision theory can explain experimental observations involving concentration, pressure, temperature, surface area and catalysts.
- A strong collision-theory explanation should connect:
change in conditions → change in particle behaviour → change in successful collisions → change in reaction rate.
4. Factors Affecting Reaction Rate
Learning outcomes
- I can describe how temperature affects reaction rate.
- I can explain the effect of concentration on reaction rate.
- I can explain how surface area influences reaction rate.
- I can describe the effect of pressure on gaseous reactions.
- I can predict how changing conditions affects reaction rate.
What Affects the Rate of a Reaction?
Chemical reactions can happen at very different speeds.
Some occur almost instantly, while others take minutes, hours, days, or much longer.
For a particular reaction, changing the conditions can often make the reaction:
faster
or:
slower
The main factors we will examine are:
- temperature
- concentration
- surface area
- pressure of gases
Catalysts also affect reaction rate and will be examined separately.
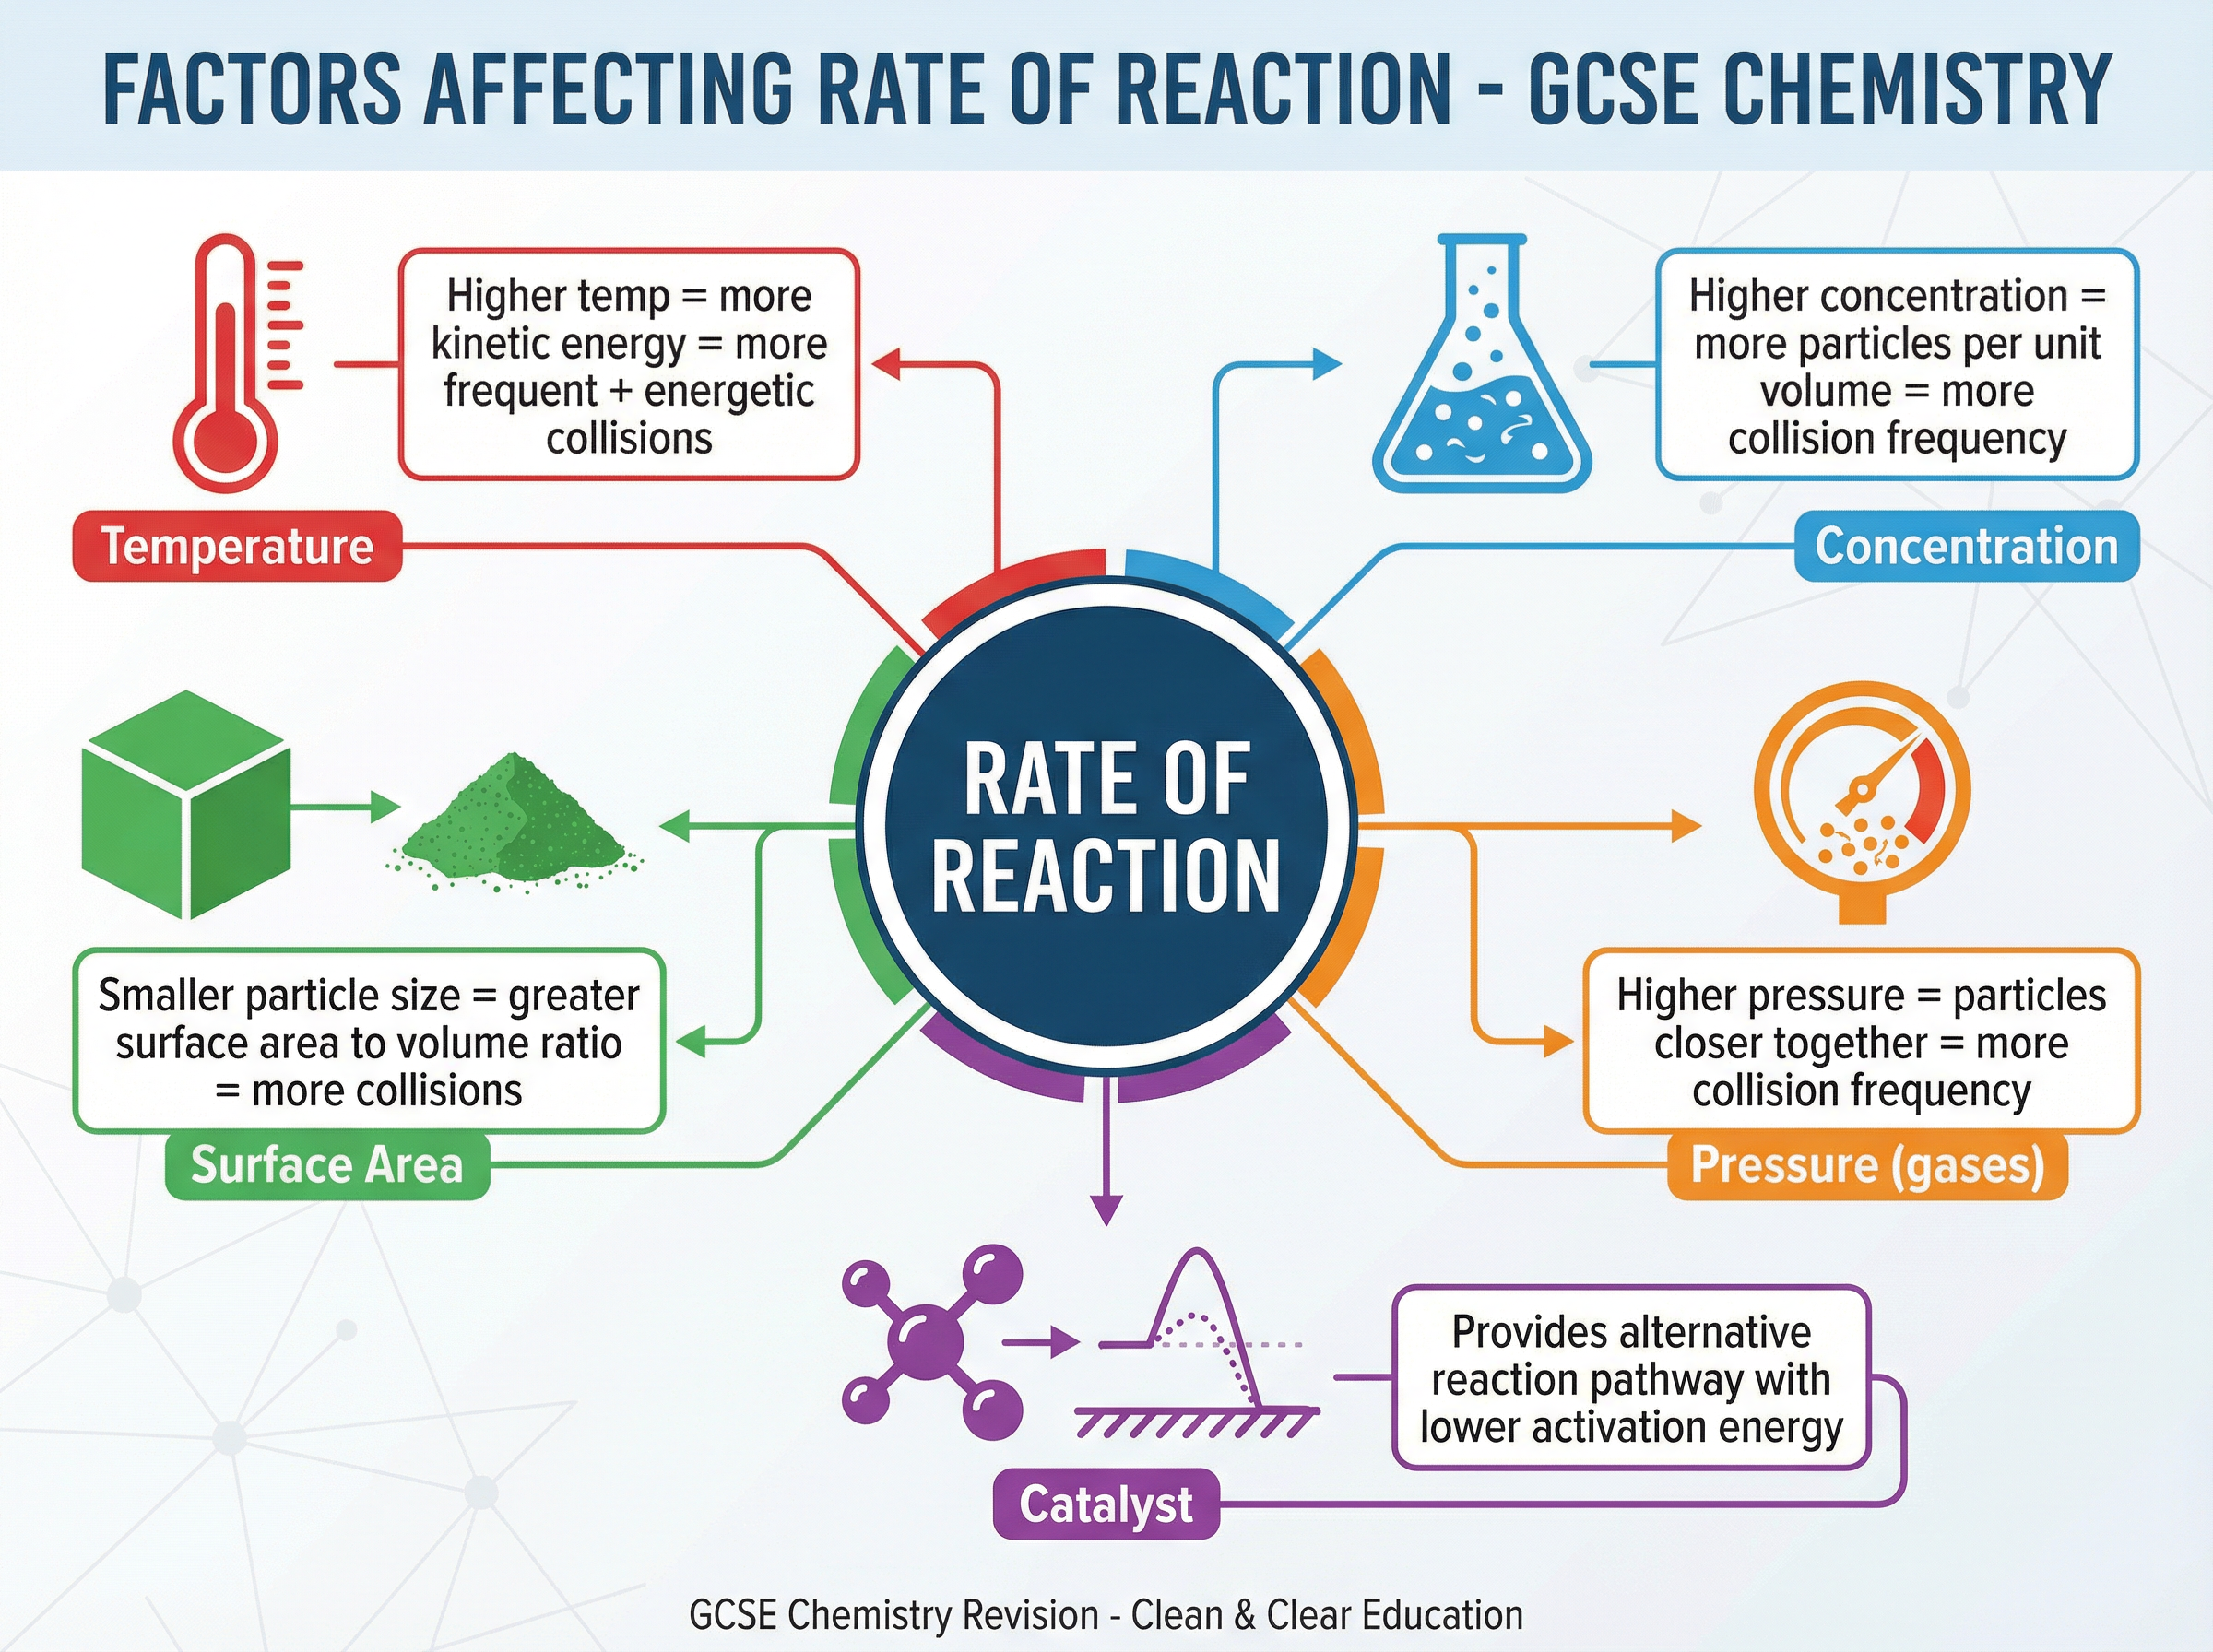
Collision theory helps explain why these factors matter. A reaction generally becomes faster when the number of successful collisions per unit time increases.
The Collision-Theory Connection
For reactant particles to react, they generally need to:
- collide
- collide with sufficient energy
- collide in an appropriate orientation
Changing reaction conditions can affect:
how often particles collide
and/or:
how many collisions have enough energy to react
This gives us a useful general relationship:
more successful collisions per second → faster reaction
Factor 1: Temperature
Temperature has a major effect on reaction rate.
In general:
higher temperature → faster reaction
and:
lower temperature → slower reaction
Why?
Temperature affects the kinetic energy of the particles.
At a higher temperature, particles have greater average kinetic energy.
They move more rapidly.
This produces more energetic collisions and usually somewhat more frequent collisions. More importantly, a larger fraction of collisions has enough energy to overcome the activation-energy barrier.
Temperature and Kinetic Energy
At low temperature:
particles move more slowly on average.
At high temperature:
particles move faster on average.
Therefore:
increase temperature
→ increase average kinetic energy
→ increase number of sufficiently energetic collisions
→ increase successful collisions per second
→ increase reaction rate
This is one of the most important cause-and-effect chains in chemical kinetics.
Temperature and Reaction Graphs
A higher-temperature reaction usually produces a steeper reaction curve.
The 50°C reaction has the steepest initial gradient.
The 30°C reaction has the shallowest.
Therefore:
50°C reaction = fastest
30°C reaction = slowest
If each experiment begins with the same amount of limiting reactant, the curves may eventually reach the same final amount of product.
The difference is how quickly they get there.
Why Does Temperature Have Such a Large Effect?
Heating does more than make particles move slightly faster.
Particles in a sample have a range of kinetic energies.
Only some of them have enough energy to overcome the activation energy, Eₐ.
When temperature rises:
the proportion of particles with energy ≥ Eₐ increases
This can produce a large increase in successful collisions.
Therefore, a strong explanation of temperature should mention:
kinetic energy
and:
activation energy
not merely "more collisions."
Temperature Does Not Normally Lower Activation Energy
A common mistake is:
"Higher temperature lowers the activation energy."
That is incorrect.
For the same reaction pathway:
Eₐ remains essentially the same
Higher temperature gives more particles enough energy to overcome that barrier.
A catalyst is what provides an alternative pathway with lower Eₐ.
Example: Sodium Thiosulfate Experiment
Suppose sodium thiosulfate reacts with hydrochloric acid.
At:
20°C → cross disappears in 90 s
40°C → cross disappears in 42 s
60°C → cross disappears in 19 s
The reaction is fastest at:
60°C
because the shortest time is required to reach the same visual endpoint.
Collision theory explains the observation:
At 60°C, particles have greater kinetic energy and a larger fraction of collisions exceeds the activation-energy requirement.
Predicting a Temperature Change
Suppose a reaction is running at:
25°C
and the temperature is increased to:
45°C
Prediction:
reaction rate increases
Reason:
particles have greater average kinetic energy and a greater fraction of collisions has enough energy to overcome Eₐ.
Now suppose the temperature is lowered.
Prediction:
reaction rate decreases
because fewer collisions have sufficient energy.
Everyday Example: Refrigeration
Many chemical and biochemical reactions involved in food spoilage occur more slowly at lower temperatures.
In a refrigerator:
lower temperature
→ lower average kinetic energy
→ fewer sufficiently energetic collisions
→ slower reactions
This is one reason refrigeration helps food remain usable for longer.
Everyday Example: Cooking
Cooking often relies on increased reaction rates.
Heating food increases particle kinetic energy.
More collisions can overcome activation-energy barriers.
As a result, processes such as:
- browning
- protein changes
- starch transformations
- flavour-forming reactions
occur much more quickly at cooking temperatures than at room temperature.
Factor 2: Concentration
Concentration describes how much dissolved substance is present in a given volume.
For many solution reactions:
higher concentration → faster reaction
Why?
A more concentrated solution contains:
more reactant particles in the same volume
Therefore, particles encounter one another more frequently.
The higher-concentration sample contains more particles in the same amount of space.
Concentration and Collision Frequency
Suppose two beakers have the same volume.
Beaker A contains:
20 reacting particles
Beaker B contains:
80 reacting particles
Particles in Beaker B have many more opportunities to collide.
Therefore:
higher concentration
→ more particles per unit volume
→ greater collision frequency
→ more successful collisions per second
→ faster reaction
Increasing concentration usually changes collision frequency rather than the kinetic energy of individual particles.
Example: Magnesium and Hydrochloric Acid
Consider:
Mg + 2HCl → MgCl₂ + H₂
Experiment A uses:
0.5 mol dm⁻³ HCl
Experiment B uses:
2.0 mol dm⁻³ HCl
The 2.0 mol dm⁻³ acid contains more reacting acid particles per unit volume.
Therefore, acid particles collide with the magnesium surface more frequently.
Prediction:
Experiment B will react faster.
What Would You Observe?
With more concentrated acid, you might observe:
- more rapid bubbling
- hydrogen produced more quickly
- a steeper gas-volume graph
- magnesium disappearing sooner
If the same amount of magnesium remains the limiting reactant in both experiments, both may eventually produce the same final amount of hydrogen.
Again:
faster does not necessarily mean more product.
Concentration and Reaction Curves
Suppose two experiments eventually produce 60 cm³ of gas.
The concentrated solution reaches 60 cm³ after:
30 s
The dilute solution reaches it after:
75 s
The concentrated reaction is faster because:
its graph has the steeper gradient
and:
it reaches the plateau sooner
The same plateau height indicates that the same total amount of gas was ultimately produced.
Predicting a Concentration Change
If concentration increases:
rate usually increases
If concentration decreases:
rate usually decreases
For example:
1.0 mol dm⁻³ → 2.0 mol dm⁻³
Prediction:
faster reaction
Reason:
more particles per unit volume produce more frequent collisions.
Concentration Does Not Mean "Stronger Particles"
Another common misconception is:
"Higher concentration gives particles more energy."
Incorrect.
Increasing concentration does not normally change the kinetic energy of individual particles.
Instead:
there are simply more particles available per unit volume
so collisions become more frequent.
This is different from increasing temperature.
Factor 3: Surface Area
Surface area is especially important when one reactant is a solid.
A reaction between a solid and a liquid or gas occurs mainly at the solid's exposed surface.
Therefore:
greater surface area → faster reaction
Smaller pieces provide more exposed surface than one large piece of the same total mass.
The diagram shows the difference between a large solid piece and a powder.
Why Does Crushing a Solid Increase Reaction Rate?
Imagine a solid cube.
Only particles on the outside surface can directly collide with particles from the other reactant.
Many particles inside the cube are inaccessible.
Now crush the cube into many smaller particles.
A much larger amount of the solid is exposed.
Therefore:
smaller particle size
→ larger total surface area
→ more exposed solid particles
→ more collisions per second
→ more successful collisions per second
→ faster reaction
Same Mass, Different Surface Area
Suppose we have:
10 g of calcium carbonate
We can use it as:
- one large lump
- several chips
- fine powder
The mass is still:
10 g
But the exposed surface area is very different.
The powder has the greatest surface area.
Therefore:
powder reacts fastest
and:
large lump reacts slowest
Example: Calcium Carbonate and Hydrochloric Acid
Consider:
CaCO₃ + 2HCl → CaCl₂ + H₂O + CO₂
Experiment A:
5 g large marble chips
Experiment B:
5 g small marble chips
Experiment C:
5 g powdered calcium carbonate
All other variables are controlled.
Prediction:
C fastest
then:
B
then:
A slowest
Reason:
Powder has the largest exposed surface area, producing the greatest number of acid–calcium carbonate collisions each second.
Surface Area and Gas-Volume Graphs
Suppose all three experiments contain the same amount of limiting calcium carbonate.
The powder experiment might show:
steepest curve
The large-chip experiment might show:
shallowest curve
But all curves could eventually reach the same final volume of CO₂.
This tells us:
surface area affects reaction rate
but does not necessarily change:
the total amount of product formed.
Surface Area-to-Volume Ratio
As objects become smaller:
surface area-to-volume ratio generally increases
This is why powders can react so much faster than large chunks.
A large block contains many particles hidden inside.
A collection of tiny particles exposes much more material.
This concept matters in:
- chemical industry
- combustion
- digestion
- dissolving
- mining and processing
An Important Safety Connection
Powders can sometimes be much more reactive than the same substance in large pieces.
For example, finely divided combustible materials may burn extremely rapidly because so much material is exposed to oxygen at once.
This helps explain why dust control is important in some industrial settings.
The chemistry is the same:
greater surface area → more collisions → faster reaction
Surface Area Does Not Increase Particle Energy
Another common misconception is:
"Crushing makes the particles move faster."
No.
Crushing mainly changes:
how much surface is exposed
It does not significantly increase particle kinetic energy.
Temperature changes kinetic energy.
Surface area changes access to collision sites.
Factor 4: Pressure of Gases
Pressure is especially important for reactions involving gaseous reactants.
Increasing gas pressure usually pushes the particles into a smaller volume.
The particles become closer together.
Therefore:
collision frequency increases
and:
reaction rate increases.
At higher pressure, gaseous reactant particles are packed more closely together.
Pressure and Particle Spacing
Imagine 100 gas particles.
At low pressure, they occupy a large container.
They are relatively far apart.
At higher pressure, the same particles occupy a smaller volume.
They encounter one another more frequently.
Therefore:
higher gas pressure
→ particles closer together
→ more frequent collisions
→ more successful collisions per second
→ higher reaction rate
Pressure and Concentration Are Related Ideas
For gases, increasing pressure by reducing volume effectively increases the number of particles per unit volume.
So pressure affects gaseous reactions in a similar way to concentration affecting solutions.
Higher solution concentration
More particles per unit volume.
Higher gas pressure
More gas particles per unit volume.
Both increase:
collision frequency
Example: Gas Reaction
Imagine:
A(g) + B(g) → AB(g)
At low pressure:
A and B particles are relatively spread out.
At higher pressure:
A and B are packed closer together.
Prediction:
the higher-pressure reaction will usually be faster
because the particles collide more frequently.
Pressure Matters Mainly for Gases
Solids and liquids are difficult to compress significantly under ordinary conditions.
Therefore changing pressure generally has a much smaller effect on particle spacing in:
- solids
- liquids
than it does in gases.
For school-level rate problems:
pressure is mainly considered for gaseous reactants.
Comparing the Four Factors
| Change | Particle-Level Effect | Expected Rate |
|---|---|---|
| Increase temperature | More particles exceed Eₐ | Faster |
| Decrease temperature | Fewer particles exceed Eₐ | Slower |
| Increase concentration | More collisions per second | Faster |
| Decrease concentration | Fewer collisions per second | Slower |
| Increase surface area | More exposed particles | Faster |
| Decrease surface area | Fewer exposed particles | Slower |
| Increase gas pressure | More frequent gas collisions | Faster |
| Decrease gas pressure | Less frequent gas collisions | Slower |
These factors all influence reaction rate, but they do not all work in exactly the same way.
Temperature vs Concentration
It is important to distinguish these explanations.
Increase temperature
Particles have:
greater average kinetic energy
and:
more collisions exceed Eₐ
Increase concentration
There are:
more particles per unit volume
so:
collision frequency increases
Concentration does not normally change particle kinetic energy.
Temperature vs Surface Area
Higher temperature
Changes particle energy.
Greater surface area
Changes how much solid is exposed.
Both increase reaction rate, but by different mechanisms.
Concentration vs Pressure
These are closely related.
Concentration
Usually discussed for solutions.
More dissolved particles per unit volume.
Pressure
Usually discussed for gases.
Compresses particles into a smaller volume.
Both typically increase:
collision frequency
Predicting Experimental Results
Suppose magnesium reacts with hydrochloric acid.
Experiment A:
- 1.0 mol dm⁻³ HCl
- 20°C
Experiment B:
- 2.0 mol dm⁻³ HCl
- 20°C
Prediction:
B is faster
because concentration is higher.
Prediction Example 2
Experiment A:
- 2.0 mol dm⁻³ HCl
- 20°C
Experiment B:
- 2.0 mol dm⁻³ HCl
- 50°C
Prediction:
B is faster
because temperature is higher.
The stronger explanation is:
At 50°C, particles have greater average kinetic energy and more collisions have sufficient energy to overcome Eₐ.
Prediction Example 3
Experiment A:
5 g large marble chips
Experiment B:
5 g powdered marble
Everything else is identical.
Prediction:
B reacts faster
because powder has greater surface area.
Prediction Example 4
A gaseous reaction is performed at:
Experiment A:
1 atm
Experiment B:
4 atm
at the same temperature.
Prediction:
B is usually faster
because gas particles are closer together and collide more frequently.
What If More Than One Condition Changes?
Suppose:
Experiment A:
- low concentration
- low temperature
- large chunks
Experiment B:
- high concentration
- high temperature
- powder
Prediction:
B should be much faster
because all three changes increase the frequency of successful collisions.
However, if some conditions increase rate while others decrease it, qualitative prediction may become difficult.
For example:
Experiment A:
- high concentration
- low temperature
Experiment B:
- low concentration
- high temperature
Without experimental data or a quantitative rate law, we may not be able to state confidently which reaction is faster.
This is an important scientific limitation.
Predicting Graph Shape
If a reaction becomes faster:
the product-time graph should usually become:
steeper
and:
reach its plateau sooner
If the initial amount of limiting reactant is unchanged:
plateau height may remain the same.
Changing rate does not necessarily change the amount of product ultimately formed.
Rate vs Final Amount
Suppose:
Reaction A reaches 80 cm³ of gas in 20 s.
Reaction B reaches 80 cm³ in 60 s.
Reaction A is faster.
But both produce:
80 cm³
Therefore:
same final product amount
but:
different reaction rates
This distinction appears frequently in reaction-rate graphs.
Why Do Reactions Slow Down?
Even when temperature, pressure and surface area are kept constant, a reaction may slow as it proceeds.
Why?
Reactants are being used up.
Their concentrations decrease.
Therefore:
fewer reactant particles remain
→ collision frequency decreases
→ successful collisions per second decrease
→ reaction rate decreases
This is why many product-time curves gradually become flatter.
Experimental Example: Temperature
Suppose gas production is measured at three temperatures.
50°C has the steepest curve.
40°C is intermediate.
30°C has the shallowest curve.
The graph provides experimental evidence that:
higher temperature increases reaction rate.
Experimental Example: Surface Area
Suppose equal masses of a solid react with acid.
Powder reaches the final gas volume in:
20 s
Small chips:
45 s
Large chunks:
90 s
Ranking:
Powder > Small chips > Large chunks
in reaction rate.
The explanation is not that the powder contains more material.
The masses are equal.
The difference is:
surface area.
Using Evidence to Support Predictions
A strong scientific prediction should not simply state:
"It will be faster."
Instead:
"Increasing the concentration should increase the reaction rate because there will be more reactant particles per unit volume. This increases collision frequency and therefore the number of successful collisions per second."
Or:
"Increasing temperature should increase the rate because particles have greater average kinetic energy and a larger fraction of collisions can overcome the activation-energy barrier."
Always connect the condition to collision theory.
A Useful Reasoning Pattern
For most questions, use:
Condition changes
↓
Particle behaviour changes
↓
Collision behaviour changes
↓
Successful collision frequency changes
↓
Reaction rate changes
For example:
Increase pressure
↓
particles closer together
↓
more collisions
↓
more successful collisions per second
↓
faster reaction
Common Misconception: Higher Concentration Means Higher Energy
Incorrect.
Higher concentration means:
more particles in a given volume
It primarily increases collision frequency.
Temperature changes particle kinetic energy.
Common Misconception: Pressure Speeds Up Every Reaction
Not necessarily.
Pressure has its most significant effect when the reacting substances are gases.
Changing pressure usually has much smaller effects on liquids and solids.
Common Misconception: Smaller Pieces Mean Less Reactant
Not if the mass remains the same.
For example:
10 g large chips
and:
10 g powder
contain the same total mass.
The powder simply has:
greater exposed surface area
and therefore reacts faster.
Common Misconception: Faster Reaction Means More Product
Incorrect.
A faster reaction can simply reach the same final product amount sooner.
Reaction rate and reaction yield are different concepts.
Common Misconception: Temperature Only Increases Collision Frequency
This explanation is incomplete.
Higher temperature does increase particle speeds and collision frequency somewhat.
But its major effect is that:
a larger fraction of collisions has sufficient energy to overcome Eₐ.
A complete temperature explanation should mention activation energy.
Real-World Connection: Medicines
Chemical decomposition can affect the shelf life of medicines.
Storing some medicines at lower temperatures can slow unwanted chemical reactions.
This is another application of:
lower temperature → fewer sufficiently energetic collisions → slower reaction
Real-World Connection: Industry
Industrial chemists often want reactions to occur quickly enough to produce large quantities of product efficiently.
They may adjust:
- temperature
- reactant concentration
- gas pressure
- particle size
- catalysts
However, the fastest possible conditions are not always the best.
Very high temperatures and pressures can require:
- more energy
- more expensive equipment
- stronger reaction vessels
- additional safety controls
Reaction conditions therefore involve a balance between:
rate, cost, safety and efficiency.
Real-World Connection: Powdered Fuels
Smaller fuel particles have much greater surface area than large chunks.
This allows oxygen to contact more fuel particles at once.
Therefore combustion can occur much more rapidly.
The same collision-theory principle applies:
greater surface area → more collisions at the fuel surface → faster reaction
Did You Know?
The effect of changing conditions can be dramatic.
A solid that reacts slowly as a large lump may react extremely rapidly when finely powdered.
A reaction that is barely noticeable at low temperature may become rapid after heating.
A gas reaction may speed up substantially when gases are compressed.
Yet all these observations can be explained using the same basic model:
the conditions affect how frequently particles undergo successful collisions.
Predicting Rate: Quick Guide
If you see:
Higher temperature
Predict:
faster
Reason:
greater kinetic energy and more collisions exceeding Eₐ
If you see:
Higher concentration
Predict:
faster
Reason:
more particles per unit volume and greater collision frequency
If you see:
Smaller solid particles
Predict:
faster
Reason:
greater surface area and more exposed particles
If you see:
Higher gas pressure
Predict:
faster
Reason:
gas particles are closer together and collide more frequently
If you see the opposite change:
usually predict:
slower
Key Terms
Reaction rate – How quickly reactants are converted into products.
Collision theory – A model explaining reaction rates in terms of particle collisions.
Successful collision – A collision that results in chemical reaction.
Temperature – A measure related to the average kinetic energy of particles.
Kinetic energy – Energy associated with particle motion.
Activation energy, Eₐ – The minimum energy barrier associated with a reaction pathway.
Concentration – Amount of substance present in a given volume.
Surface area – Amount of exposed surface available for reaction.
Pressure – Force per unit area; for gases it is related to particle collisions with container walls and particle density.
Collision frequency – How often particles collide.
Key Takeaways
- Reaction rate can be changed by altering reaction conditions.
- Four major factors are temperature, concentration, surface area and gas pressure.
- Collision theory explains the effects of these factors.
- Higher temperature usually increases reaction rate.
- Higher temperature increases average particle kinetic energy.
- A larger fraction of collisions can then overcome the activation-energy barrier.
- Higher concentration places more particles in the same volume.
- This produces more frequent collisions and a faster reaction.
- Greater surface area exposes more solid particles to collisions.
- Powders therefore usually react faster than large pieces of the same substance.
- Higher pressure speeds many gaseous reactions because gas particles are pushed closer together.
- Increased gas pressure results in more frequent collisions.
- Temperature, concentration, surface area and pressure do not increase rate through exactly the same mechanism.
- Reaction-rate graphs become steeper when reactions are faster.
- A faster reaction does not necessarily produce more final product.
- If several conditions change in opposite directions, experimental evidence may be required to determine which reaction is faster.
- Strong explanations should follow:
condition change → particle effect → collision effect → reaction-rate effect.
5. Catalysts and Reaction Rates
Learning outcomes
- I can explain how catalysts increase reaction rates.
- I can describe the effect of catalysts on activation energy.
- I can identify industrial and biological catalysts.
- I can compare catalyzed and uncatalyzed reactions.
- I can explain why catalysts are important in industry.
What Is a Catalyst?
A catalyst is a substance that increases the rate of a chemical reaction without being consumed overall by the reaction.
A catalyst may participate in steps of the reaction, but it is regenerated before the reaction is complete.
This means a relatively small amount of catalyst can often help convert a much larger amount of reactant into product.
Catalysts work mainly by providing:
an alternative reaction pathway with a lower activation energy.

The catalyzed pathway has the lower energy barrier.
Catalysts and Reaction Rate
Remember from collision theory:
For particles to react, collisions must have enough energy to overcome the activation energy, Eₐ.
Without a catalyst, the activation-energy barrier may be relatively high.
Only a small proportion of particle collisions may have sufficient energy.
When a catalyst is added:
activation energy decreases
so:
a larger proportion of collisions can be successful
and therefore:
reaction rate increases.
This gives the chain:
catalyst
→ alternative reaction pathway
→ lower activation energy
→ more successful collisions per second
→ faster reaction
What Is Activation Energy?
Activation energy, Eₐ, is the minimum energy barrier associated with a reaction pathway.
Reactant particles must overcome this barrier before products can form.
Imagine the reaction pathway as a hill.
Without a catalyst:
large hill
With a catalyst:
smaller hill
The catalyst does not push particles over the original hill.
Instead, it provides a different route with a lower hill.
Comparing Catalyzed and Uncatalyzed Reactions
Consider the same chemical reaction under identical conditions.
Uncatalyzed reaction
- higher activation energy
- smaller fraction of collisions can overcome Eₐ
- fewer successful collisions per second
- slower reaction
Catalyzed reaction
- lower activation energy
- larger fraction of collisions can overcome Eₐ
- more successful collisions per second
- faster reaction
The important point is:
the starting reactants and final products remain the same.
The catalyst changes the pathway, not the overall reaction.
What Does a Catalyst Change?
A catalyst changes:
- reaction mechanism or pathway
- activation energy
- reaction rate
- time required to reach equilibrium
A catalyst does not change:
- the energy of the reactants
- the energy of the products
- the overall enthalpy change, ΔH
- the equilibrium constant
- the equilibrium position
Catalyst and ΔH
Look again at an energy-profile diagram.
The catalyzed and uncatalyzed curves begin at the same reactant energy.
They finish at the same product energy.
Therefore:
ΔH remains unchanged.
Only the height of the activation-energy barrier changes.
So:
Catalyst affects Eₐ, not ΔH.
Worked Example: Activation Energy
Suppose an uncatalyzed reaction has:
Eₐ = 150 kJ mol⁻¹
After adding a catalyst:
Eₐ = 85 kJ mol⁻¹
The decrease in activation energy is:
150 − 85 = 65 kJ mol⁻¹
The catalyst has provided a pathway whose activation-energy barrier is:
65 kJ mol⁻¹ lower.
If:
ΔH = −40 kJ mol⁻¹
before adding the catalyst, then after adding it:
ΔH is still −40 kJ mol⁻¹.
The catalyst changes the reaction rate, not the overall energy change.
Why Does Lower Activation Energy Increase Rate?
Particles in a reaction mixture have a range of kinetic energies.
At any temperature, some particles have:
- low energy
- medium energy
- high energy
Suppose the original Eₐ is very high.
Only a small fraction of particles can overcome it.
If a catalyst lowers Eₐ, many more particles now possess enough energy to follow the reaction pathway.
Therefore:
more collisions become successful.
This explains why the reaction becomes faster even though the temperature has not changed.
A Catalyst Does Not Give Particles More Energy
This is a common misconception.
A catalyst does not:
- increase temperature
- increase average kinetic energy
- make particles move faster
Instead, it:
reduces the amount of energy required for a successful pathway.
That distinction is very important.
Temperature vs Catalyst
Both increasing temperature and adding a catalyst can increase reaction rate.
However, they work differently.
Higher temperature
Particles gain greater average kinetic energy.
A larger fraction can overcome the existing Eₐ.
Catalyst
The particle-energy distribution remains essentially unchanged at the same temperature.
Instead:
Eₐ is lowered.
Therefore a larger fraction of the existing particle population can react.
Alternative Reaction Pathways
The catalyzed pathway may involve different intermediate steps from the uncatalyzed reaction.
For example, an uncatalyzed reaction might occur as:
A + B → AB
through one difficult step.
A catalyst might provide a mechanism such as:
A + catalyst → intermediate
intermediate + B → AB + catalyst
The catalyst appears during the mechanism but is regenerated at the end.
Overall:
A + B → AB
The catalyst does not appear in the final overall equation because it has not been consumed.
Why Is a Catalyst Not Used Up?
A catalyst can participate chemically during the reaction.
This sometimes causes confusion.
It may:
- temporarily bond to a reactant
- form an intermediate
- change oxidation state
- provide a reaction surface
But by the end of the catalytic cycle, the original catalyst is regenerated.
A simplified catalytic cycle is:
C + A → AC
AC + B → AB + C
C is used in the first step but recreated in the second.
Therefore:
C is not consumed overall.
Catalysts Can Eventually Become Less Effective
Although catalysts are regenerated chemically, real catalysts do not necessarily work forever.
They can become less effective because of:
- contamination
- catalyst poisoning
- physical damage
- surface blockage
- sintering at high temperatures
So "not consumed" does not mean:
"a catalyst lasts forever under all conditions."
Types of Catalysts
Two important types are:
heterogeneous catalysts
and:
homogeneous catalysts
Biological catalysts called enzymes are also extremely important.
Heterogeneous Catalysts
A heterogeneous catalyst is in a different physical phase from the reactants.
A common example is:
solid catalyst + gaseous reactants
Many industrial catalysts work this way.
The reaction takes place on the catalyst's surface.
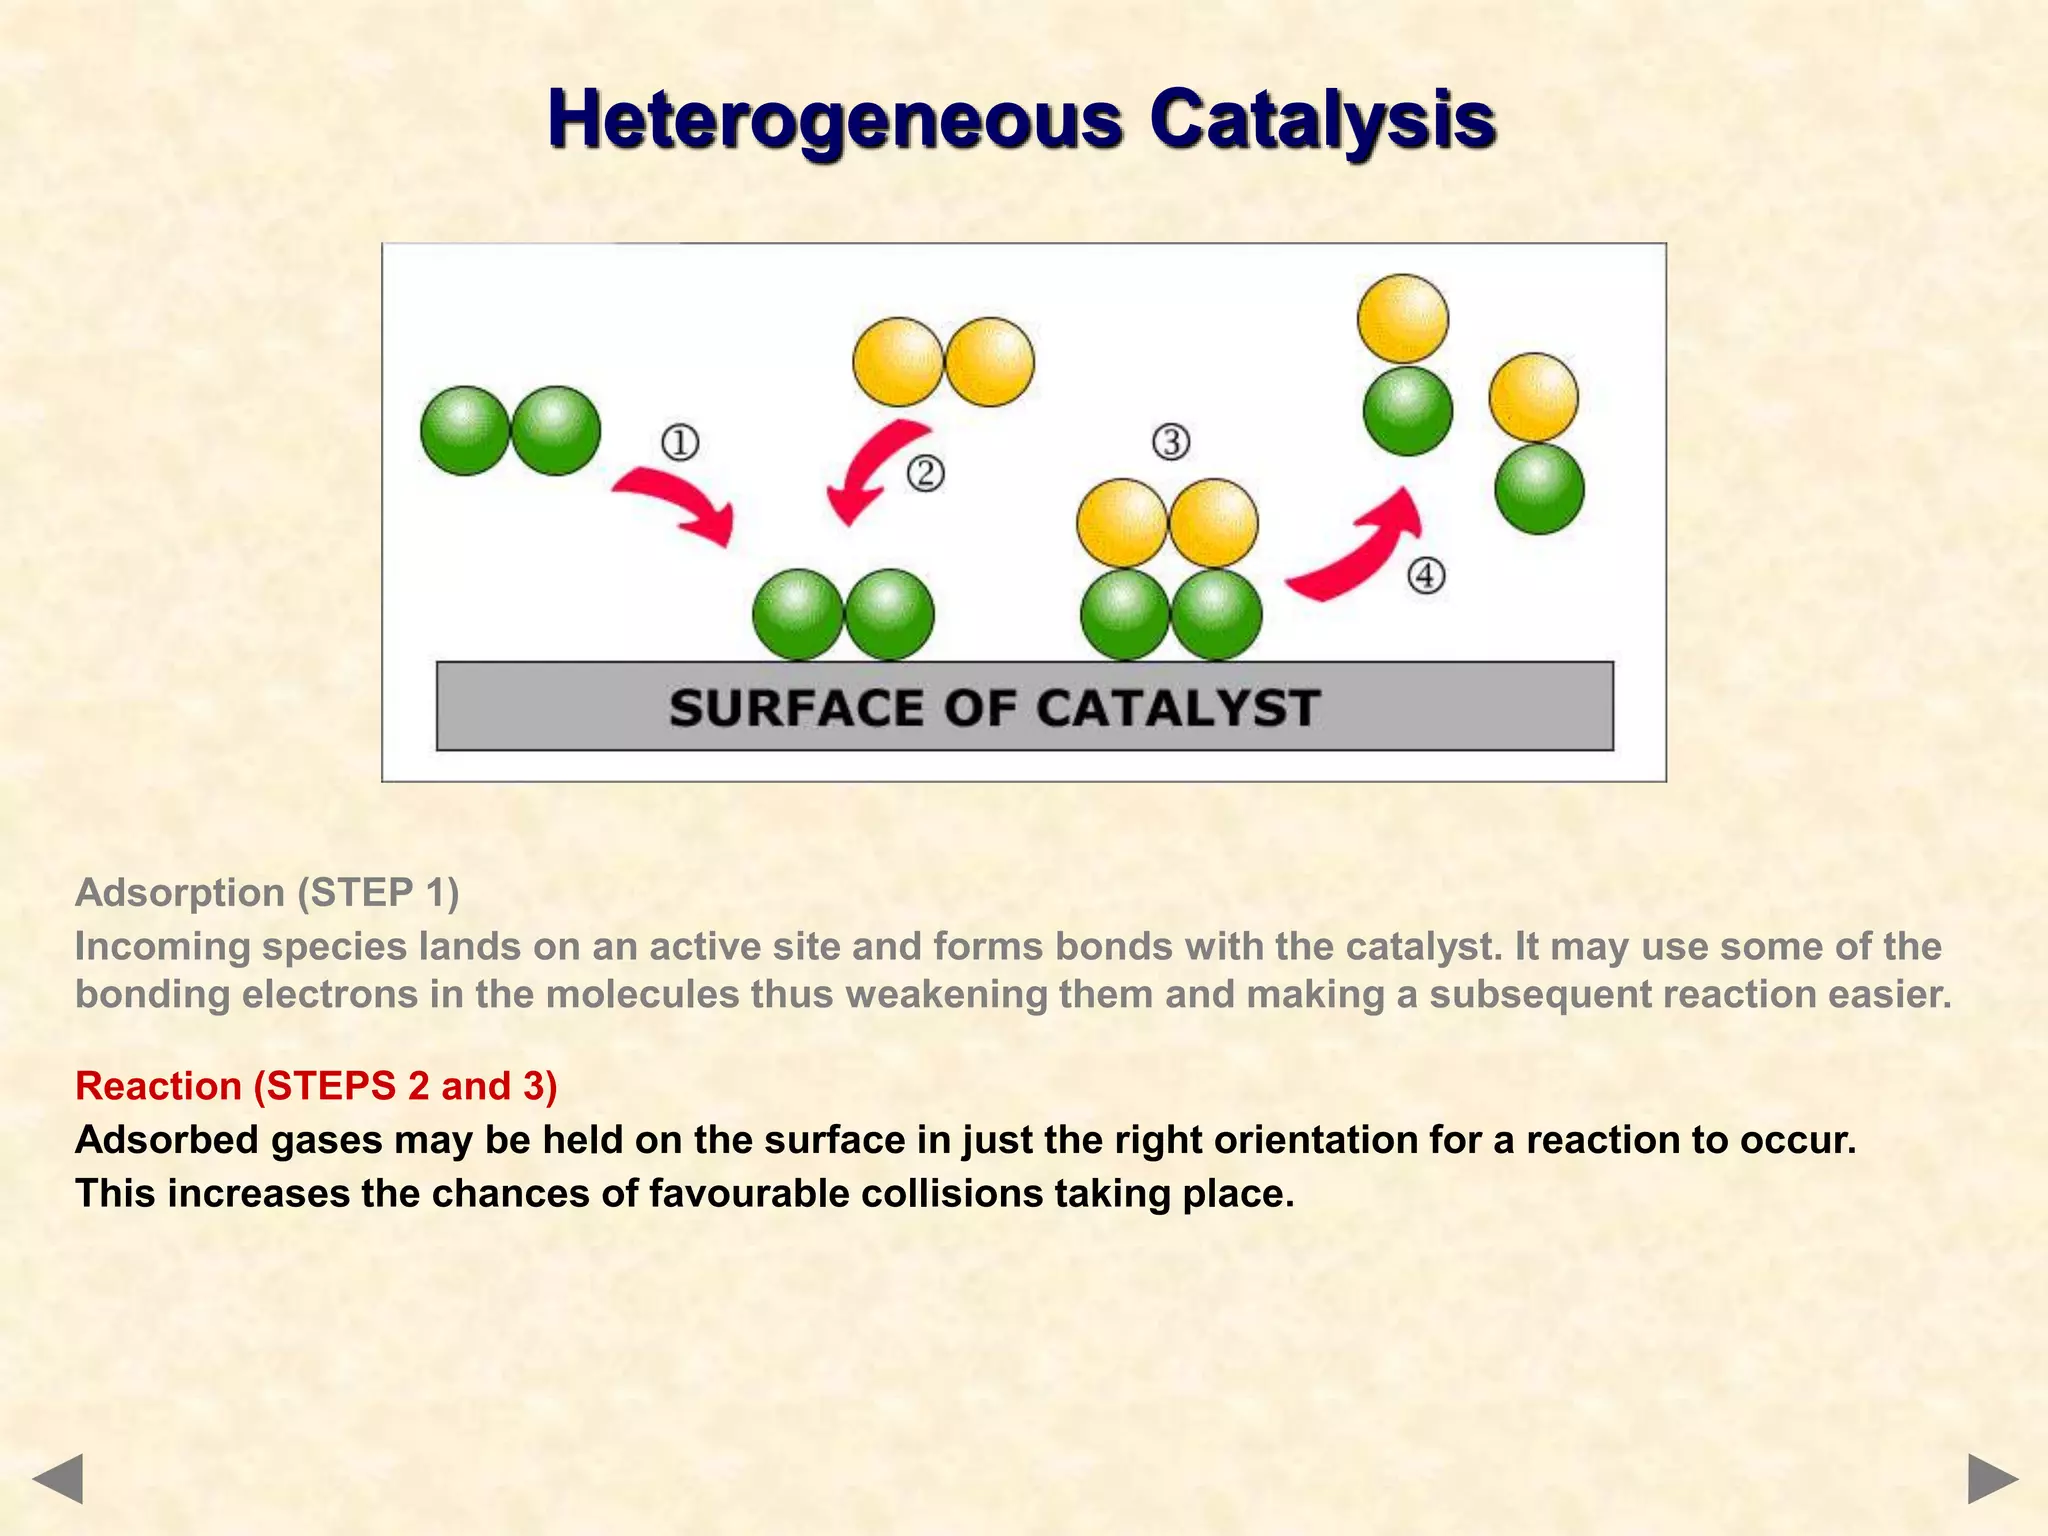
Reactant particles first attach to the catalyst surface.
This process is called:
adsorption
The catalyst can then:
- hold particles close together
- weaken existing bonds
- orient reactants favourably
- provide a lower-energy reaction pathway
The products eventually leave the surface, called desorption.
Surface Catalysis
A simplified heterogeneous catalytic process can be described as:
- reactants move toward the catalyst
- reactants adsorb onto active sites
- bonds in the reactants may weaken
- atoms rearrange
- new bonds form
- products desorb
- catalyst surface is available again

The solid catalyst itself remains available for further reactions.
Active Sites
The most important regions of many heterogeneous catalysts are called active sites.
An active site is a location on the catalyst surface where reactant particles can:
- adsorb
- become activated
- react
- form products
Increasing the available catalyst surface area can expose more active sites.
That is why industrial catalysts are often designed with:
very large surface areas.
Homogeneous Catalysts
A homogeneous catalyst is in the same phase as the reactants.
For example:
catalyst dissolved in the same solution as the reactants
The catalyst may react temporarily to form an intermediate.
That intermediate then reacts further, regenerating the catalyst.
A simplified mechanism might be:
A + C → AC
AC + B → products + C
where:
C = catalyst
Overall:
A + B → products
The catalyst has created a different mechanism with a lower activation-energy pathway.
Biological Catalysts: Enzymes
Living organisms depend on thousands of chemical reactions.
Many of these reactions would occur far too slowly under normal biological conditions without catalysts.
The catalysts used by living organisms are called:
enzymes
Most enzymes are proteins.
Examples include:
- amylase
- catalase
- lipase
- protease
- lactase
- DNA polymerase
Enzymes allow important biological reactions to occur rapidly at relatively mild temperatures.
How Enzymes Work
An enzyme usually contains a region called an:
active site
A reactant molecule, called the substrate, interacts with this active site.
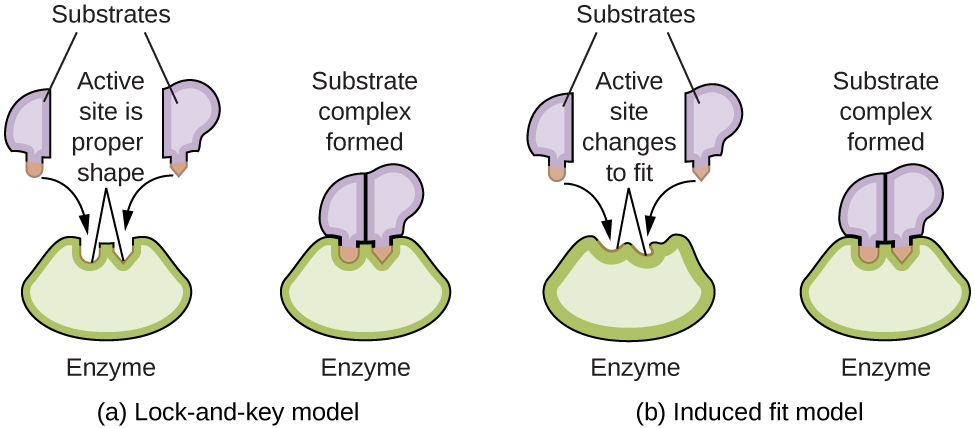
The enzyme helps create a lower-energy pathway for the reaction.
The products then leave the enzyme.
The enzyme can be used again.
The Induced-Fit Model
Modern descriptions of enzyme action often use the induced-fit model.
The active site is not completely rigid.
When a substrate approaches, interactions between the enzyme and substrate can cause a slight change in the enzyme's shape.
This can help:
- position substrates correctly
- strain particular bonds
- stabilize the transition state
- lower activation energy
The result is a much faster reaction.
Enzymes Are Specific
Enzymes often show a high degree of specificity.
This means a particular enzyme may catalyze:
- one specific reaction
- one type of substrate
- a small group of closely related reactions
The shape and chemical environment of the active site help determine which substrates can interact effectively with the enzyme.
Example: Catalase
Catalase is an enzyme found in many living cells.
It helps decompose hydrogen peroxide.
Hydrogen peroxide can be harmful to cells, so it is useful to remove it rapidly.
The reaction is:
2H₂O₂ → 2H₂O + O₂
Catalase dramatically increases the rate of this reaction.
Oxygen gas produced by the reaction can often be observed as bubbles or foam.
Enzyme Catalysis in the Human Body
Enzymes are essential because the human body operates at approximately:
37°C
Many important reactions would be extremely slow at this temperature without enzymes.
For example:
Amylase
Catalyzes the breakdown of starch.
Proteases
Catalyze the breakdown of proteins.
Lipases
Catalyze reactions involving fats.
Lactase
Catalyzes the breakdown of lactose.
Carbonic anhydrase
Rapidly catalyzes reactions involving carbon dioxide and water that are important in maintaining acid-base balance.
Catalysts in Industry
Catalysts are used extensively in chemical manufacturing.
Without catalysts, many industrial reactions would be:
- too slow
- too energy-intensive
- too expensive
- impractical at useful production rates
Industrial catalysts help manufacturers produce chemicals efficiently while controlling energy use and operating costs.
Industrial Example 1: The Haber Process
The Haber process produces ammonia.
Ammonia is extremely important because it is used to make nitrogen fertilizers and many other chemicals.
The reaction is:
N₂(g) + 3H₂(g) ⇌ 2NH₃(g)
An iron-based catalyst is used.
The iron catalyst increases the rate of both forward and reverse reactions, allowing equilibrium to be reached more quickly. It does not change the equilibrium position.
The Haber Catalyst
Nitrogen molecules contain an extremely strong:
N≡N triple bond
This contributes to the difficulty of reacting nitrogen.
On the iron catalyst surface:
- nitrogen and hydrogen can adsorb
- bonds can be weakened
- particles are held in favourable positions
- ammonia can form through a lower-energy sequence of steps
The catalyst therefore helps the reaction proceed at an industrially useful rate.
Haber Process Flow
A simplified Haber plant contains:
- nitrogen and hydrogen supply
- compression system
- catalytic reactor
- cooling system
- ammonia separation
- recycling of unreacted gases
The reactor contains a solid iron-based catalyst.
Unreacted nitrogen and hydrogen can be recycled through the process rather than discarded.
Why the Catalyst Matters in the Haber Process
Without a catalyst, nitrogen and hydrogen react too slowly under practical industrial conditions.
Increasing the temperature could increase the rate, but high temperatures:
- require more energy
- increase operating costs
- can affect the equilibrium yield of reversible exothermic reactions
The catalyst allows an acceptable reaction rate without relying entirely on even more extreme operating conditions.
This is a major economic advantage.
Industrial Example 2: The Contact Process
Sulfuric acid is one of the world's most important industrial chemicals.
During the Contact process, sulfur dioxide is oxidized to sulfur trioxide:
2SO₂(g) + O₂(g) ⇌ 2SO₃(g)
A commonly used catalyst is:
vanadium(V) oxide, V₂O₅
The catalyst helps the reaction occur at a sufficiently rapid rate at practical operating temperatures.
Why Sulfuric Acid Production Matters
Sulfuric acid is used in:
- fertilizer manufacture
- metal processing
- detergents
- chemical production
- petroleum processing
- batteries
Large-scale manufacture therefore requires a process that is:
fast, efficient and economical.
Catalysts are central to achieving this.
Industrial Example 3: Catalytic Converters
Cars with internal-combustion engines can produce pollutants such as:
- carbon monoxide, CO
- nitrogen oxides, NOₓ
- unburned hydrocarbons
A catalytic converter contains catalysts that help convert these pollutants into less harmful substances.
Common catalytic metals include:
- platinum, Pt
- palladium, Pd
- rhodium, Rh
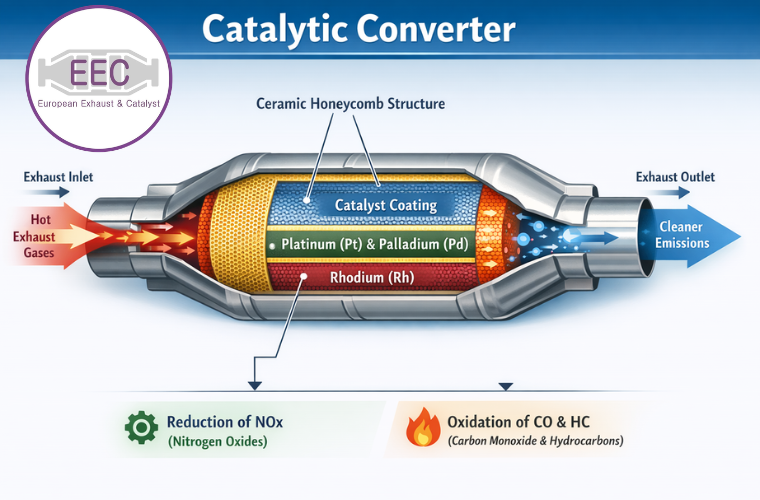
The metals are spread over a large surface area inside a honeycomb structure.
Why Use a Honeycomb Structure?
A catalyst works at its surface.
Therefore a catalytic converter is designed to provide a very large surface while remaining compact.
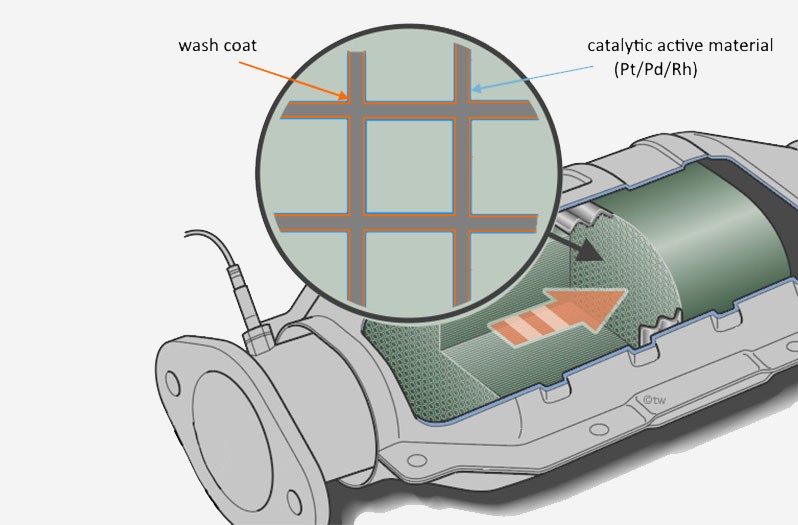
The honeycomb contains many narrow channels.
The channels are coated with catalytic material.
As hot exhaust gases pass through them, pollutant molecules contact the catalyst surface and react more rapidly.
Reactions in a Catalytic Converter
Different reactions can occur inside the converter.
For example, carbon monoxide may be oxidized:
2CO + O₂ → 2CO₂
Unburned hydrocarbons can be oxidized to form mainly:
CO₂ + H₂O
Nitrogen oxides can be reduced to form:
N₂
The catalyst increases the rate at which these transformations occur as the exhaust passes through the vehicle's exhaust system.
Industrial Hydrogenation
Catalysts are also used for hydrogenation reactions.
For example, hydrogen can be added across carbon-carbon double bonds.
Nickel and some other transition metals can act as catalysts for hydrogenation.
The reactant molecules adsorb onto the catalyst surface, where their bonds can interact more easily.
This creates an alternative reaction mechanism with lower activation energy.
Hydrogenation is used in:
- chemical manufacturing
- petrochemicals
- synthesis of organic compounds
Why Are Transition Metals Often Good Catalysts?
Many industrial catalysts involve transition metals such as:
- iron
- nickel
- platinum
- palladium
- rhodium
Transition metals are often effective because their surfaces can interact with reactant molecules.
They may:
- adsorb reactants
- weaken bonds
- stabilize intermediates
- allow different reaction pathways
- support changes in oxidation state
Different metals are suitable for different reactions.
There is no single universal catalyst.
Catalyzed vs Uncatalyzed Reaction Graph
Imagine measuring product formation with time.
An uncatalyzed reaction might produce this pattern:
slow rise → long time to plateau
The same reaction with a catalyst might show:
steeper rise → plateau reached sooner
If the starting amounts are otherwise the same, both may reach the same final amount of product.
The catalyst changes:
how quickly the final state is reached
not necessarily:
how much product can ultimately exist.
Catalysts and Equilibrium
For a reversible reaction:
A ⇌ B
a catalyst speeds up:
A → B
and:
B → A
It lowers the activation-energy barriers for the forward and reverse processes.
Therefore equilibrium is reached:
more quickly
but the catalyst does not shift the equilibrium toward either side.
This is important in industrial chemistry.
A Catalyst Does Not Increase Equilibrium Yield
Suppose a reversible reaction eventually reaches:
60% products
without a catalyst.
Adding a catalyst does not automatically change this to:
80% products
The system may still reach approximately the same equilibrium composition.
It simply gets there faster.
Therefore:
catalyst changes rate, not equilibrium position.
Why Are Catalysts Economically Important?
Industrial reactions often involve enormous quantities of chemicals.
Even a small improvement in reaction rate can have a major economic effect.
A faster process can mean:
- more product produced per hour
- smaller reactors for a given production rate
- shorter processing times
- more efficient use of equipment
This can reduce the cost of manufacturing.
Catalysts Can Reduce Energy Requirements
Many reactions could theoretically be accelerated by increasing temperature.
But heating industrial reactors requires large amounts of energy.
A catalyst can allow a useful reaction rate at a lower temperature than might otherwise be required.
This can mean:
less fuel
lower electricity demand
lower operating cost
and potentially:
lower greenhouse-gas emissions.
Catalysts and Pressure
Some industrial reactions involve gases at high pressure.
Building and operating high-pressure equipment can be expensive.
It requires:
- strong reaction vessels
- powerful compressors
- more energy
- extensive safety systems
A catalyst does not necessarily remove the need for pressure, but by increasing reaction rate it can help make a practical set of operating conditions possible.
Catalysts and Green Chemistry
Catalysts are important in green chemistry, which aims to reduce the environmental impact of chemical production.
Effective catalysts may allow:
- lower reaction temperatures
- lower energy consumption
- fewer unwanted side reactions
- less waste
- better product selectivity
- reduced use of raw materials
Catalysts can therefore improve both:
economic efficiency
and:
environmental performance.
Selectivity
Some catalysts do more than increase reaction rate.
They can favour one reaction pathway over another.
This property is called:
selectivity
Suppose reactant A could produce:
product B
or:
product C
A suitable catalyst might strongly favour the pathway to B.
This is valuable because industrial manufacturers often want one specific product and want to minimize unwanted by-products.
Biological Catalysts in Industry
Enzymes are also used commercially.
Because they can work under relatively mild conditions, enzymes can reduce the need for extreme temperatures or harsh chemicals.
Industrial enzyme applications include:
- food processing
- detergents
- brewing
- cheese production
- biotechnology
- pharmaceuticals
- biofuel production
The specificity of enzymes can also help reduce unwanted side reactions.
Enzymes in Detergents
Some laundry detergents contain enzymes such as:
proteases
which help break down protein stains,
lipases
which help break down fats,
and:
amylases
which help break down starches.
These biological catalysts allow stain-removal reactions to occur more rapidly under washing conditions.
Enzymes in Food Production
Enzymes are widely used in food processing.
For example:
lactase
can be used to break lactose into simpler sugars when producing lactose-reduced or lactose-free products.
Enzymes can also be used in:
- baking
- brewing
- cheese production
- fruit-juice processing
Their specificity makes them particularly useful catalysts.
Enzyme Activity Depends on Conditions
Unlike many simple industrial catalysts, enzymes are complex biological molecules.
Their catalytic activity depends strongly on conditions such as:
- temperature
- pH
- substrate concentration
Very high temperatures can disrupt an enzyme's three-dimensional structure.
This is called:
denaturation
The active site may change shape, reducing catalytic activity.
So although enzymes are catalysts, they require suitable operating conditions.
Catalyst Poisoning
Catalysts may lose activity if unwanted substances bind strongly to their active sites.
This is called:
catalyst poisoning
If the active sites become blocked:
- reactants cannot adsorb effectively
- fewer catalytic reactions occur
- reaction rate decreases
Industrial feed gases may therefore need to be purified before they reach expensive catalysts.
Catalyst Surface Area
Because heterogeneous catalysis occurs on the surface, a larger catalyst surface area can provide:
more active sites
Industrial catalysts are often:
- finely divided
- porous
- coated onto high-surface-area supports
- arranged in honeycomb structures
This allows a relatively small mass of catalytic material to interact with a large flow of reactants.
Worked Example 1: Energy Profile
An uncatalyzed reaction has:
Reactant energy = 70 kJ mol⁻¹
Peak energy = 210 kJ mol⁻¹
Product energy = 30 kJ mol⁻¹
Uncatalyzed activation energy:
Eₐ = 210 − 70
= 140 kJ mol⁻¹
A catalyst provides a pathway with a peak of:
135 kJ mol⁻¹
Catalyzed activation energy:
Eₐ = 135 − 70
= 65 kJ mol⁻¹
The enthalpy change remains:
ΔH = 30 − 70
= −40 kJ mol⁻¹
So:
- Eₐ decreases from 140 to 65 kJ mol⁻¹
- reaction rate increases
- ΔH remains −40 kJ mol⁻¹
Worked Example 2: Comparing Rates
Experiment A contains no catalyst.
It takes:
120 s
to produce 50 cm³ of gas.
Experiment B contains a catalyst.
It takes:
35 s
to produce 50 cm³ of gas.
Experiment B is faster.
Why?
The catalyst provides a lower-activation-energy pathway, so more collisions can successfully produce products each second.
Worked Example 3: Same Final Product
Two reactions are followed until completion.
Without catalyst:
100 cm³ product gas after 180 s
With catalyst:
100 cm³ product gas after 50 s
The catalyst has increased:
reaction rate
but has not increased:
the final volume of product
The same amount was produced in less time.
Worked Example 4: Industrial Choice
A manufacturer can operate a reaction at:
700°C without a catalyst
or:
450°C with a catalyst
while achieving a useful production rate.
Why might the catalyst be preferred?
Possible advantages include:
- lower energy consumption
- lower fuel costs
- reduced thermal stress on equipment
- potentially improved safety
- potentially lower emissions associated with energy use
This helps explain the enormous economic importance of catalysts.
Comparing Industrial and Biological Catalysts
| Feature | Industrial Catalyst | Biological Catalyst |
|---|---|---|
| Example | Iron | Catalase |
| Typical setting | Chemical reactor | Living cell |
| Main role | Increase reaction rate | Increase reaction rate |
| Effect on Eₐ | Lowers Eₐ through alternative pathway | Lowers Eₐ through alternative pathway |
| Consumed overall? | No | No |
| Specificity | Varies | Often very high |
| Conditions | May tolerate high T/P | Usually works in narrower biological conditions |
The basic chemical principle is the same:
both provide lower-energy pathways.
Industrial Catalyst Examples
| Process | Catalyst | Purpose |
|---|---|---|
| Haber process | Iron-based catalyst | Ammonia production |
| Contact process | Vanadium(V) oxide | Sulfuric acid production |
| Catalytic converter | Pt, Pd, Rh | Reduces vehicle exhaust pollutants |
| Hydrogenation | Often Ni, Pt or Pd | Adds hydrogen to unsaturated compounds |
These examples demonstrate how widespread catalysis is in modern technology.
Biological Catalyst Examples
| Enzyme | Catalyzed Process |
|---|---|
| Amylase | Starch breakdown |
| Catalase | Hydrogen peroxide decomposition |
| Lipase | Fat breakdown |
| Protease | Protein breakdown |
| Lactase | Lactose breakdown |
| DNA polymerase | DNA synthesis |
Without enzyme catalysis, many life processes would occur far too slowly to sustain normal biological activity.
Common Misconception: Catalysts Increase Particle Energy
Incorrect.
A catalyst does not normally increase the kinetic energy of the particles.
It lowers the energy requirement for a successful reaction pathway.
Common Misconception: Catalysts Increase ΔH
Incorrect.
The reactant and product energies remain unchanged.
Therefore:
ΔH is unchanged.
Common Misconception: Catalysts Are Never Involved in Reactions
Incorrect.
A catalyst may participate in individual reaction steps.
The key is that it is:
regenerated overall.
Common Misconception: Catalysts Produce More Product
Not necessarily.
A catalyst mainly changes:
how quickly the reaction proceeds.
For a reversible reaction at equilibrium, it does not change the equilibrium position.
For a reaction going essentially to completion, it can help the system reach completion faster.
Common Misconception: Catalysts Work by Increasing Collision Frequency
This is incomplete.
The central effect is:
lower activation energy through an alternative pathway.
At the same temperature, this causes a larger fraction of particle collisions to be capable of reaction.
Common Misconception: All Catalysts Work the Same Way
Different catalysts use different mechanisms.
Some:
- adsorb reactants onto surfaces
- form temporary intermediates
- transfer electrons
- transfer protons
- position molecules in favourable orientations
- stabilize transition states
What they share is that they provide a more favourable pathway for the reaction.
Why Are Catalysts So Important?
Modern society depends heavily on catalysis.
Catalysts are involved in producing:
- fertilizers
- fuels
- plastics
- medicines
- food products
- detergents
- acids
- industrial chemicals
They are also involved in:
- pollution control
- petroleum refining
- biological metabolism
- biotechnology
A huge fraction of industrial chemistry relies on catalytic processes.
Did You Know?
A catalyst may completely change the route that reactants take to become products without changing either the starting point or the finishing point.
Think of climbing a mountain.
The uncatalyzed reaction takes a route over a high peak.
The catalyzed reaction finds a lower mountain pass.
Both routes begin and end in the same places.
But one route requires a much smaller energy barrier.
That is the central idea of catalysis.
Evaluating a Catalyst
When choosing an industrial catalyst, chemists may consider:
Activity
How much does it increase reaction rate?
Selectivity
Does it produce the desired product instead of unwanted products?
Stability
Can it survive industrial temperatures and pressures?
Lifetime
How long does it remain active?
Cost
Some catalysts contain expensive metals such as platinum.
Availability
Can sufficient quantities be obtained?
Environmental impact
Does using the catalyst reduce energy use or waste?
The fastest catalyst is not automatically the best industrial choice.
A Strong Catalyst Explanation
Suppose the question asks:
Explain why adding a catalyst increases reaction rate.
A weak answer:
"It makes the reaction faster."
A stronger answer:
"The catalyst provides an alternative reaction pathway with a lower activation energy. At the same temperature, a greater fraction of particle collisions has sufficient energy to react. Therefore, more successful collisions occur per second and the reaction rate increases."
This explanation connects:
catalyst
→ activation energy
→ successful collisions
→ reaction rate
Key Terms
Catalyst – A substance that increases reaction rate without being consumed overall.
Catalysis – The process by which a catalyst increases reaction rate.
Activation energy, Eₐ – The minimum energy barrier associated with a reaction pathway.
Alternative pathway – A different reaction mechanism with a different activation-energy barrier.
Heterogeneous catalyst – A catalyst in a different physical phase from the reactants.
Homogeneous catalyst – A catalyst in the same phase as the reactants.
Enzyme – A biological catalyst.
Active site – Region where reactants or substrates interact with a catalyst or enzyme.
Adsorption – Attachment of particles to a surface.
Desorption – Release of particles from a surface.
Substrate – A reactant upon which an enzyme acts.
Selectivity – Ability of a catalyst to favour a particular reaction or product.
Catalyst poisoning – Loss of catalytic activity caused by substances blocking or interfering with active sites.
Key Takeaways
- A catalyst increases reaction rate without being consumed overall.
- Catalysts provide an alternative reaction pathway.
- The catalyzed pathway has a lower activation energy.
- Lower Eₐ means a larger fraction of collisions can result in reaction.
- Therefore, more successful collisions occur per second.
- Catalysts do not increase the average kinetic energy of reactant particles.
- Catalysts do not change the energy of the reactants or products.
- Catalysts therefore do not change ΔH.
- Catalysts speed both forward and reverse reactions.
- Catalysts allow equilibrium to be reached faster but do not change the equilibrium position.
- Heterogeneous catalysts work at surfaces and active sites.
- Homogeneous catalysts operate in the same phase as the reactants.
- Enzymes are biological catalysts.
- Catalase, amylase, lipase and protease are examples of enzymes.
- Iron-based catalysts are used in the Haber process.
- Vanadium(V) oxide is used in the Contact process.
- Platinum, palladium and rhodium are used in vehicle catalytic converters.
- Catalysts can reduce industrial energy requirements.
- They can lower operating costs and reduce waste.
- Catalysts can also improve product selectivity.
- Industrial catalysts are chosen based on activity, selectivity, stability, cost and environmental impact.
- The essential relationship is:
Catalyst → lower Eₐ pathway → more successful collisions → faster reaction.