Rates of Reaction
1. What Is Reaction Rate?
Learning outcomes
- I can define reaction rate.
- I can explain how reaction rate is measured.
- I can compare fast and slow reactions.
- I can identify factors that influence reaction rate.
- I can interpret reaction rate data.
What Is Reaction Rate?
Chemical reactions do not all happen at the same speed.
Some reactions happen almost instantly, while others may take minutes, hours, days, or even years.
The reaction rate describes how quickly reactants are converted into products.
More precisely:
Reaction rate is the change in the amount or concentration of a reactant or product per unit time.
For example, we might measure:
- how quickly a reactant disappears
- how quickly a product forms
- how quickly gas is produced
- how quickly mass decreases
- how quickly concentration changes
The steeper curve represents a faster reaction because product is being produced more quickly.
Chemical Kinetics
The study of reaction rates is called chemical kinetics.
Kinetics helps chemists answer questions such as:
- How quickly will a reaction occur?
- Why is one reaction faster than another?
- How does temperature affect the rate?
- How does concentration affect the rate?
- Can a catalyst make the reaction faster?
- How can we measure the reaction experimentally?
Reaction rates are extremely important in industry, biology, medicine, food science, environmental science and engineering.
Fast and Slow Reactions
Chemical reactions can occur over enormously different timescales.
A reaction may be:
very fast
such as some combustion or explosive reactions,
or:
very slow
such as rusting.
A fast reaction produces a large change in a short period of time.
A slow reaction produces the same kind of change over a longer period of time.
Examples of Fast Reactions
Examples of relatively fast reactions include:
- burning fuels
- fireworks
- some acid-base reactions
- some precipitation reactions
- combustion of hydrogen
- some metal-acid reactions
For example:
Mg + 2HCl → MgCl₂ + H₂
Magnesium can react rapidly with hydrochloric acid, producing hydrogen gas.
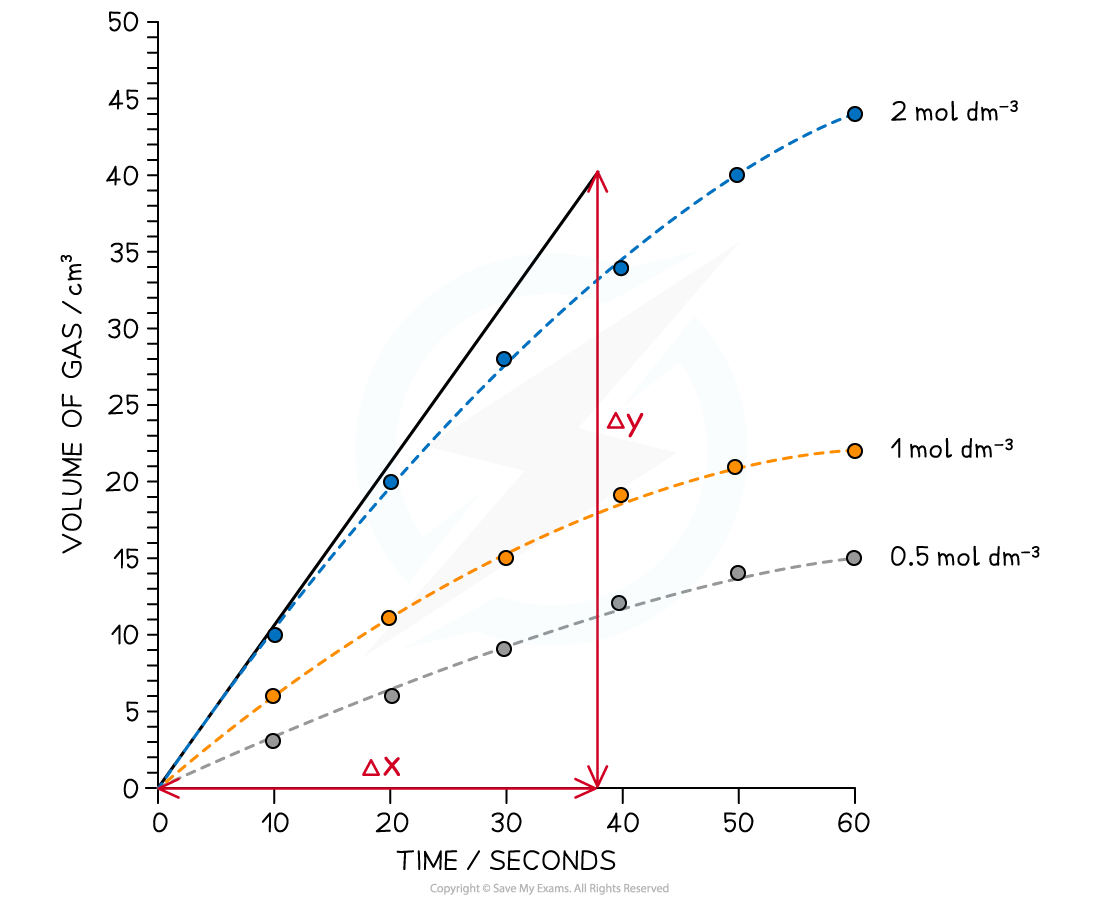
The faster hydrogen gas is produced, the faster the chemical reaction is occurring.
Examples of Slow Reactions
Some chemical reactions occur much more slowly.
Examples include:
- rusting of iron
- weathering of rocks
- some decomposition reactions
- slow oxidation of foods
- chemical changes involved in ageing materials
Rust may take days, months or years to become obvious.
A slow reaction does not mean that no reaction is occurring.
It means the change per unit time is relatively small.
Measuring Reaction Rate
To measure a reaction rate, we need to observe some quantity that changes as the reaction proceeds.
A simple general equation is:
Reaction rate = change in quantity ÷ change in time
The quantity might be:
- concentration
- mass
- volume of gas
- amount of substance
- colour intensity
- cloudiness
For concentration:
Rate = change in concentration ÷ time
Reaction rate expressed using concentration is commonly measured in units such as:
mol dm⁻³ s⁻¹
or:
mol L⁻¹ s⁻¹.
Measuring the Disappearance of a Reactant
One way of measuring reaction rate is to monitor how quickly a reactant disappears.
Imagine a reactant has concentration:
1.00 mol dm⁻³
at the start.
After 20 seconds its concentration has fallen to:
0.60 mol dm⁻³
The concentration change is:
1.00 − 0.60 = 0.40 mol dm⁻³
Average rate of reactant disappearance:
0.40 ÷ 20
= 0.020 mol dm⁻³ s⁻¹
On a concentration-time graph, reactant concentration normally decreases as the reaction proceeds.
Measuring the Formation of a Product
Instead of measuring a disappearing reactant, we can measure a product that forms.
Suppose a reaction produces:
60 cm³ of gas
in:
30 s
Average rate:
60 ÷ 30
= 2.0 cm³ s⁻¹
The rate can therefore be expressed as:
2.0 cm³ of gas per second

A steep part of the graph indicates rapid gas production.
A shallow part indicates slower gas production.
A horizontal section means no additional gas is being produced.
Why Does the Rate Usually Change?
Many reactions are fastest near the beginning.
This is because there are usually more reactant particles present at the start.
As reactants are consumed:
reactant concentration decreases
so:
collisions become less frequent
and the reaction often slows down.
Eventually, one of the reactants may be used up.
Then:
reaction rate = 0
Notice how the curve begins steep and gradually becomes flatter.
Measuring Gas Volume
If a reaction produces a gas, a gas syringe can be used.
For example:
Mg + 2HCl → MgCl₂ + H₂
The hydrogen gas can be collected in a gas syringe.
Measurements might be recorded every:
10 s
or:
20 s
For example:
| Time (s) | Gas Volume (cm³) |
|---|---|
| 0 | 0 |
| 10 | 18 |
| 20 | 31 |
| 30 | 40 |
| 40 | 46 |
| 50 | 49 |
| 60 | 50 |
The gas volume increases rapidly at first and then levels off.
Why Does the Gas-Volume Graph Level Off?
Consider this graph:
At first:
the gradient is large
so:
reaction rate is high
Later:
the gradient becomes smaller
so:
reaction rate decreases
Finally:
gradient = 0
so:
reaction has stopped
The flat section does not mean the gas has disappeared.
It means no additional gas is being produced.
Measuring Rate by Mass Loss
If a reaction produces a gas that escapes from the apparatus, the total mass of the apparatus may decrease.
A common example is:
CaCO₃ + 2HCl → CaCl₂ + H₂O + CO₂
Carbon dioxide escapes into the air.
The mass therefore decreases.

A balance can be used to record the mass at regular time intervals.
A loose cotton wool plug can reduce liquid spray while still allowing the gas to escape.
Example: Mass Loss
Suppose the initial mass is:
150.0 g
After 40 seconds:
148.8 g
Mass lost:
150.0 − 148.8 = 1.2 g
Average rate of mass loss:
1.2 ÷ 40
= 0.030 g s⁻¹
The rate is:
0.030 g s⁻¹
This provides a convenient measure of how quickly the gas-producing reaction is occurring.
Measuring a Change in Appearance
Not every rate experiment requires a gas syringe or balance.
Sometimes a visible change can be timed.
A classic example is the reaction between sodium thiosulfate and hydrochloric acid.
Sulfur forms as a solid precipitate, making the mixture increasingly cloudy.
A cross is placed underneath the flask.
The time taken for the cross to disappear is measured.
A shorter time means:
faster reaction
A longer time means:
slower reaction
For this type of experiment, a simple relative measure is often:
Rate ∝ 1 ÷ time
Comparing Fast and Slow Reactions on a Graph
Two reactions may produce the same final amount of product but at different rates.
The faster reaction:
- rises more steeply
- reaches the plateau sooner
The slower reaction:
- rises more gradually
- takes longer to reach the plateau
If both finish at the same height, they have produced the same final amount of product.
The difference is how quickly they got there.
Gradient and Reaction Rate
The gradient, or slope, of a reaction graph tells us how quickly the measured quantity is changing.
For a product-time graph:
steeper gradient = faster reaction
shallower gradient = slower reaction
horizontal line = zero rate
Gradient can be calculated using:
Gradient = change in y ÷ change in x
For a gas-volume graph:
Rate = change in gas volume ÷ change in time
Worked Example: Rate from a Graph
Suppose gas volume increases from:
20 cm³
to:
50 cm³
between:
10 s
and:
30 s
Change in volume:
50 − 20 = 30 cm³
Change in time:
30 − 10 = 20 s
Average rate:
30 ÷ 20
= 1.5 cm³ s⁻¹
Therefore:
average reaction rate = 1.5 cm³ s⁻¹
Average Rate
An average reaction rate describes the rate over a particular time interval.
For example:
Between 0 and 20 s:
Rate = change ÷ 20 s
This does not mean the reaction was occurring at exactly that rate at every instant during those 20 seconds.
It is an average.
Instantaneous Rate
The instantaneous rate is the rate at a specific moment.
On a curved graph, this can be estimated by drawing a tangent at the point of interest and finding its gradient.

A steep tangent has a large gradient and represents a faster rate.
A shallow tangent represents a slower rate.
For an introductory course, the most important concept is:
slope tells us rate.
Initial Rate
The initial rate is the reaction rate at the very beginning of the reaction.
This is often particularly useful because reactant concentrations are known accurately at the start.
For many reactions, the initial rate is also the greatest rate because reactant concentrations are highest at the beginning.
The steeper initial curve corresponds to the faster initial reaction.
Reactant and Product Graphs
During a reaction:
reactant concentration normally decreases
while:
product concentration normally increases
At the start:
there is a lot of reactant and little product.
As time passes:
reactant is consumed and product accumulates.
Eventually, if the reaction reaches completion:
the curves level off.
Why Do Chemical Reactions Need Collisions?
For particles to react, they usually need to encounter one another.
This idea forms the basis of collision theory.
Reacting particles must:
- collide
- collide with sufficient energy
- often collide with a suitable orientation
Not every collision causes a reaction.
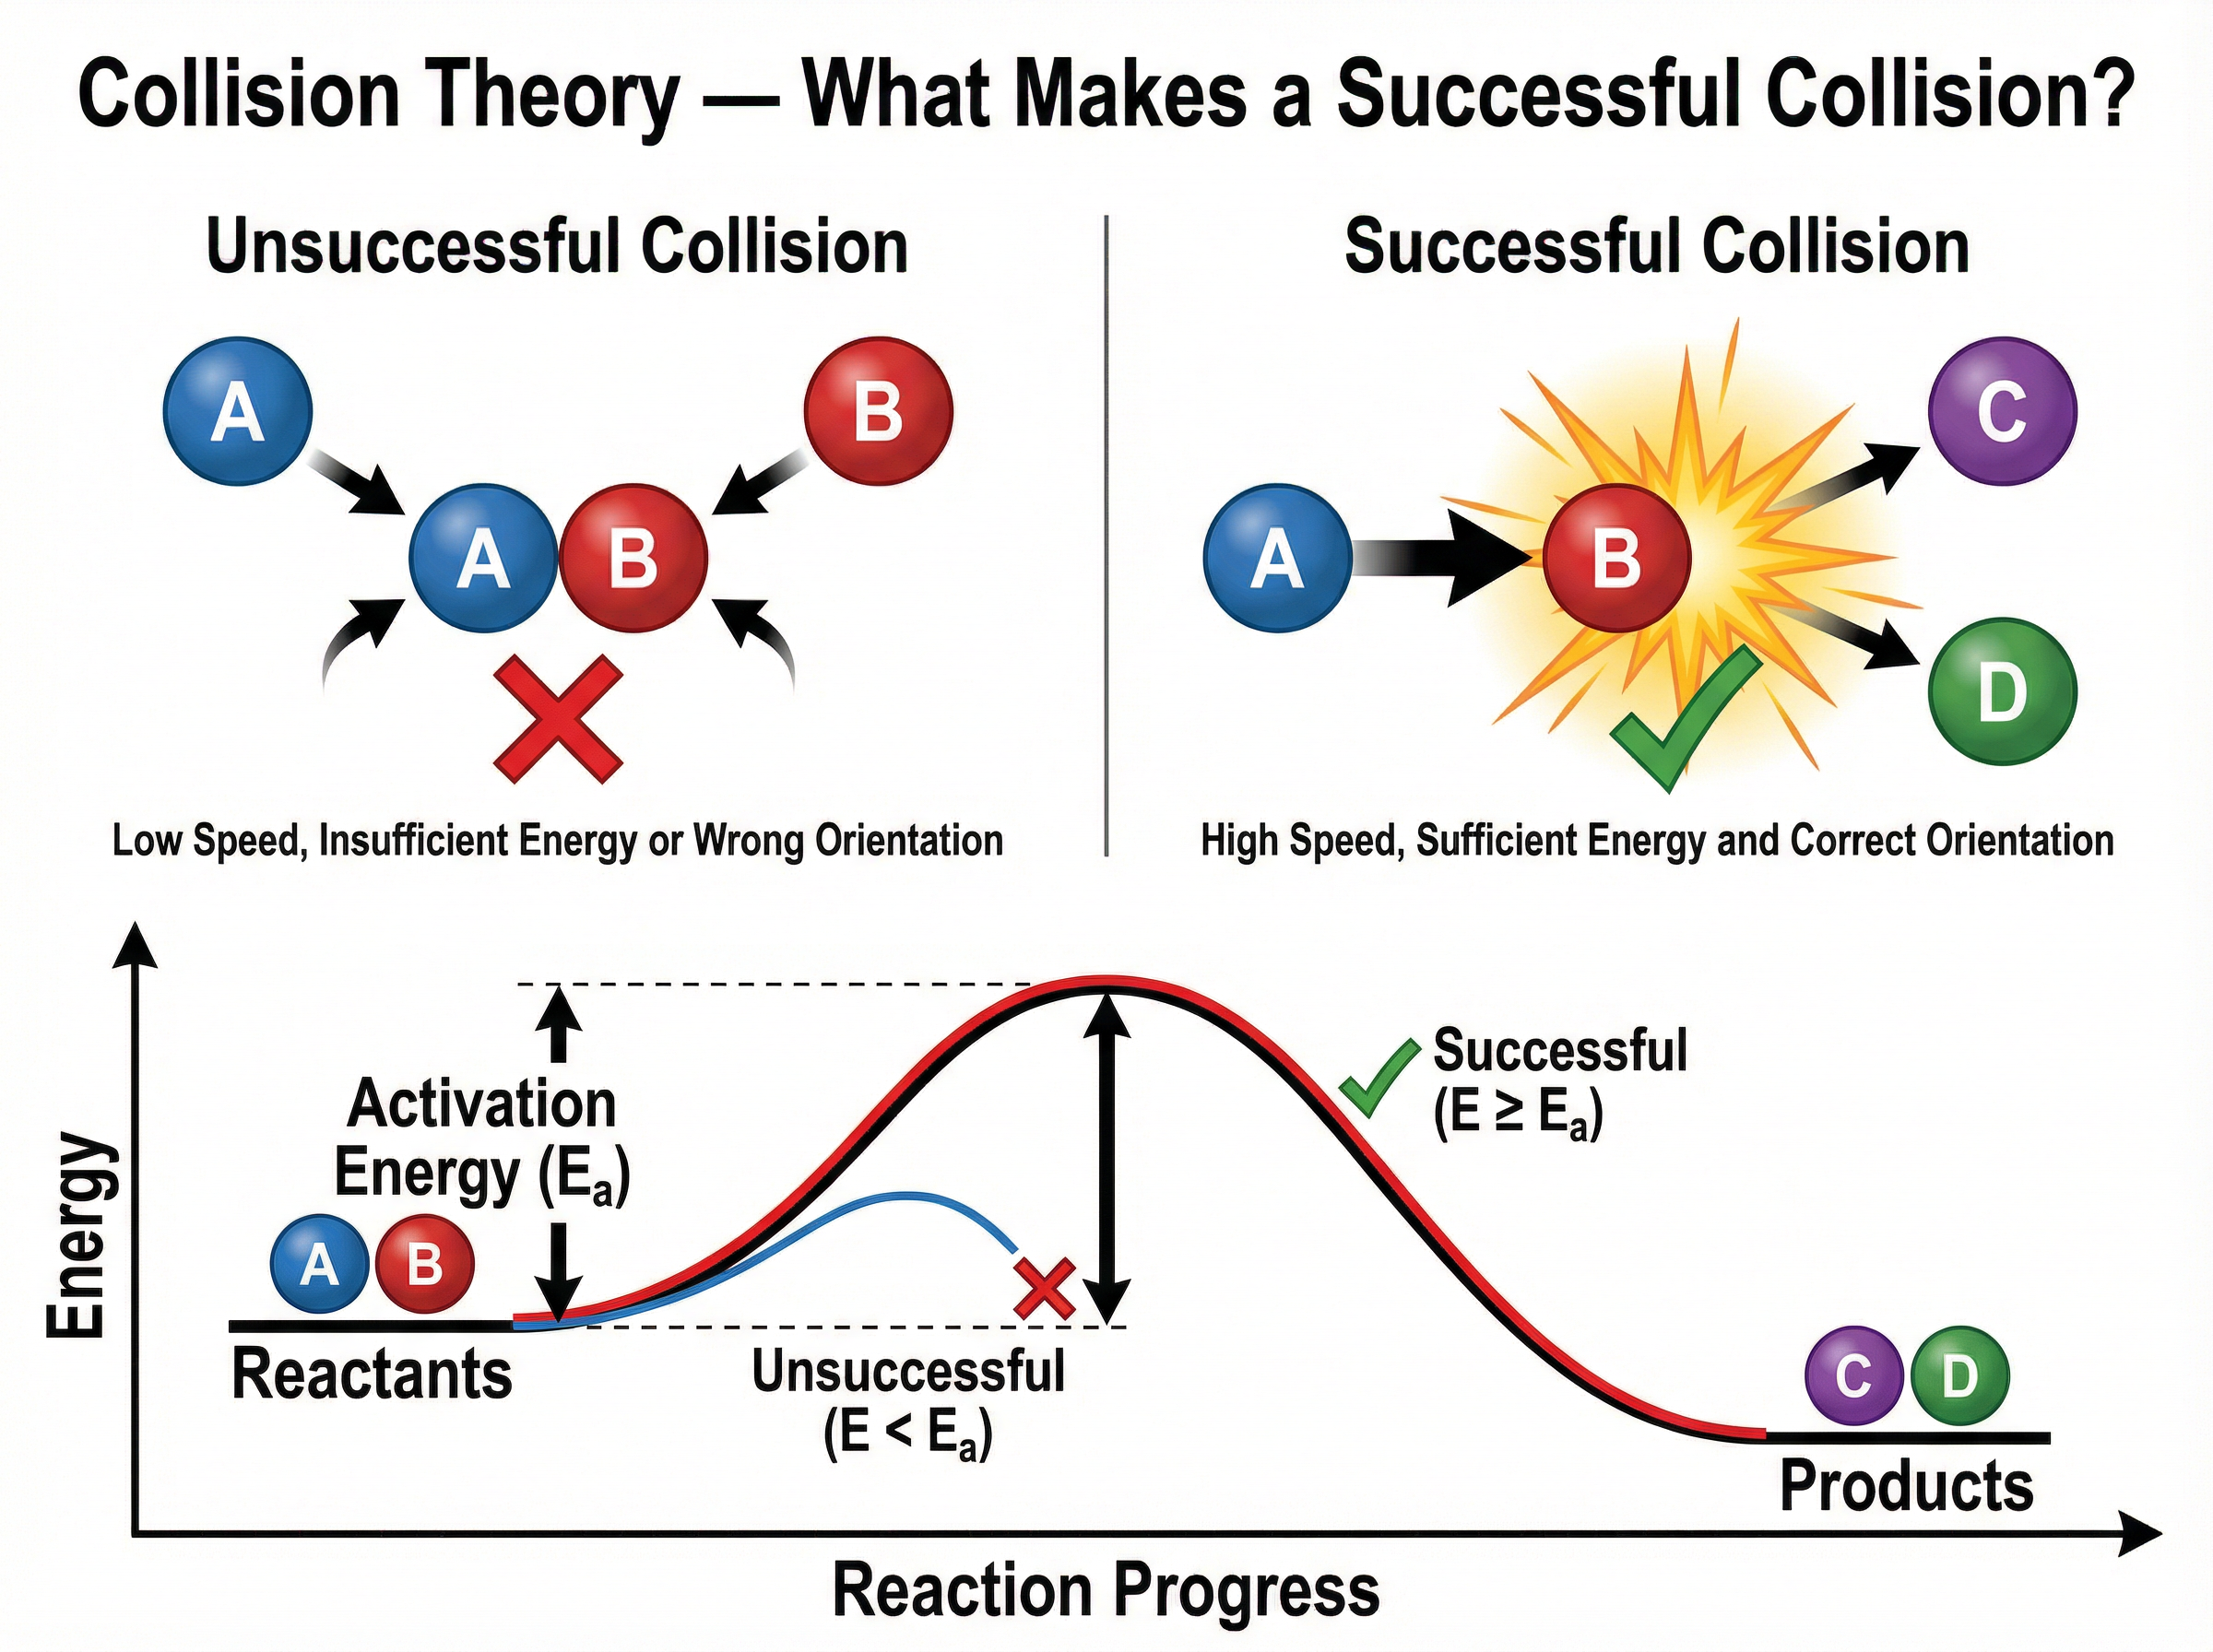
A collision that leads to reaction is called a successful collision.
What Determines Reaction Rate?
Reaction rate depends strongly on the number of successful collisions per unit time.
If successful collisions happen frequently:
reaction rate is high
If successful collisions happen rarely:
reaction rate is low
Several factors can change the frequency or effectiveness of collisions.
Main Factors Affecting Reaction Rate
Important factors include:
- temperature
- concentration
- pressure of gases
- surface area of solids
- catalysts
- nature of the reactants

These factors will be examined in more detail later in the unit.
For now, the key idea is:
anything that increases the frequency of successful collisions can increase reaction rate.
Effect of Concentration
Increasing the concentration of a reactant means there are more reactant particles in the same volume.
This usually causes:
more frequent collisions
and therefore:
more successful collisions per second
so:
reaction rate increases
Notice that the higher-concentration reaction has the steeper initial gradient.
Effect of Temperature
Increasing temperature gives particles more kinetic energy.
They move faster.
This can increase reaction rate in two important ways:
- collisions occur more frequently
- a greater fraction of collisions have enough energy to react
Higher temperature therefore generally produces a faster reaction.
Effect of Surface Area
When a solid reactant is involved, only particles at its exposed surface can directly collide with particles from another reactant.
Breaking a solid into smaller pieces increases its total surface area.
That exposes more particles.
Therefore:
larger surface area → more collisions → faster reaction
Powders usually react more rapidly than large pieces of the same mass because they have a much larger total exposed surface area.
Effect of a Catalyst
A catalyst increases reaction rate without being consumed overall.
A catalyst provides an alternative reaction pathway with a lower activation energy.
This allows a greater fraction of collisions to be successful.
A catalyst changes the rate, but it does not change the overall amount of reactant or product expected from the same limiting reactant.
Faster Does Not Mean More Product
This is an important distinction.
Suppose the same quantity of reactant is used in two experiments.
Experiment A is faster.
Experiment B is slower.
If both eventually react completely, they may produce the same final amount of product.
The faster reaction simply reaches the final amount sooner.
So:
reaction rate tells us how quickly something happens
not necessarily:
how much product is ultimately produced.
Reading Reaction-Rate Data
Consider this table:
| Time (s) | Volume of Gas (cm³) |
|---|---|
| 0 | 0 |
| 10 | 20 |
| 20 | 35 |
| 30 | 45 |
| 40 | 51 |
| 50 | 54 |
| 60 | 55 |
What can we learn?
Between 0 and 10 seconds:
20 cm³ gas forms.
Between 50 and 60 seconds:
only 1 cm³ forms.
Therefore:
the reaction is much faster near the beginning than near the end.
Calculating Rates from the Data
From 0 to 10 s:
Rate = 20 ÷ 10
= 2.0 cm³ s⁻¹
From 50 to 60 s:
Rate = (55 − 54) ÷ 10
= 0.10 cm³ s⁻¹
Comparison:
2.0 cm³ s⁻¹ > 0.10 cm³ s⁻¹
Therefore, the reaction was much faster during the first ten seconds.
Turning Data into a Graph
The table can be plotted as:
volume of gas vs time
The result would resemble this:
The graph tells the story of the reaction:
At first:
steep slope → fast reaction
Later:
shallower slope → slower reaction
Finally:
horizontal → reaction finished
Comparing Two Data Sets
Suppose two experiments give:
| Time (s) | Reaction A Gas Volume (cm³) | Reaction B Gas Volume (cm³) |
|---|---|---|
| 0 | 0 | 0 |
| 10 | 30 | 15 |
| 20 | 47 | 28 |
| 30 | 55 | 39 |
| 40 | 60 | 48 |
| 50 | 60 | 55 |
| 60 | 60 | 60 |
Reaction A reaches:
60 cm³ at 40 s
Reaction B reaches:
60 cm³ at 60 s
Therefore:
Reaction A is faster.
Both produce:
60 cm³ total gas
so the final amount of product is the same.
Reaction Rate and Units
The units of reaction rate depend on what is being measured.
If measuring mass:
g s⁻¹
If measuring gas volume:
cm³ s⁻¹
If measuring concentration:
mol dm⁻³ s⁻¹
If measuring amount of substance:
mol s⁻¹
So there is no single rate unit for every school-level experiment.
The units must match the measured quantity and the time unit.
Reaction Rate in Everyday Life
Reaction rate matters in many situations.
Food
Refrigeration slows many chemical and biological processes.
Cooking
Higher temperatures generally make chemical changes occur faster.
Medicines
Reaction and decomposition rates affect how drugs are manufactured and stored.
Engines
Fuel must react rapidly enough to release useful energy.
Corrosion
Engineers try to slow oxidation and rusting.
Industry
Factories may use catalysts and controlled temperatures to produce chemicals quickly and economically.
Why Do We Refrigerate Food?
Food spoilage involves many chemical and biological reactions.
Reducing temperature generally decreases reaction rate.
Particles have less kinetic energy, and fewer collisions have sufficient energy to produce chemical change.
This is one reason food lasts longer in a refrigerator than at room temperature.
The reactions have not completely stopped.
They have been slowed down.
Why Can Powdered Materials React Quickly?
Consider the same mass of calcium carbonate as:
one large piece
versus:
many small pieces
The smaller pieces have a greater total surface area.
More calcium carbonate particles are exposed to the acid.
Therefore, more collisions can occur at the same time.
This explains why finely divided substances can sometimes react very rapidly.
Reaction Rate and Safety
Reaction rate is not merely an academic idea.
It can also affect safety.
A reaction that releases energy slowly may be manageable.
The same chemical change occurring extremely rapidly could produce:
- rapid heating
- high pressures
- large amounts of gas
- fire
- an explosion
Understanding reaction kinetics helps scientists and engineers control reactions safely.
Reaction Rate vs Reaction Energy
Do not confuse reaction rate with reaction energy.
Reaction rate asks:
How quickly does the reaction occur?
Reaction energy asks:
How much energy is absorbed or released?
A highly exothermic reaction could still be slow if it has a large activation-energy barrier.
A less energetic reaction could occur much faster.
The two ideas are related but are not the same.
Reaction Rate vs Activation Energy
Activation energy is the minimum energy required for a successful reaction pathway.
A reaction with a large activation-energy barrier may be slow because relatively few particle collisions have enough energy.
A catalyst can lower that barrier.
Lowering activation energy allows a larger fraction of collisions to become successful.
Worked Example 1: Product Formation
A reaction produces:
48 cm³ of gas
in:
24 s
Calculate the average rate.
Rate = change in volume ÷ time
Rate = 48 ÷ 24
Rate = 2.0 cm³ s⁻¹
Therefore:
Average rate = 2.0 cm³ s⁻¹
Worked Example 2: Mass Loss
A flask loses:
3.6 g
in:
120 s
Rate:
3.6 ÷ 120
= 0.030 g s⁻¹
Therefore:
Average rate = 0.030 g s⁻¹
Worked Example 3: Concentration Change
A reactant concentration decreases from:
0.80 mol dm⁻³
to:
0.50 mol dm⁻³
in:
30 s
Change in concentration:
0.80 − 0.50
= 0.30 mol dm⁻³
Rate of disappearance:
0.30 ÷ 30
= 0.010 mol dm⁻³ s⁻¹
Worked Example 4: Comparing Rates
Reaction A produces:
100 cm³ gas in 50 s
Reaction B produces:
100 cm³ gas in 80 s
Average rate A:
100 ÷ 50 = 2.0 cm³ s⁻¹
Average rate B:
100 ÷ 80 = 1.25 cm³ s⁻¹
Therefore:
Reaction A is faster.
Worked Example 5: Interpreting a Graph
Suppose two curves reach the same plateau.
Curve A reaches the plateau in:
30 seconds
Curve B reaches it in:
70 seconds
We can conclude:
- A is faster
- B is slower
- both produce the same final amount of product
We cannot automatically conclude that Reaction A released more energy.
Rate and energy are different properties.
What Does a Flat Graph Mean?
Students sometimes interpret a flat section as a "slow reaction."
A completely horizontal product-time line actually means:
no further change is occurring
Therefore:
rate = 0
The reaction may have stopped because:
- a limiting reactant has been used up
- the system has reached equilibrium
- conditions no longer allow measurable progress
For simple introductory experiments, it is commonly because one reactant has been used up.
Common Misconceptions
"A fast reaction makes more product."
Not necessarily. A faster reaction may simply produce the same final quantity in less time.
"A flat graph means the reaction is slow."
A flat product-time graph means the rate is zero at that stage.
"Reaction rate is the amount of product formed."
Not by itself. Rate involves change divided by time.
"All reactions start at the same rate."
Incorrect. Rates depend on reactants and conditions.
"A reaction that releases lots of energy must be fast."
Incorrect. Reaction energy and reaction rate are different concepts.
"Every collision causes a reaction."
Incorrect. Only suitable collisions produce reaction.
"A catalyst makes more product."
Not necessarily. A catalyst mainly changes how quickly the system reaches its final state.
Did You Know?
Reaction rates can vary by an enormous amount.
Some reactions occur so rapidly that they appear almost instantaneous.
Others can proceed so slowly that their effects become noticeable only after years.
The difference often comes down to the frequency of successful particle collisions and the size of the activation-energy barrier.
This is why chemists can sometimes dramatically alter reaction rate without changing the chemical equation itself.
Interpreting Reaction Rate Data: Quick Guide
When looking at a table or graph, ask:
What is being measured?
Mass? Gas volume? Concentration?
What is the time unit?
Seconds? Minutes?
Where is the graph steepest?
That is where the measured quantity is changing most rapidly.
Where does the graph flatten?
The rate is approaching or has reached zero.
Do two curves reach the same plateau?
If so, they may produce the same final amount but at different rates.
Which curve reaches the plateau first?
That reaction is faster.
Key Terms
Reaction rate – The change in amount or concentration of a reactant or product per unit time.
Chemical kinetics – The study of reaction rates and the factors that influence them.
Reactant – A substance consumed during a chemical reaction.
Product – A substance produced during a chemical reaction.
Average rate – Change in a measured quantity divided by a time interval.
Instantaneous rate – Rate at a particular moment during a reaction.
Initial rate – Rate at the beginning of a reaction.
Gradient – The slope of a graph; for many reaction graphs it indicates rate.
Collision theory – A model explaining reactions in terms of collisions between particles.
Successful collision – A collision that results in a chemical reaction.
Activation energy – The minimum energy barrier that must be overcome for a reaction to occur.
Catalyst – A substance that increases reaction rate without being consumed overall.
Key Takeaways
- Reaction rate describes how quickly a chemical reaction occurs.
- Reaction rate can be defined as the change in amount or concentration per unit time.
- Reactant quantities normally decrease during a reaction.
- Product quantities normally increase.
- Rate can be measured using:
- concentration
- mass change
- gas volume
- visible changes
- A steeper reaction graph indicates a faster rate.
- A horizontal product-time graph indicates a rate of zero.
- Many reactions are fastest at the start and slow as reactants are consumed.
- Average rate can be calculated using:
Rate = change in quantity ÷ change in time
- Common rate units include:
- g s⁻¹
- cm³ s⁻¹
- mol dm⁻³ s⁻¹
- Reaction rate depends on the number of successful collisions occurring per unit time.
- Important factors affecting reaction rate include:
- temperature
- concentration
- pressure
- surface area
- catalysts
- nature of the reactants
- Faster reactions do not necessarily produce more product.
- Reaction rate is not the same as reaction energy.
- Tables and graphs provide quantitative evidence that can be used to compare reaction rates.