Bond Energies and Energy Calculations
3. Bond Energy Data Tables
Learning outcomes
- I can interpret bond energy tables.
- I can identify bond energy values for common bonds.
- I can compare bond strengths using data tables.
- I can use bond energy tables in calculations.
- I can explain limitations of average bond energy data.
What Is a Bond Energy Table?
A bond energy table is a reference table containing the average amount of energy required to break different types of covalent bonds.
Bond energies are normally given in:
kilojoules per mole, kJ mol⁻¹
For example:
H–H = 436 kJ mol⁻¹
This means approximately 436 kJ of energy is required to break one mole of H–H bonds in gaseous molecules.
Because breaking bonds requires energy:
bond energy values are listed as positive numbers.
The depth of the energy well represents the energy needed to separate the bonded atoms. A deeper well corresponds to a stronger bond.
A Typical Bond Energy Table
The following values are useful approximate average bond energies.
| Bond | Average Bond Energy (kJ mol⁻¹) |
|---|---|
| H–H | 436 |
| H–F | 567 |
| H–Cl | 431 |
| H–Br | 366 |
| H–I | 299 |
| C–H | 415 |
| C–C | 345 |
| C=C | 611 |
| C≡C | 837 |
| C–N | 290 |
| C=N | 615 |
| C≡N | 891 |
| C–O | 350 |
| C=O | 741 |
| C≡O | 1080 |
| O–H | 463 |
| O=O | 498 |
| N–H | 390 |
| N≡N | 945 |
| F–F | 160 |
| Cl–Cl | 243 |
| Br–Br | 190 |
| I–I | 150 |
These are average values, not exact values for every molecule containing that bond.
How to Read a Bond Energy Table
Suppose you are asked:
What is the bond energy of an O–H bond?
Find:
O–H
Then read across:
463 kJ mol⁻¹
This means approximately 463 kJ of energy is required to break one mole of O–H bonds.
Likewise:
C=C = 611 kJ mol⁻¹
means approximately:
611 kJ is required to break one mole of C=C bonds.
The larger the value, the stronger the bond.
Bond Energy and Bond Strength
Bond energy provides a useful measure of bond strength.
A large bond energy means that a large amount of energy must be supplied to separate the atoms.
Therefore:
high bond energy → strong bond
low bond energy → weaker bond
Consider:
Cl–Cl = 243 kJ mol⁻¹
O=O = 498 kJ mol⁻¹
N≡N = 945 kJ mol⁻¹
The strongest of these is:
N≡N
The weakest is:
Cl–Cl
A stronger bond generally corresponds to a deeper potential-energy well.
Comparing Bonds in a Data Table
Suppose a table gives:
| Bond | Bond Energy |
|---|---|
| C–C | 345 kJ mol⁻¹ |
| C=C | 611 kJ mol⁻¹ |
| C≡C | 837 kJ mol⁻¹ |
The ranking from strongest to weakest is:
C≡C > C=C > C–C
This illustrates an important trend:
For the same pair of atoms:
triple bonds are generally stronger than double bonds
and:
double bonds are generally stronger than single bonds.
Bond Strength and Bond Length
Bond energy tables are sometimes combined with bond length data.
For carbon-carbon bonds:
| Bond | Bond Length | Bond Energy |
|---|---|---|
| C–C | 154 pm | 345 kJ mol⁻¹ |
| C=C | 134 pm | 611 kJ mol⁻¹ |
| C≡C | 120 pm | 837 kJ mol⁻¹ |
Notice the pattern:
As bond strength increases:
bond length decreases
So:
C–C → longest and weakest
C=C → shorter and stronger
C≡C → shortest and strongest
This general relationship is especially useful when comparing bonds between the same two elements.
Worked Example 1: Identifying the Strongest Bond
Consider:
H–H = 436 kJ mol⁻¹
O=O = 498 kJ mol⁻¹
N≡N = 945 kJ mol⁻¹
Which bond is strongest?
Look for the largest bond-energy value.
N≡N = 945 kJ mol⁻¹
Therefore:
N≡N is the strongest bond.
Which requires the least energy to break?
H–H, because 436 kJ mol⁻¹ is the smallest value in this particular set.
Worked Example 2: Comparing Bond Strength
Compare:
C–H = 415 kJ mol⁻¹
C–C = 345 kJ mol⁻¹
Difference:
415 − 345 = 70 kJ mol⁻¹
Therefore, approximately:
70 kJ mol⁻¹ more energy
is required to break a C–H bond than a C–C bond.
The C–H bond is therefore stronger according to these average values.
Do Not Confuse Bond Energy with Total Molecular Energy
Bond energy refers to one mole of a particular type of bond.
A molecule can contain many bonds.
For example, methane:
CH₄
contains:
4 C–H bonds
If all four C–H bonds are considered using an average value of 415 kJ mol⁻¹:
4 × 415 = 1660 kJ mol⁻¹
This does not mean a single C–H bond has an energy of 1660 kJ mol⁻¹.
Each bond is approximately:
415 kJ mol⁻¹
There are simply four of them.
Using Bond Energy Tables in Calculations
Bond-energy tables become especially useful when estimating the overall energy change of a reaction.
The key equation is:
ΔH ≈ ΣE(bonds broken) − ΣE(bonds formed)
where:
Σ means "sum of"
and:
E represents bond energy.
Remember:
Bonds broken → energy absorbed
Bonds formed → energy released
Bond-energy calculations provide an approximate reaction enthalpy because the values in most tables are averages.
Step-by-Step Bond Energy Calculations
A useful method is:
Step 1: Draw or identify all bonds in the reactants
Determine which bonds must be broken.
Step 2: Use the table
Find the bond energy of each bond.
Step 3: Add the bond-breaking energies
This is the energy input.
Step 4: Identify all bonds formed in the products
Find their bond energies.
Step 5: Add the bond-forming energies
This represents the magnitude of energy released.
Step 6: Calculate
ΔH ≈ bonds broken − bonds formed
Worked Example 3: H₂ + Cl₂ → 2HCl
Consider:
H₂ + Cl₂ → 2HCl
Bond energies:
H–H = 436 kJ mol⁻¹
Cl–Cl = 243 kJ mol⁻¹
H–Cl = 431 kJ mol⁻¹
Bonds Broken
One H–H:
436 kJ mol⁻¹
One Cl–Cl:
243 kJ mol⁻¹
Total energy required:
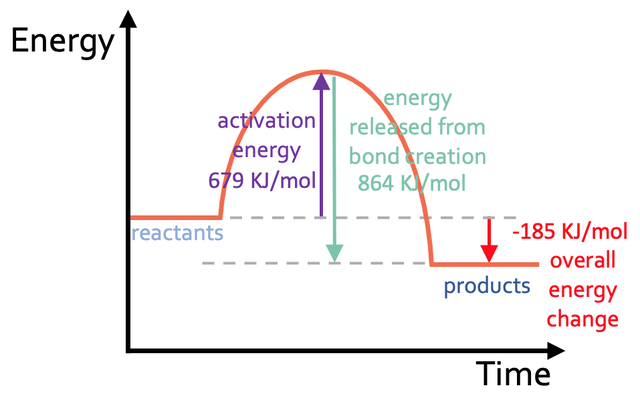
436 + 243 = 679 kJ mol⁻¹
Bonds Formed
Two H–Cl bonds:
2 × 431 = 862 kJ mol⁻¹
Overall Energy Change
ΔH ≈ 679 − 862
ΔH ≈ −183 kJ mol⁻¹
The negative value indicates an:
exothermic reaction
Why Do We Count Every Bond?
A common error in bond-energy calculations is to identify the types of bonds but forget how many of each bond are present.
For example:
2H₂O
contains four O–H bonds in total.
Each H₂O molecule contains:
2 O–H bonds
Therefore:
2 × 2 = 4 O–H bonds
If O–H = 463 kJ mol⁻¹, the energy associated with four such bonds is:
4 × 463 = 1852 kJ mol⁻¹
Always count the bonds before performing the calculation.
Worked Example 4: Forming Water
Consider:
2H₂ + O₂ → 2H₂O
Average bond energies:
H–H = 436 kJ mol⁻¹
O=O = 498 kJ mol⁻¹
O–H = 463 kJ mol⁻¹
Bonds Broken
2 H–H bonds:
2 × 436 = 872 kJ mol⁻¹
1 O=O bond:
498 kJ mol⁻¹
Total:
872 + 498 = 1370 kJ mol⁻¹
Bonds Formed
Two H₂O molecules contain four O–H bonds:
4 × 463 = 1852 kJ mol⁻¹
Calculate ΔH
ΔH ≈ 1370 − 1852
ΔH ≈ −482 kJ mol⁻¹
The reaction is:
exothermic
because forming the O–H bonds releases more energy than is required to break the H–H and O=O bonds.
Using Structural Formulae
Sometimes a chemical equation alone does not make all the bonds obvious.
For example:
C₂H₄ + H₂ → C₂H₆
It is useful to draw the structures:
H₂C=CH₂ + H–H → H₃C–CH₃
Now we can identify what actually changes.
The reaction:
- breaks an H–H bond
- changes C=C to C–C
- forms two new C–H bonds
Drawing the molecules makes it much easier to use the bond-energy table correctly.
A Useful Shortcut: Count Only Bonds That Change
In many reactions, some bonds appear unchanged in both reactants and products.
Because identical unchanged bonds would appear on both sides of the calculation, they effectively cancel.
For simple reactions, we can sometimes calculate ΔH using only bonds that are broken, formed or changed.
However, this shortcut should be used carefully.
When first learning bond-energy calculations, it is often safer to:
draw all structures → count all relevant bonds → check your work
Worked Example 5: Hydrogenation of Ethene
Consider:
C₂H₄ + H₂ → C₂H₆
Relevant average bond energies:
C=C = 611 kJ mol⁻¹
H–H = 436 kJ mol⁻¹
C–C = 345 kJ mol⁻¹
C–H = 415 kJ mol⁻¹
Bonds effectively broken or replaced
1 C=C:
611
1 H–H:
436
Total:
1047 kJ mol⁻¹
Bonds formed
1 C–C:
345
2 additional C–H:
2 × 415 = 830
Total:
1175 kJ mol⁻¹
Calculate
ΔH ≈ 1047 − 1175
ΔH ≈ −128 kJ mol⁻¹
The reaction is approximately:
exothermic
Bond Energy Tables and Combustion
Bond-energy data are particularly useful for understanding combustion reactions.
Consider methane combustion:
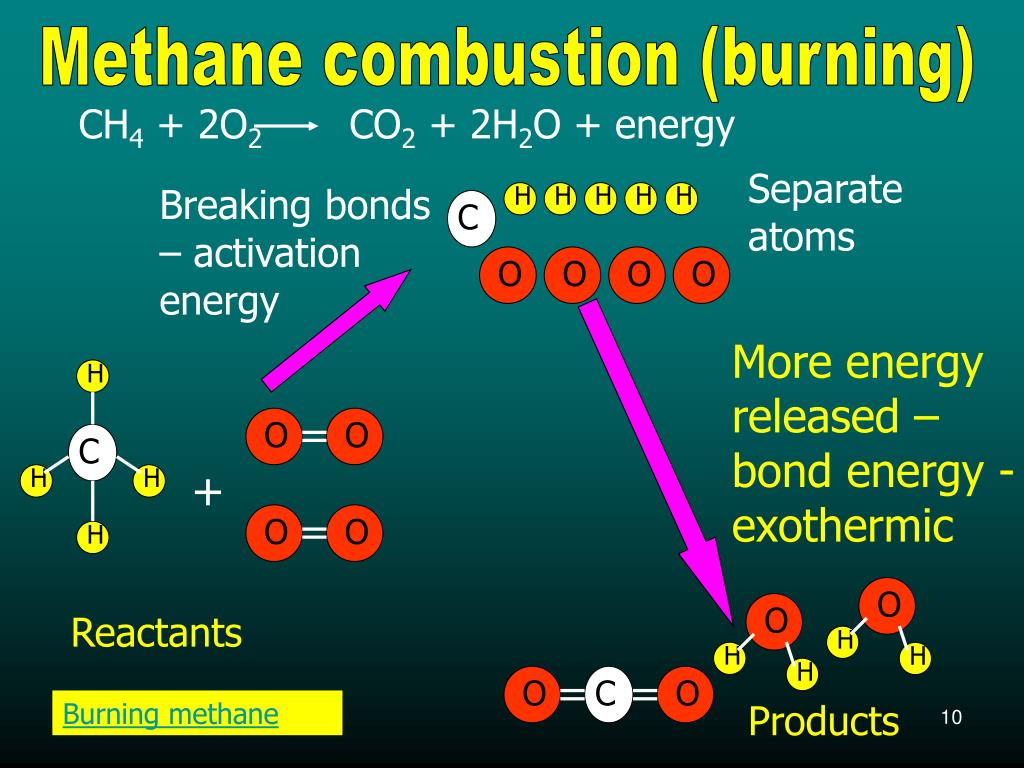
CH₄ + 2O₂ → CO₂ + 2H₂O
We must consider:
Reactant bonds:
- 4 C–H
- 2 O=O
Product bonds:
- 2 C=O in CO₂
- 4 O–H
Bond-energy calculations allow us to estimate why the reaction is strongly exothermic: forming the strong product bonds releases more energy than breaking the reactant bonds requires.
Average Bond Energies Are Not Exact
The word average is extremely important.
A C–H bond does not have exactly the same bond energy in every molecule.
For example, the chemical surroundings of a C–H bond in methane differ from those of a C–H bond in another organic compound.
The surrounding atoms affect electron distribution and therefore bond strength.
The value listed in a table is therefore usually an average measured across many molecular environments. OpenStax notes, for example, that the listed C–H value is an average and individual C–H bond dissociation energies can differ significantly.
Why Can Two Tables Give Slightly Different Values?
You may notice that different textbooks give slightly different numbers.
One table might give:
C–H = 413 kJ mol⁻¹
while another gives:
C–H = 415 kJ mol⁻¹
Likewise, one source may list:
C–C = 347 kJ mol⁻¹
while another uses:
345 kJ mol⁻¹
This is not necessarily an error.
Differences can arise because:
- bond energies are averages
- different sets of compounds were used
- values may be rounded differently
- different reference data may be used
For calculations, use the values supplied in the question or the table being used in your course.
Bond Dissociation Energy vs Average Bond Energy
These two terms are related but are not always identical.
A bond dissociation energy refers to the energy required to break a particular bond in a particular molecule.
An average bond energy is an average value for a bond type across several molecules.
For example, different C–H bonds can have slightly different dissociation energies.
A bond-energy table simplifies this by giving one useful average value.
This makes calculations easier but reduces precision.
Why Bond Energy Calculations Are Estimates
Suppose a bond-energy calculation gives:
ΔH ≈ −125 kJ mol⁻¹
An experimentally measured value might be somewhat different.
This does not necessarily mean the calculation is wrong.
The difference may occur because average bond energies were used instead of the exact energies of the bonds in those specific molecules. Bond-energy calculations are therefore typically estimates rather than exact reaction enthalpies.
Gas-Phase Values
Average bond energies are normally defined for gaseous molecules.
That matters because real chemical reactions may involve:
- solids
- liquids
- dissolved substances
- gases
Changes of state and intermolecular interactions can also involve energy.
A simple bond-energy calculation may therefore not capture every energy contribution present in a real experimental reaction.
This is another reason calculated values can differ from measured enthalpy changes.
Comparing Bond Strengths from a Table
Suppose you are given:
| Bond | Energy |
|---|---|
| C–O | 350 |
| C=O | 741 |
| C≡O | 1080 |
Which is strongest?
C≡O
Which is weakest?
C–O
How much more energy is required to break C=O than C–O?
741 − 350 = 391 kJ mol⁻¹
How much more energy is required to break C≡O than C–O?
1080 − 350 = 730 kJ mol⁻¹
The table therefore provides both qualitative and quantitative information about bond strength.
A Pattern Down a Group
Bond-energy tables can also reveal trends.
Consider:
H–F = 567 kJ mol⁻¹
H–Cl = 431 kJ mol⁻¹
H–Br = 366 kJ mol⁻¹
H–I = 299 kJ mol⁻¹
The bond strength decreases:
H–F > H–Cl > H–Br > H–I
As the halogen atom becomes larger, the bond generally becomes longer and weaker.
Bond-energy data can therefore reveal patterns that connect chemical structure with chemical properties.
Another Interesting Pattern
Compare:
F–F = 160 kJ mol⁻¹
Cl–Cl = 243 kJ mol⁻¹
Br–Br = 190 kJ mol⁻¹
I–I = 150 kJ mol⁻¹
You might expect F–F to be the strongest simply because fluorine atoms are small.
But the F–F bond is unusually weak because the small fluorine atoms bring several lone pairs very close together, increasing electron-electron repulsion.
This reminds us that chemical trends often have interesting exceptions.
Bond Energy and Reaction Profiles
Bond-energy calculations and reaction-profile diagrams describe related ideas, but they are not identical.
Bond energies help us estimate:
overall reaction energy, ΔH
Reaction profiles show:
- reactant energy
- activation energy
- transition state
- product energy
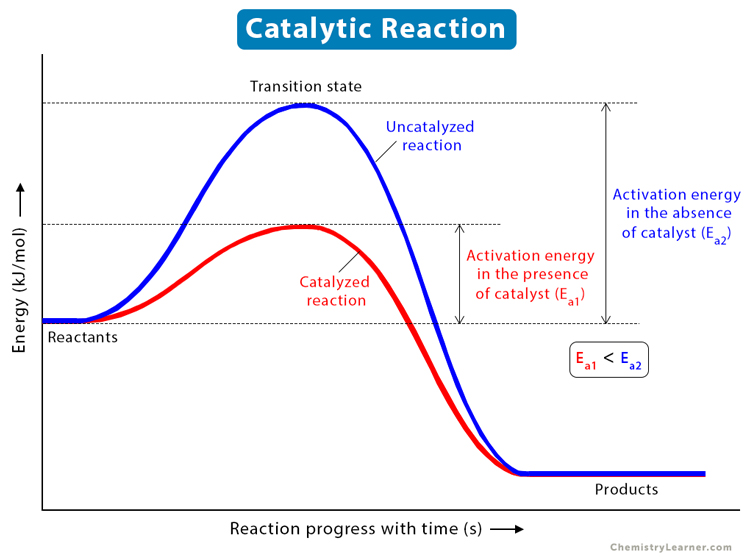
A bond-energy table cannot by itself tell you the activation energy of the reaction.
This is an important distinction.
What Bond Energy Tables Can Tell Us
A bond-energy table can help us:
- identify approximate bond strengths
- compare different bonds
- estimate energy required for bond breaking
- estimate energy released by bond formation
- calculate approximate ΔH values
- predict whether a reaction is likely to be exothermic or endothermic
What Bond Energy Tables Cannot Tell Us
A bond-energy table alone does not directly tell us:
- how fast a reaction occurs
- the activation energy
- the reaction mechanism
- whether a catalyst is present
- the exact enthalpy of a real reaction
- the exact strength of a bond in every molecular environment
Bond energies are powerful tools, but they provide only part of the energetic picture.
Worked Example 6: Reading a Table Carefully
Suppose a table contains:
C–N = 290 kJ mol⁻¹
C=N = 615 kJ mol⁻¹
C≡N = 891 kJ mol⁻¹
Question 1: Which bond is easiest to break?
C–N
Question 2: Which is strongest?
C≡N
Question 3: How much more energy is required to break C≡N than C–N?
891 − 290
= 601 kJ mol⁻¹
Question 4: Which bond is probably shortest?
C≡N
Worked Example 7: Using Several Table Values
Suppose a reaction requires breaking:
- 2 C–H bonds
- 1 O=O bond
Using:
C–H = 415 kJ mol⁻¹
O=O = 498 kJ mol⁻¹
Energy required:
2(415) + 498
= 830 + 498
= 1328 kJ mol⁻¹
If the reaction then forms bonds whose total bond energy is:
1540 kJ mol⁻¹
then:
ΔH ≈ 1328 − 1540
ΔH ≈ −212 kJ mol⁻¹
Therefore the reaction is approximately:
exothermic
A Reliable Calculation Strategy
When using a bond-energy table, ask four questions:
1. What bonds are broken?
Count them carefully.
2. What bonds are formed?
Count those carefully too.
3. What are their bond energies?
Read the correct values from the table.
4. Which total is larger?
Then calculate:
ΔH ≈ bonds broken − bonds formed
This simple routine prevents most errors.
Did You Know?
The N≡N bond in nitrogen is one of the strongest common bonds, with an average bond energy of about:
945 kJ mol⁻¹
That large value helps explain why nitrogen gas is relatively unreactive.
Yet nitrogen is essential for amino acids, proteins and DNA.
Nature solves this problem through processes such as nitrogen fixation, while industry uses catalysts and carefully controlled conditions in processes such as the Haber process.
Common Mistakes
"A larger bond-energy value means the bond contains more energy to release when broken."
Incorrect. A larger bond-energy value means more energy must be supplied to break the bond.
"Bond energy tables give exact values."
Usually incorrect. Most tables contain average bond energies.
"I only need to identify the bond type."
Not enough. You must also count how many of each bond are involved.
"Double bonds have twice the energy of single bonds."
Incorrect. For example, C=C is stronger than C–C, but it is not exactly twice as strong.
"Bond-energy calculations give activation energy."
Incorrect. They estimate the overall energy change, not the activation barrier.
"Different tables must agree exactly."
Not necessarily. Slight differences are normal because average values and rounding can differ.
Key Terms
Bond energy – Energy required to break one mole of a particular covalent bond in gaseous molecules.
Average bond energy – An average energy value for a particular bond type across different molecules.
Bond dissociation energy – Energy required to break a specified bond in a particular molecule.
Bond strength – A measure of how strongly two bonded atoms are held together.
Bond length – The equilibrium distance between the nuclei of bonded atoms.
Bond order – The number of bonding interactions between two atoms.
Enthalpy change, ΔH – The overall energy change of a reaction at constant pressure.
Exothermic – Describes a process that transfers energy to the surroundings.
Endothermic – Describes a process that absorbs energy from the surroundings.
Key Takeaways
- Bond-energy tables list energies in kJ mol⁻¹.
- A bond-energy value tells us approximately how much energy is required to break one mole of that bond.
- Higher bond energy generally means a stronger bond.
- Bond-energy tables can be used to compare bond strengths.
- Triple bonds are generally stronger than corresponding double bonds, which are generally stronger than corresponding single bonds.
- Stronger bonds between the same elements are generally shorter.
- Bond energies can be used to estimate reaction enthalpy:
ΔH ≈ ΣE(bonds broken) − ΣE(bonds formed)
- Bonds must be counted carefully before calculations are performed.
- Most tabulated bond energies are average values.
- The exact strength of a bond depends on its molecular environment.
- Different reference tables may give slightly different values.
- Bond-energy calculations therefore produce estimates rather than exact reaction enthalpies.
- Bond-energy data do not directly tell us reaction rate or activation energy.
- When solving problems, use the bond-energy values provided in the question whenever possible.