Two-Dimensional Motion
4. Analyzing Projectile Paths
Learning outcomes
- I can analyze projectile trajectories using vector components.
- I can determine maximum height, time of flight, and horizontal range.
- I can interpret projectile motion diagrams and graphs.
- I can identify factors that affect projectile motion.
- I can solve multi-step projectile motion problems.
Understanding a projectile’s path
A projectile’s motion results from the combination of two perpendicular motions:
- Horizontal motion, which has constant velocity when air resistance is ignored.
- Vertical motion, which has constant downward acceleration due to gravity.
The projectile’s actual velocity is the vector sum of its horizontal and vertical velocity components.
These components can be analyzed independently because gravity acts vertically. The time variable connects the two calculations.
For the ideal model:
aₓ = 0
aᵧ = −g
when upward is chosen as positive.
Near Earth’s surface:
g ≈ 9.8 m/s²
Equations for horizontal motion
With no air resistance, horizontal velocity remains constant:
vₓ = uₓ
Horizontal displacement is:
x = uₓt
The horizontal motion determines how far the projectile travels during its time in the air.
Equations for vertical motion
The vertical motion has constant downward acceleration.
When upward is positive:
vᵧ = uᵧ − gt
y = uᵧt − ½gt²
vᵧ² = uᵧ² − 2gy
These equations use only vertical quantities.
The vertical motion usually determines:
- Time to maximum height.
- Maximum height.
- Total flight time.
- Impact velocity.
Resolving the launch velocity
For a projectile launched at speed u and angle θ above the horizontal:
uₓ = u cos θ
uᵧ = u sin θ
The horizontal component controls the rate of horizontal travel. The vertical component controls the initial upward motion.


A greater launch speed increases both components when the launch angle remains fixed. Changing the angle changes how the initial velocity is divided between horizontal and vertical motion.
Important points on the trajectory
A projectile diagram often identifies three important stages.
Launch
At launch:
- Horizontal velocity is uₓ.
- Vertical velocity is uᵧ.
- Resultant velocity is u.
- Acceleration is g downwards.
Maximum height
At maximum height:
- Vertical velocity is zero.
- Horizontal velocity remains uₓ.
- Acceleration remains g downwards.
- The projectile is momentarily moving horizontally.
Descent and impact
During descent:
- Horizontal velocity remains constant in the ideal model.
- Vertical velocity is negative when upwards is positive.
- Downward speed increases.
- Resultant velocity points forwards and downwards.
The velocity vector is always tangent to the trajectory.
Analyzing trajectory diagrams
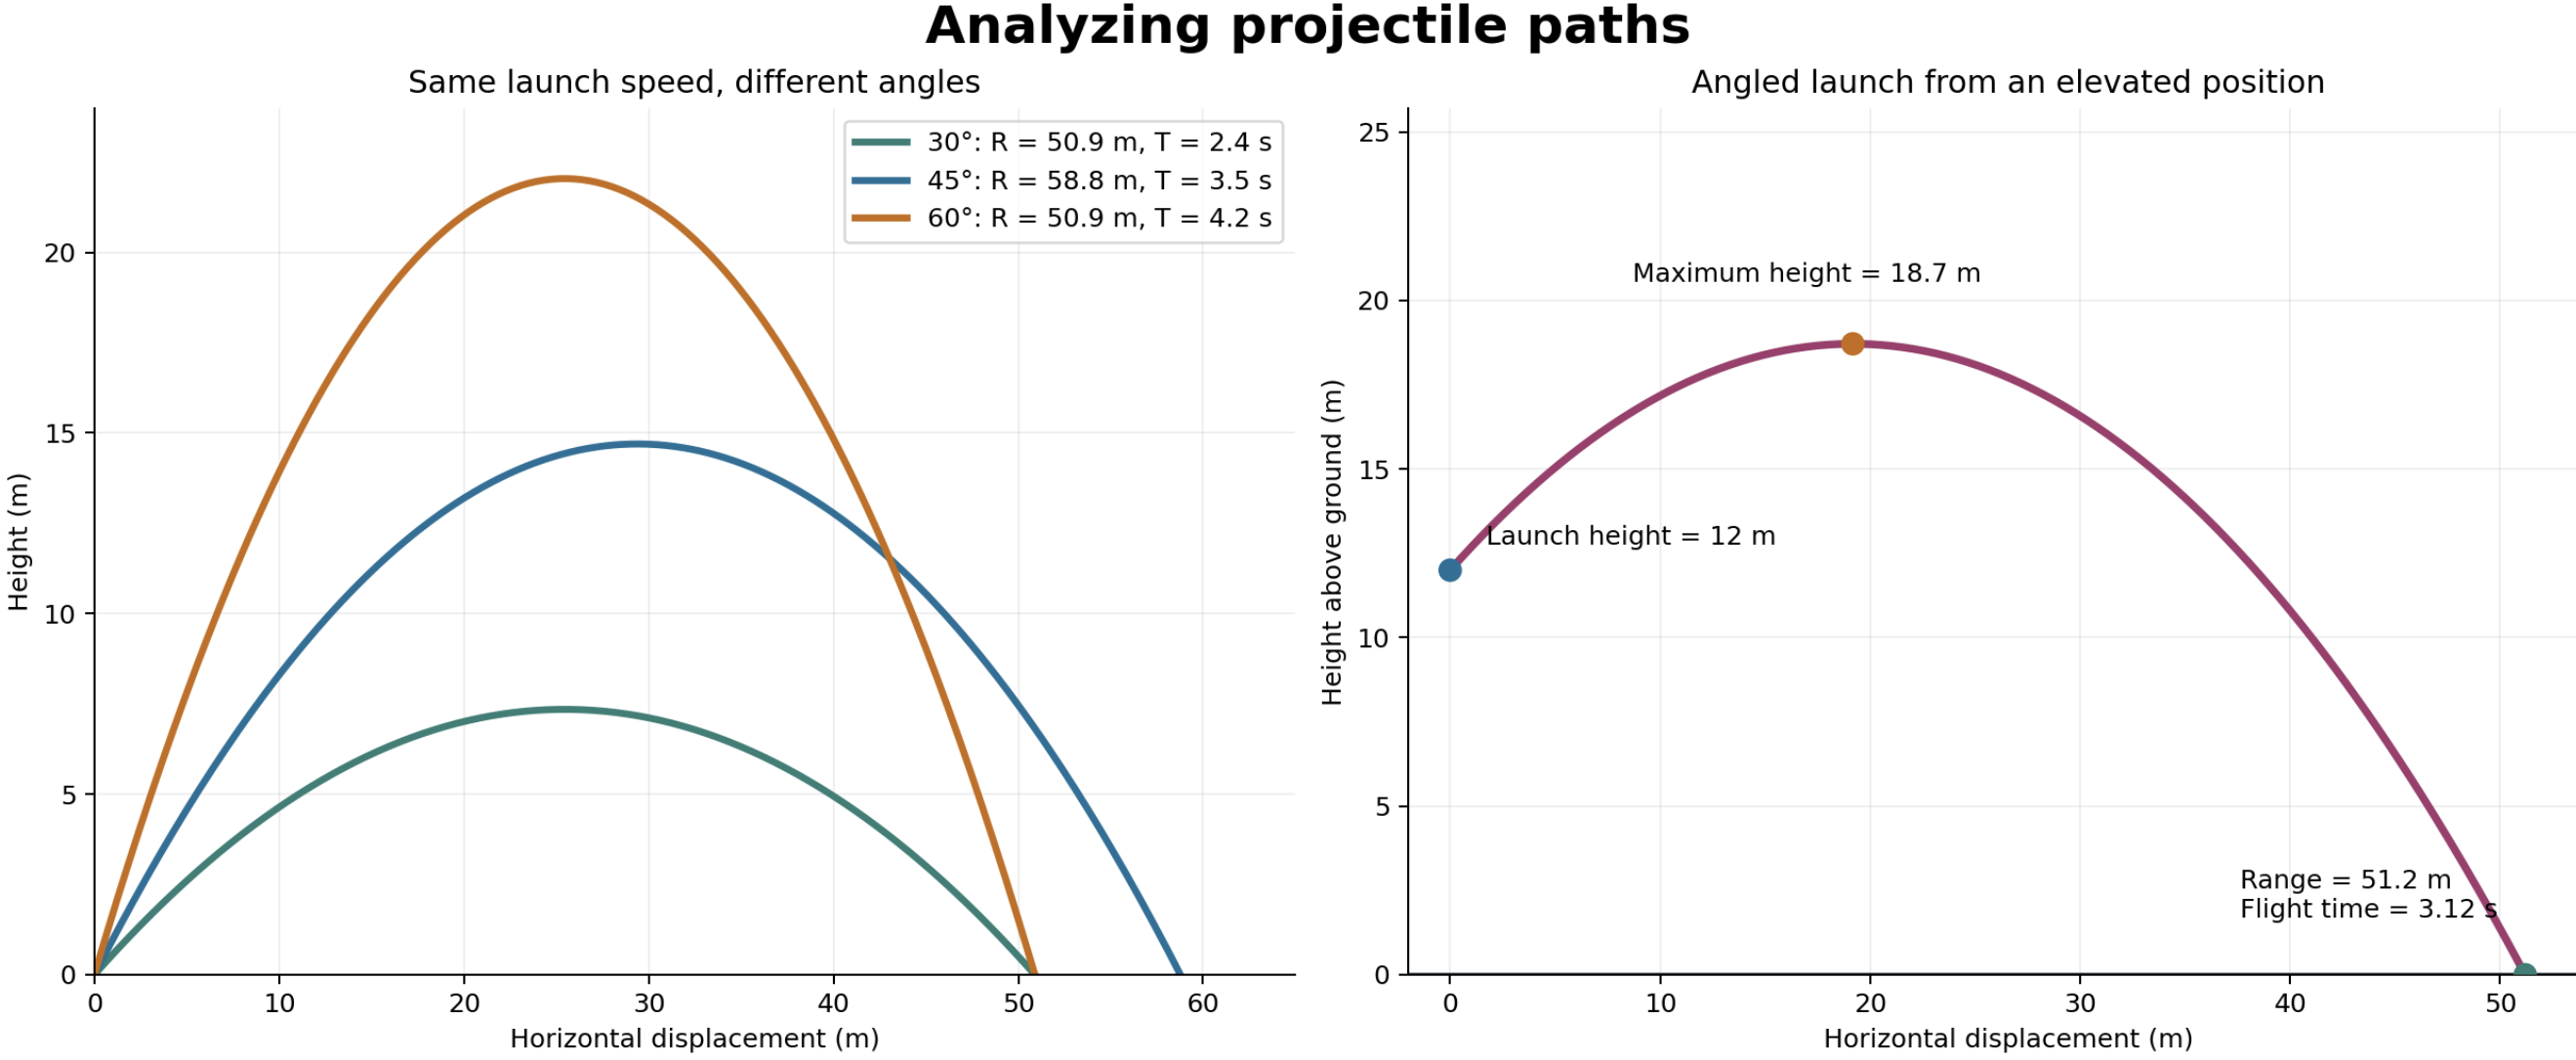
The left graph compares launches at 30°, 45° and 60° using the same initial speed of 24 m/s.
The right graph represents a projectile launched at 20 m/s and 35° from 12 m above the ground.
The graphs reveal several patterns:
- The 60° launch reaches a greater height than the 30° launch.
- The 60° launch remains airborne longer.
- The 30° and 60° launches have equal ideal ranges.
- The 45° launch gives the greatest range for equal launch and landing heights.
- An elevated launch produces a longer descent than ascent relative to the release point.
- When launch and landing heights differ, the trajectory is not symmetrical about the launch height.
Finding time to maximum height
At the highest point:
vᵧ = 0
Use:
vᵧ = uᵧ − gt
Therefore:
0 = uᵧ − gt_up
Rearrange:
t_up = uᵧ/g
This result depends only on the initial vertical component.
Worked example
A projectile is launched at 24 m/s at 60° above the horizontal.
Find its initial vertical velocity:
uᵧ = 24 sin 60°
uᵧ ≈ 20.8 m/s
Time to maximum height:
t_up = 20.8/9.8
t_up ≈ 2.12 s
Finding maximum height
Maximum height above the launch point can be found using:
vᵧ² = uᵧ² − 2gH
At maximum height, vᵧ = 0:
0 = uᵧ² − 2gH
Therefore:
H = uᵧ²/(2g)
Using uᵧ = 20.8 m/s:
H = 20.8²/[2(9.8)]
H ≈ 22.0 m
This is the height above the launch point.
If the projectile is launched from an initial height h₀, its maximum height above the ground is:
h_max = h₀ + H
Finding total flight time
Equal launch and landing heights
When a projectile lands at the same height from which it was launched, the ideal vertical motion is symmetrical.
Time falling equals time rising:
T = 2t_up
Therefore:
T = 2uᵧ/g
Different launch and landing heights
If the landing height differs from the launch height, this shortcut cannot be used.
Instead, solve the vertical position equation:
y = y₀ + uᵧt − ½gt²
This normally produces a quadratic equation in t.
Select the solution that represents the time after launch.
Finding horizontal range
The horizontal range is:
R = uₓT
For equal launch and landing heights, substituting the component equations gives:
R = u²sin(2θ)/g
This range formula assumes:
- No air resistance.
- Constant gravitational acceleration.
- Equal launch and landing heights.
- A launch angle measured from the horizontal.
It should not be used for an elevated or lowered landing point.
Worked example: complete equal-height analysis
A ball is launched from ground level at 24 m/s at 30° above the horizontal. Calculate its maximum height, flight time and range. Use g = 9.8 m/s².
Resolve the initial velocity
Horizontal component:
uₓ = 24 cos 30°
uₓ ≈ 20.8 m/s
Vertical component:
uᵧ = 24 sin 30°
uᵧ = 12.0 m/s
Calculate maximum height
H = uᵧ²/(2g)
H = 12.0²/[2(9.8)]
H ≈ 7.35 m
Calculate flight time
T = 2uᵧ/g
T = 2(12.0)/9.8
T ≈ 2.45 s
Calculate range
R = uₓT
R = 20.8(2.45)
R ≈ 50.9 m
The projectile reaches approximately 7.35 m, remains airborne for 2.45 s and travels 50.9 m horizontally.
Comparing complementary angles
Two angles are complementary if they add to 90°.
For example:
30° + 60° = 90°
For the same launch speed and equal launch and landing heights:
R = u²sin(2θ)/g
For θ = 30°:
sin(60°) ≈ 0.866
For θ = 60°:
sin(120°) ≈ 0.866
Therefore, both launch angles produce the same ideal range.
However:
- The 30° trajectory is lower.
- The 30° projectile has greater horizontal velocity.
- The 60° trajectory is higher.
- The 60° projectile remains airborne longer.
Equal range does not mean identical motion.
Why 45° gives the maximum ideal range
For a fixed launch speed:
R = u²sin(2θ)/g
The largest possible value of sin(2θ) is 1.
Therefore:
2θ = 90°
θ = 45°
This conclusion applies to an ideal projectile launched and landing at the same height.
In real sports, the best angle may differ because of:
- Air resistance.
- Spin.
- Release height.
- Object shape.
- The athlete’s ability to produce different speeds at different angles.
Multi-step problem: angled launch from a platform
A ball is launched from a 12 m high platform at 20 m/s and 35° above the horizontal. Calculate:
- Its maximum height above the ground.
- Its time of flight.
- Its horizontal range.
- Its impact velocity.
Use g = 9.8 m/s² and ignore air resistance.
Resolve the launch velocity
uₓ = 20 cos 35°
uₓ ≈ 16.4 m/s
uᵧ = 20 sin 35°
uᵧ ≈ 11.5 m/s
Find the maximum height
First calculate the additional height above the platform:
H = uᵧ²/(2g)
H = 11.5²/[2(9.8)]
H ≈ 6.71 m
Add the platform height:
h_max = 12 + 6.71
h_max ≈ 18.7 m above the ground
Find the time of flight
Use vertical position measured from the launch point. The ground is 12 m below the launch point:
y = −12 m
Use:
y = uᵧt − ½gt²
Substitute:
−12 = 11.5t − 4.9t²
Rearrange:
4.9t² − 11.5t − 12 = 0
Use the quadratic formula:
t = [11.5 ± √(11.5² + 4(4.9)(12))]/9.8
This gives approximately:
t = 3.12 s or t = −0.79 s
The negative time lies before launch, so:
Flight time = 3.12 s
Find the horizontal range
R = uₓT
R = 16.4(3.12)
R ≈ 51.2 m
Find the impact velocity components
Horizontal velocity remains constant:
vₓ = 16.4 m/s
Vertical velocity:
vᵧ = uᵧ − gt
vᵧ = 11.5 − 9.8(3.12)
vᵧ ≈ −19.1 m/s
The negative sign indicates downward motion.
Find the resultant impact speed
v = √(vₓ² + vᵧ²)
v = √(16.4² + 19.1²)
v ≈ 25.2 m/s
Find the impact direction
θ = tan⁻¹(|vᵧ|/vₓ)
θ = tan⁻¹(19.1/16.4)
θ ≈ 49.4°
The impact velocity is approximately:
25.2 m/s at 49.4° below the horizontal
Reading position–time graphs
Projectile motion produces separate horizontal and vertical position graphs.
Horizontal position–time graph
Horizontal position changes linearly:
x = x₀ + uₓt
The graph is a straight line with gradient uₓ.
Vertical position–time graph
Vertical position follows:
y = y₀ + uᵧt − ½gt²
The graph is a downward-opening parabola.
Its gradient represents vertical velocity:
- Positive gradient during ascent.
- Zero gradient at maximum height.
- Negative gradient during descent.
A height–time graph shows height as time changes. It does not show the projectile’s path through space.
Reading velocity–time graphs
Horizontal velocity–time graph
The graph is horizontal because vₓ remains constant.
Its area gives horizontal displacement.
Vertical velocity–time graph
The graph is a straight line with gradient −g:
vᵧ = uᵧ − gt
Its area gives vertical displacement.
- Positive area represents upward displacement.
- Negative area represents downward displacement.
- Equal positive and negative areas give zero total vertical displacement.
If the projectile returns to its launch height, the net area under the vertical velocity graph is zero.
Reading acceleration–time graphs
For the ideal model:
aₓ = 0
The horizontal acceleration graph lies on the time axis.
aᵧ = −g
The vertical acceleration graph is a horizontal line at −9.8 m/s² when upward is positive.
Acceleration does not become zero at maximum height.
Finding position at a particular time
Worked example
A ball is launched at 18 m/s at 40° above the horizontal. Find its position relative to the launch point after 1.5 seconds. Use g = 9.8 m/s².
Resolve the initial velocity:
uₓ = 18 cos 40°
uₓ ≈ 13.8 m/s
uᵧ = 18 sin 40°
uᵧ ≈ 11.6 m/s
Horizontal position:
x = uₓt
x = 13.8(1.5)
x ≈ 20.7 m
Vertical position:
y = uᵧt − ½gt²
y = 11.6(1.5) − 4.9(1.5²)
y ≈ 17.4 − 11.0
y ≈ 6.4 m
After 1.5 seconds, the ball is approximately 20.7 m horizontally from the launch point and 6.4 m above it.
Determining whether a projectile clears an obstacle
A projectile problem may ask whether an object passes over a wall, defender or barrier.
A useful method is:
- Use horizontal motion to find the time taken to reach the obstacle.
- Substitute that time into the vertical equation.
- Compare the projectile’s height with the obstacle’s height.
Worked example
A ball is launched from ground level at 22 m/s at 40°. A 5.0 m wall is located 18 m away. Determine whether the ball clears it. Use g = 9.8 m/s².
Horizontal component:
uₓ = 22 cos 40°
uₓ ≈ 16.9 m/s
Time to reach the wall:
t = x/uₓ
t = 18/16.9
t ≈ 1.07 s
Vertical component:
uᵧ = 22 sin 40°
uᵧ ≈ 14.1 m/s
Height at the wall:
y = uᵧt − ½gt²
y = 14.1(1.07) − 4.9(1.07²)
y ≈ 15.1 − 5.61
y ≈ 9.5 m
Clearance:
9.5 − 5.0 = 4.5 m
The ball clears the wall by approximately 4.5 m under the ideal model.
Factors affecting projectile motion
Initial speed
Increasing launch speed generally increases:
- Maximum height.
- Flight time.
- Horizontal range.
- Impact speed.
For an equal-height launch, range is proportional to speed squared:
R ∝ u²
Doubling the launch speed can produce four times the ideal range when angle and gravity remain unchanged.
Launch angle
The launch angle determines how velocity is divided between horizontal and vertical components.
- A lower angle gives a larger horizontal component.
- A higher angle gives a larger vertical component.
- A 45° angle gives maximum ideal range for equal launch and landing heights.
Launch height
A greater launch height normally increases:
- Time of flight.
- Horizontal range.
It does not change the additional rise produced by the same initial vertical velocity.
Gravitational acceleration
A greater gravitational acceleration causes:
- Shorter flight time.
- Lower maximum height.
- Shorter range.
The same launch would produce a different path on the Moon.


The Moon’s gravitational acceleration is about 1.62 m/s², so a projectile would remain airborne longer and travel farther than on Earth for the same launch conditions.
Air resistance
Air resistance generally:
- Reduces horizontal velocity.
- Reduces range.
- Makes the trajectory less symmetrical.
- Reduces impact speed.
- Changes the path from a perfect parabola.
Drag has a larger effect on objects that are light, large or moving quickly.
Shape and orientation
Streamlined objects usually experience less drag. Irregular or broad objects may slow more quickly.
Spin
Spin can create an additional force called the Magnus force. This can cause a ball to curve, dip or remain airborne differently from the ideal model.


Spin is important in sports such as football, tennis, baseball and golf. A basic no-drag projectile model does not include this effect.
Real-world sports analysis
Projectile analysis can help investigate:
- The best basketball release angle.
- Whether a football will clear a defensive wall.
- The range of a javelin.
- The height of a volleyball serve.
- The landing position of a long jumper’s centre of mass.


Real athletic performance requires models that may include release height, air resistance, spin and movement of the athlete.
A reliable multi-step method
- Draw and label the trajectory.
- Choose positive x- and y-directions.
- Record the launch height.
- Resolve the initial velocity into uₓ and uᵧ.
- Create separate horizontal and vertical variable lists.
- Use vertical motion to determine time.
- Use the shared time to calculate horizontal range.
- Find velocity components at the required moment.
- Recombine components when resultant speed or direction is needed.
- Check signs, units, assumptions and physical meaning.
Common misconceptions
- “The launch speed is the horizontal velocity.” This is true only for a horizontal launch.
- “Maximum height occurs halfway across every trajectory.” This requires equal launch and landing heights.
- “Flight time is always twice the time to maximum height.” This applies only to equal-height motion.
- “The range formula works for an elevated launch.” The standard formula assumes equal launch and landing heights.
- “A larger launch angle always produces a greater range.” Range reaches a maximum and then decreases.
- “Gravity changes horizontal velocity.” Gravity acts vertically in the ideal model.
- “Velocity is zero at maximum height.” Only the vertical component is zero.
- “A trajectory graph and height–time graph are the same.” They have different horizontal axes.
- “The ideal model exactly predicts sports motion.” Drag, spin and release conditions can cause significant differences.
Did you know?
A computer can predict a projectile’s location by repeatedly updating its velocity and position over very short time intervals.
This numerical approach allows more realistic models to include changing air resistance, wind and spin, even when a simple algebraic equation is unavailable.
Key terms
- Trajectory: The path followed by a projectile.
- Vector component: Part of a vector acting along a selected axis.
- Maximum height: Greatest vertical position reached by a projectile.
- Time of flight: Total time between launch and landing.
- Horizontal range: Horizontal displacement from launch to landing.
- Launch angle: Direction of the initial velocity relative to the horizontal.
- Launch height: Initial vertical position relative to the landing level.
- Impact velocity: Resultant velocity immediately before landing or collision.
- Complementary angles: Two angles whose sum is 90°.
- Air resistance: A force opposing motion through air.
- Magnus force: A force on a spinning object moving through a fluid.
- Ideal model: A simplified representation that ignores complicating effects.
Key takeaways
- Resolve the launch velocity into horizontal and vertical components.
- Horizontal velocity remains constant in the ideal model.
- Vertical acceleration remains equal to g downwards.
- Vertical motion usually determines flight time.
- Horizontal range equals horizontal velocity multiplied by flight time.
- At maximum height, vertical velocity is zero.
- Equal-height trajectories are symmetrical when air resistance is ignored.
- The standard range formula does not apply when launch and landing heights differ.
- Initial speed, launch angle, height, gravity, drag and spin affect the path.
- Multi-step problems require consistent signs and separate horizontal and vertical calculations.