Foundations of Probability
5. Tree Diagrams and Tables
Learning outcomes
- I can construct probability tree diagrams.
- I can interpret probability tables.
- I can calculate probabilities using trees.
- I can solve sequential probability problems.
- I can communicate probability reasoning clearly.
Tree Diagrams and Tables
Probability problems become more challenging when an experiment has several stages or when information is divided into different groups. Two of the most useful tools for organizing these situations are probability tree diagrams and probability tables.
A tree diagram shows how an experiment develops step by step. A probability table organizes information into rows and columns so that relationships between events can be seen clearly.
These representations help us answer questions such as:
- What is the probability that two events both occur?
- What is the probability of one outcome followed by another?
- How does an earlier result affect a later probability?
- What is the probability of one of several possible sequences?
- How can information from a survey or experiment be organized systematically?
The mathematics behind these methods is based largely on two ideas:
Along a path → multiply probabilities
Between alternative successful paths → add probabilities


Why Use Probability Trees?
A probability tree diagram shows the possible outcomes of a sequence of events.
Each branch represents one possible outcome.
Suppose a fair coin is tossed twice.
The first toss has two possibilities:
H or T
From each of these outcomes, the second toss again has:
H or T
The final possible sequences are:
HH, HT, TH, TT
A tree diagram makes these possibilities easy to see.
The Structure of a Tree Diagram
A probability tree normally contains:
- a starting point
- branches representing possible outcomes
- probabilities written on the branches
- additional branches for later stages
- final outcomes at the ends
- sometimes the probability of each complete path
For a two-stage experiment:
Start → First Event → Second Event → Final Outcome
Each route from the beginning to the end represents one possible sequence.
Branch Probabilities
Probabilities are written on the branches.
For a fair coin:
P(H) = 1/2
P(T) = 1/2
The probabilities leaving the same point must add to:
1
because one of the possible outcomes must occur.
Therefore:
1/2 + 1/2 = 1
If a spinner has:
P(red) = 0.3
P(blue) = 0.5
P(green) = 0.2
then:
0.3 + 0.5 + 0.2 = 1
This is a useful way to check whether a probability tree has been constructed correctly.
Multiply Along a Path
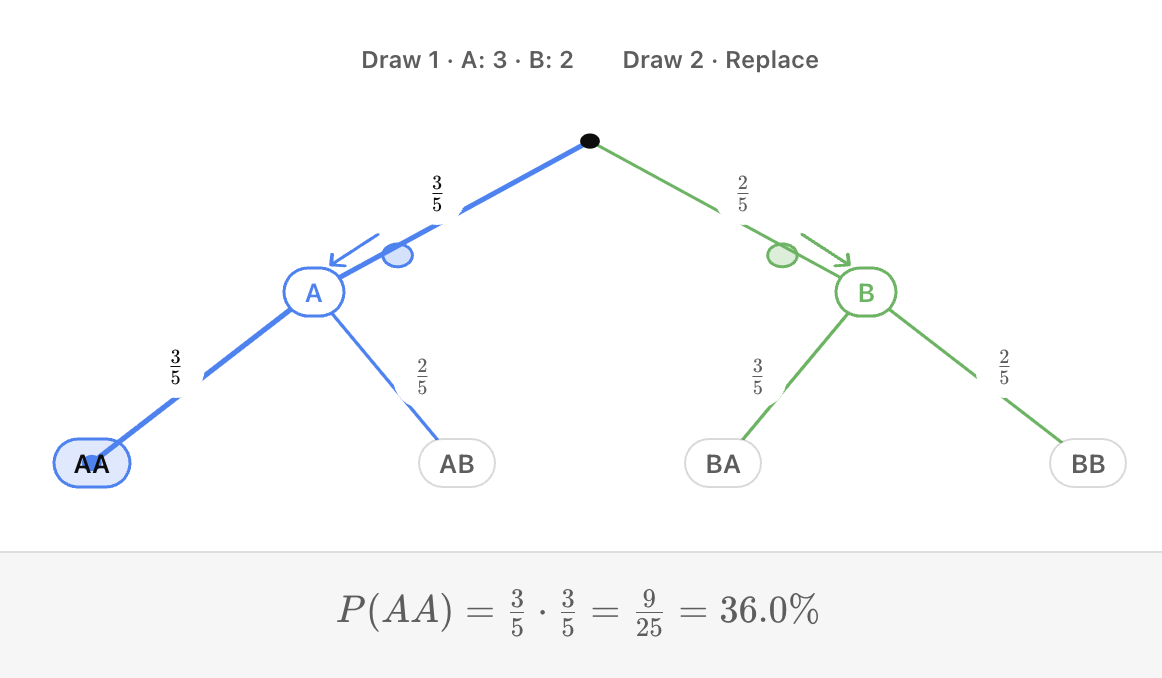
To calculate the probability of a particular sequence, multiply the probabilities along its branches.
Suppose a fair coin is tossed twice.
Find:
P(HH)
First toss heads:
1/2
Second toss heads:
1/2
Therefore:
P(HH)
= 1/2 × 1/2
= 1/4
Similarly:
P(HT)
= 1/2 × 1/2
= 1/4
The multiplication occurs because we are asking for:
heads AND heads


Add Alternative Paths
Sometimes an event can happen through several different paths.
Suppose we toss a fair coin twice and want:
exactly one head
This can occur as:
HT
or:
TH
Each path has probability:
1/2 × 1/2 = 1/4
Therefore:
P(exactly one head)
= P(HT) + P(TH)
= 1/4 + 1/4
= 1/2
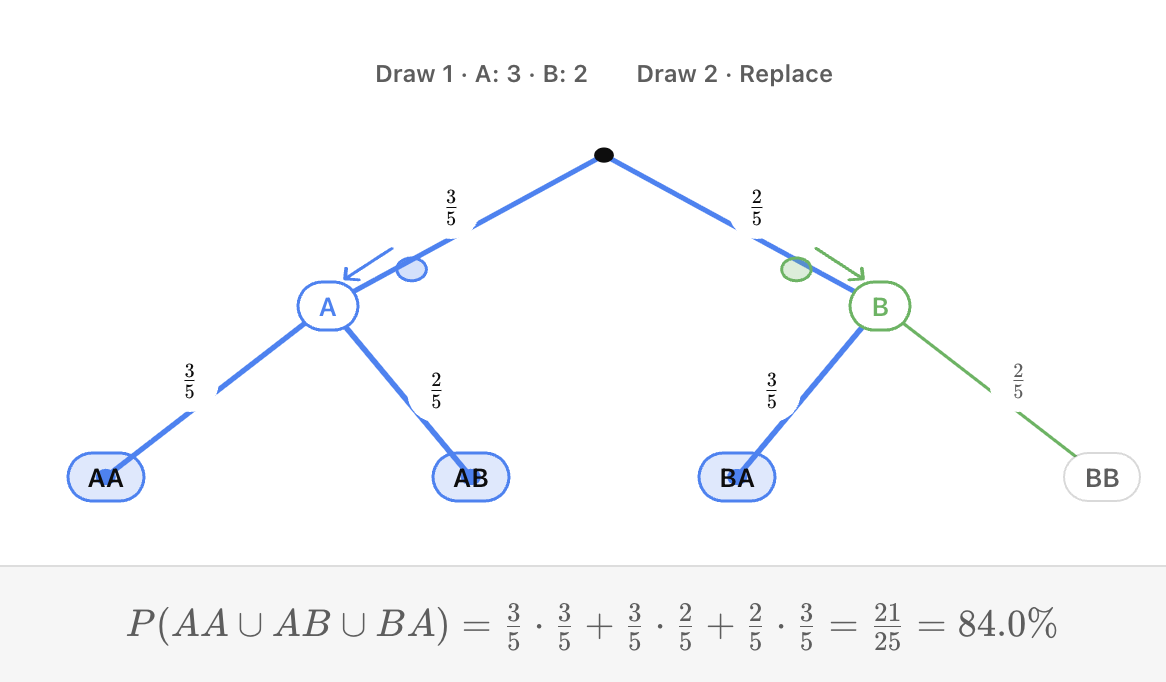
This gives the important tree-diagram rule:
Multiply along branches.
Add the probabilities of appropriate alternative paths.
Independent Events on a Tree
Events are independent when one event does not change the probability of another.
Suppose we:
- toss a fair coin
- roll a fair six-sided die
The coin result does not affect the die.
So from either H or T, the probabilities for the die remain:
1/6, 1/6, 1/6, 1/6, 1/6, 1/6
For example:
P(H and 6)
= 1/2 × 1/6
= 1/12
When events are independent, the probabilities at later stages remain unchanged by earlier outcomes.
Dependent Events on a Tree
Events are dependent when an earlier outcome changes a later probability.
This often happens when objects are selected without replacement.
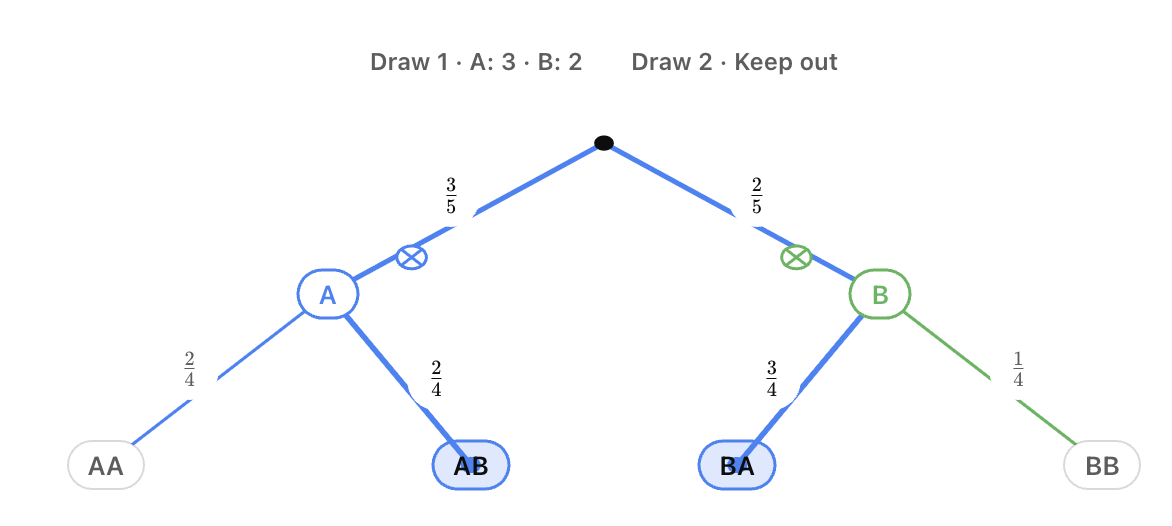
Suppose a bag contains:
3 red marbles
2 blue marbles
Two marbles are selected without replacement.
On the first draw:
P(R) = 3/5
P(B) = 2/5
If the first marble is red, the bag now contains:
2 red
2 blue
Therefore:
P(R second | R first) = 2/4
P(B second | R first) = 2/4
But if the first marble is blue, the bag contains:
3 red
1 blue
Therefore:
P(R second | B first) = 3/4
P(B second | B first) = 1/4
The second-stage probabilities depend on what happened first.
Here you can explore exactly how those branches change when sampling with or without replacement: