Transformations of Quadratic Functions
5. Combining Transformations
Learning outcomes
- I can identify multiple transformations.
- I can graph functions with several transformations.
- I can describe transformations in the correct order.
- I can compare transformed graphs.
- I can predict graph changes before plotting.
Combining Transformations of Quadratic Functions
Introduction
Quadratic functions can undergo several transformations at the same time. These transformations include horizontal translations, vertical translations, reflections, vertical stretches, and vertical compressions.
Rather than studying each transformation separately, we can combine them to create many different parabolas from the parent quadratic function:
y = x²
For example, consider:
y = −2(x − 3)² + 4
This function includes several transformations:
-
A reflection across the x-axis.
-
A vertical stretch by a factor of 2.
-
A horizontal translation 3 units right.
-
A vertical translation 4 units up.
By recognising these changes, we can predict the graph's shape, position, direction of opening, vertex, and axis of symmetry before plotting any points.
The ability to combine transformations is important for graphing functions efficiently, interpreting mathematical models, and understanding relationships between different quadratic equations.
Reviewing the Parent Quadratic Function
The parent quadratic function is:
f(x) = x²
Its graph is a U-shaped parabola.

Characteristics
-
Vertex: (0, 0)
-
Axis of symmetry: x = 0
-
Direction of opening: Upward
-
Minimum value: 0
-
Domain: All real numbers
-
Range: y ≥ 0
The parent function provides a starting point for analysing transformed quadratic functions.
Table of Values
|
x |
y = x² |
|---|---|
|
−2 |
4 |
|
−1 |
1 |
|
0 |
0 |
|
1 |
1 |
|
2 |
4 |
Every transformed parabola can be related to this parent function through changes in its equation.
Understanding Vertex Form
The most useful form for identifying multiple transformations is:
y = a(x − h)² + k
Each parameter has a specific effect.
|
Parameter |
Effect on the graph |
|---|---|
|
a |
Vertical stretch or compression |
|
Sign of a |
Direction of opening; reflection if negative |
|
h |
Horizontal translation |
|
k |
Vertical translation |
The vertex is:
(h, k)
The axis of symmetry is:
x = h
Example
Consider:
y = −3(x + 2)² + 5
Identify the parameters:
a = −3
h = −2
k = 5
Transformations
-
Reflect across the x-axis.
-
Vertically stretch by a factor of 3.
-
Translate 2 units left.
-
Translate 5 units up.
Graph Characteristics
-
Vertex: (−2, 5)
-
Axis of symmetry: x = −2
-
Opens downward
-
Maximum value: 5
-
Range: y ≤ 5
Important Observation
The vertex and direction of opening can be determined without expanding the equation.
Identifying Multiple Transformations
Consider:
y = 2(x − 4)² − 3
Horizontal Translation
The expression (x − 4) indicates a shift 4 units right.
Vertical Translation
The −3 indicates a shift 3 units down.
Vertical Stretch
The coefficient 2 indicates a vertical stretch by a factor of 2.
Reflection
Since a is positive, there is no reflection across the x-axis.
Final Characteristics
-
Vertex: (4, −3)
-
Axis of symmetry: x = 4
-
Opens upward
-
Narrower than the parent parabola
-
Minimum value: −3
Important Observation
Each part of vertex form provides information about a different transformation.
Describing Transformations in the Correct Order
When combining transformations, the order matters because some transformations do not commute.
A reliable sequence for constructing:
y = a(x − h)² + k
from the parent function y = x² is:
-
Apply the horizontal translation h.
-
Apply the vertical stretch or compression by |a|.
-
Reflect across the x-axis if a is negative.
-
Apply the vertical translation k.
This sequence is particularly useful because it produces the equation directly from vertex form.
Example
Construct:
y = −2(x − 3)² + 4
Start with:
y = x²
Step 1: Translate Right 3
y = (x − 3)²
Step 2: Vertically Stretch by 2
y = 2(x − 3)²
Step 3: Reflect Across the x-Axis
y = −2(x − 3)²
Step 4: Translate Up 4
y = −2(x − 3)² + 4
Important Observation
The vertical translation is applied after the vertical stretch and reflection.
Otherwise, the vertical position may also be multiplied or reflected.
Why the Order of Transformations Matters
Consider the parent function:
f(x) = x²
Suppose we want to reflect the graph across the x-axis and translate it upward by 3 units.
Method A: Reflect, Then Translate
Reflect:
y = −x²
Translate upward by 3:
y = −x² + 3
Vertex:
(0, 3)
Method B: Translate, Then Reflect
Translate upward by 3:
y = x² + 3
Reflect the entire function:
y = −(x² + 3)
Simplify:
y = −x² − 3
Vertex:
(0, −3)
Comparison
|
Transformation order |
Final function |
Vertex |
|---|---|---|
|
Reflect, then translate up 3 |
y = −x² + 3 |
(0, 3) |
|
Translate up 3, then reflect |
y = −x² − 3 |
(0, −3) |
The final graphs are different.
Important Conclusion
The order of vertical translations and reflections can change the final graph.
However, some transformations can be performed in either order without changing the result. For example, horizontal and vertical translations commute.
Predicting the Graph Before Plotting
Before graphing a transformed quadratic, examine its equation.
Consider:
y = −0.5(x + 4)² + 6
Step 1: Identify the Vertex
h = −4
k = 6
Vertex:
(−4, 6)
Step 2: Determine the Direction of Opening
a = −0.5
Since a is negative, the parabola opens downward.
Step 3: Determine the Width
|a| = 0.5
Since 0 < |a| < 1, the parabola is wider than the parent.
Step 4: Determine the Axis of Symmetry
x = −4
Step 5: Determine the Range
The vertex is a maximum.
y ≤ 6
Prediction
The graph will be a wide, downward-opening parabola with its highest point at (−4, 6).
This prediction can be made before calculating any additional points.
Exploring Combined Transformations
Adjust the parameters to see how the graph changes.
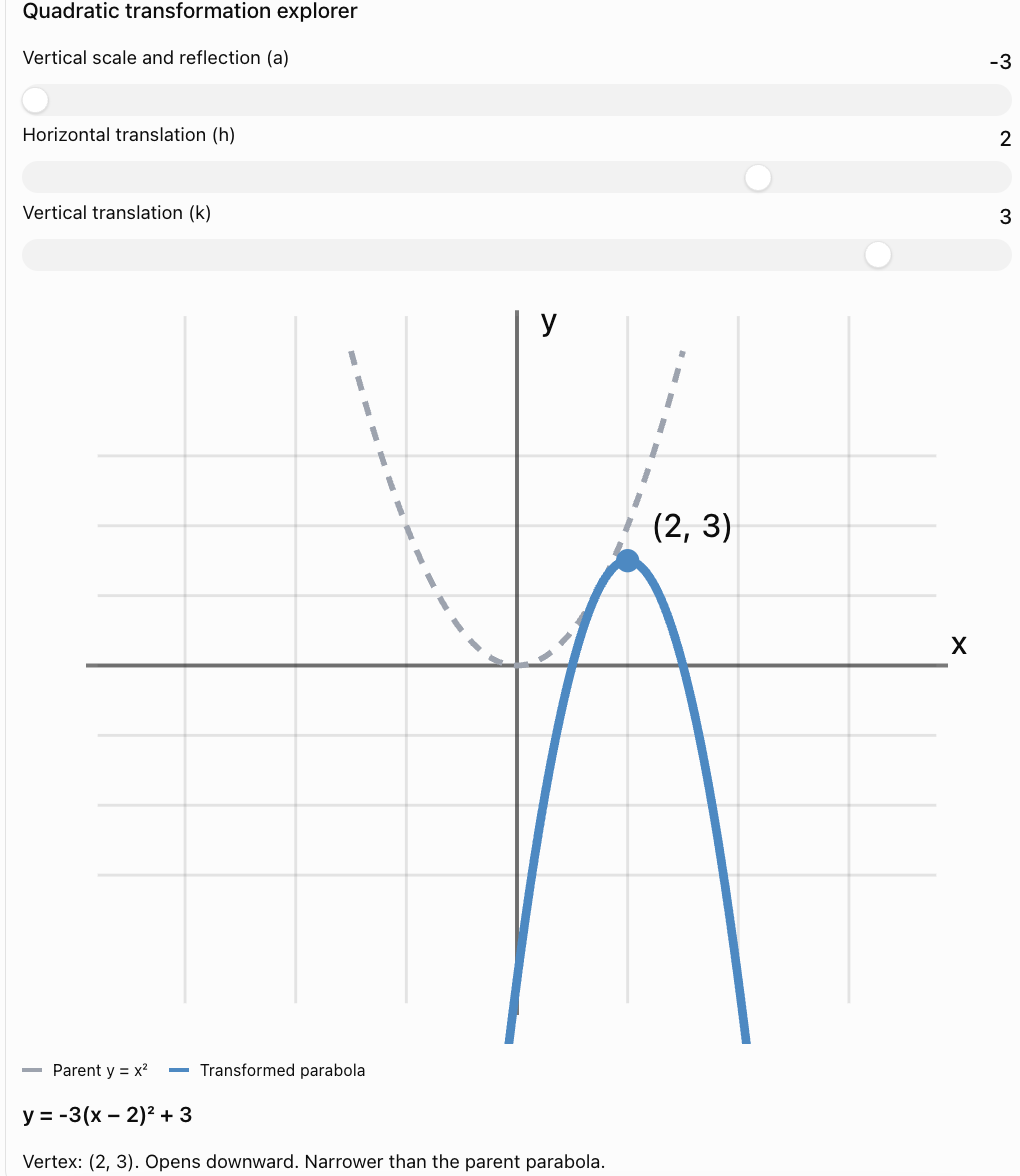
Key Observation
Changing a affects the shape and orientation.
Changing h moves the graph horizontally.
Changing k moves the graph vertically.
These transformations can be combined without needing to expand the equation.
Graphing a Function with Multiple Transformations
Consider:
y = −2(x − 1)² + 3
Step 1: Identify the Transformations
-
Right 1
-
Vertical stretch by 2
-
Reflection across the x-axis
-
Up 3
Step 2: Find the Vertex
(1, 3)
Step 3: Determine the Axis of Symmetry
x = 1
Step 4: Determine the Direction
The coefficient is negative, so the parabola opens downward.
Step 5: Calculate Points
|
x |
y = −2(x − 1)² + 3 |
|---|---|
|
−1 |
−5 |
|
0 |
1 |
|
1 |
3 |
|
2 |
1 |
|
3 |
−5 |
Step 6: Plot the Points
Plot:
(−1, −5)
(0, 1)
(1, 3)
(2, 1)
(3, −5)
Draw a smooth, downward-opening parabola through the points.
Final Characteristics
-
Vertex: (1, 3)
-
Axis of symmetry: x = 1
-
Maximum value: 3
-
Domain: All real numbers
-
Range: y ≤ 3
Using the Step Pattern
The step pattern provides an efficient way to graph quadratic functions.
For the parent function:
y = x²
The vertical changes for successive one-unit horizontal steps are:
1, 3, 5, 7, ...
For:
y = a(x − h)² + k
multiply the step pattern by a.
Example
Consider:
y = −3(x + 2)² + 4
The vertex is:
(−2, 4)
The coefficient is:
a = −3
The step pattern becomes:
−3, −9, −15, −21, ...
Graphing
Start at the vertex:
(−2, 4)
Move one unit right and three units down:
(−1, 1)
Move another unit right and nine units down:
(0, −8)
Reflect these points across the axis of symmetry to find corresponding points on the left.
Important Observation
The step pattern combines the effect of the coefficient a with the vertex location.
Comparing Multiple Transformed Functions
Consider:
f(x) = x²
g(x) = 2(x − 3)² + 1
h(x) = −0.5(x + 2)² − 4
Comparison
|
Property |
f(x) |
g(x) |
h(x) |
|---|---|---|---|
|
Vertex |
(0, 0) |
(3, 1) |
(−2, −4) |
|
Opens |
Up |
Up |
Down |
|
Width |
Parent |
Narrower |
Wider |
|
Axis of symmetry |
x = 0 |
x = 3 |
x = −2 |
|
Extremum |
Minimum 0 |
Minimum 1 |
Maximum −4 |
|
Range |
y ≥ 0 |
y ≥ 1 |
y ≤ −4 |
Observations
Function g(x) is narrower than the parent and shifted right and upward.
Function h(x) is wider, reflected, and shifted left and downward.
Important Conclusion
The parameters a, h, and k allow us to compare multiple graph characteristics without plotting every point.
Combining Transformations Using Function Notation
Transformations can also be described using function notation.
Suppose:
f(x) = x²
Horizontal Translation
g(x) = f(x − 3)
Moves the graph right three units.
Vertical Translation
g(x) = f(x) + 4
Moves the graph upward four units.
Reflection
g(x) = −f(x)
Reflects the graph across the x-axis.
Vertical Stretch
g(x) = 2f(x)
Vertically stretches the graph by a factor of two.
Combined Transformation
g(x) = −2f(x − 3) + 4
Substitute f(x) = x²:
g(x) = −2(x − 3)² + 4
Interpretation
-
Right 3
-
Vertical stretch by 2
-
Reflection across the x-axis
-
Up 4
Recognising Transformations from Standard Form
Quadratic functions are not always presented in vertex form.
Consider:
y = 2x² − 8x + 5
To identify the transformations clearly, rewrite the function by completing the square.
Step 1: Factor the Leading Coefficient
y = 2(x² − 4x) + 5
Step 2: Complete the Square
Half of −4 is −2.
Square −2:
4
Add and subtract 4 inside the brackets:
y = 2(x² − 4x + 4 − 4) + 5
Step 3: Rewrite
y = 2[(x − 2)² − 4] + 5
Step 4: Simplify
y = 2(x − 2)² − 8 + 5
y = 2(x − 2)² − 3
Transformations
-
Right 2
-
Vertical stretch by 2
-
Down 3
Graph Characteristics
-
Vertex: (2, −3)
-
Axis of symmetry: x = 2
-
Opens upward
-
Minimum value: −3
Important Observation
Completing the square converts standard form into vertex form, making transformations easier to identify.
Comparing Transformations in Different Orders
Consider:
f(x) = x²
Suppose we want to stretch vertically by 2 and translate upward by 3.
Stretch, Then Translate
First stretch:
y = 2x²
Then translate:
y = 2x² + 3
Vertex:
(0, 3)
Translate, Then Stretch
First translate:
y = x² + 3
Then multiply the entire function by 2:
y = 2(x² + 3)
y = 2x² + 6
Vertex:
(0, 6)
Comparison
|
Order |
Equation |
Vertex |
|---|---|---|
|
Stretch, then translate |
y = 2x² + 3 |
(0, 3) |
|
Translate, then stretch |
y = 2x² + 6 |
(0, 6) |
Important Conclusion
Vertical stretches and vertical translations generally do not commute.
Changing their order can change the final graph.
Predicting the Number of x-Intercepts
The vertex and direction of opening can help predict whether a parabola crosses the x-axis.
Example A
y = (x − 2)² + 3
The parabola opens upward.
Its minimum value is 3.
Since the entire graph is above the x-axis, it has no real x-intercepts.
Example B
y = (x − 2)² − 3
The parabola opens upward.
Its minimum value is −3.
The graph crosses the x-axis twice.
Example C
y = −2(x + 1)² + 4
The parabola opens downward.
Its maximum value is 4.
The graph crosses the x-axis twice.
Important Observation
The vertex position and direction of opening allow us to predict the number of real x-intercepts before solving the equation.
Real-World Application: Projectile Motion
Quadratic functions can model the height of objects moving through the air.

Example
A ball's height is modelled by:
h(t) = −5(t − 2)² + 20
where:
-
h = height in metres.
-
t = time in seconds.
Transformations
Compared with y = x²:
-
Reflection across the x-axis.
-
Vertical stretch by 5.
-
Horizontal translation right 2.
-
Vertical translation up 20.
Interpretation
The vertex is:
(2, 20)
The ball reaches its maximum height of 20 metres after two seconds.
Important Observation
In a height-time model, the horizontal axis represents time rather than horizontal distance.
The graph's transformations describe changes in the mathematical relationship between time and height.
Real-World Application: Business Profit
Quadratic functions can represent profit relationships.
Example
A company's profit is modelled by:
P(x) = −3(x − 12)² + 250
where x represents the quantity produced.
Graph Characteristics
-
Vertex: (12, 250)
-
Opens downward
-
Maximum profit: 250
-
Optimal quantity: 12
Transformations
Compared with y = x²:
-
Reflection across the x-axis.
-
Vertical stretch by 3.
-
Right 12.
-
Up 250.
Interpretation
The profit decreases rapidly when production moves away from the optimal quantity.
The coefficient −3 determines the curvature of the profit model.
Real-World Application: Engineering Design
Parabolic arches and reflectors can be represented using transformed quadratic functions.

Example
An arch is modelled by:
y = −0.25(x − 4)² + 10
Characteristics
-
Vertex: (4, 10)
-
Opens downward
-
Wider than the parent parabola
-
Maximum height: 10
Transformations
-
Reflection across the x-axis.
-
Vertical compression by 0.25.
-
Right 4.
-
Up 10.
Interpretation
The coefficient controls the width of the arch.
The horizontal translation determines its position.
The vertical translation determines its maximum height.
Common Mistakes
Applying transformations in the wrong order
Vertical stretches and reflections should be applied before the final vertical translation when using the standard construction from vertex form.
Confusing horizontal translation signs
The expression (x − h) moves the graph right when h is positive.
The expression (x + h) moves the graph left when h is positive.
Ignoring the negative sign of a
A negative coefficient indicates a reflection across the x-axis.
Confusing stretching and compression
Larger |a| values produce narrower parabolas.
Smaller nonzero |a| values produce wider parabolas.
Changing the vertex when only a changes
In vertex form, changing a alone does not change the vertex.
Forgetting that k determines vertical position
The constant outside the squared expression determines the vertical translation.
Expanding incorrectly
Expressions such as (x − 3)² must be expanded carefully.
Confusing the vertex with an intercept
The vertex is not necessarily on either coordinate axis.
Assuming all transformations commute
Some transformations produce different results when their order is reversed.
Failing to predict the graph before plotting
Examining a, h, and k first makes graphing faster and more accurate.
Key Terms
-
Transformation: Change in the position, size, or orientation of a graph.
-
Combined Transformations: Two or more transformations applied to the same function.
-
Parent Function: Simplest function in a family of related functions.
-
Quadratic Function: Function whose highest variable power is two.
-
Parabola: Graph of a quadratic function.
-
Vertex Form: Quadratic written as y = a(x − h)² + k.
-
Standard Form: Quadratic written as y = ax² + bx + c.
-
Vertex: Maximum or minimum point of a parabola.
-
Axis of Symmetry: Vertical line dividing a parabola into two matching halves.
-
Horizontal Translation: Movement of a graph left or right.
-
Vertical Translation: Movement of a graph up or down.
-
Reflection: Transformation producing a mirror image across a line.
-
Vertical Stretch: Transformation that multiplies vertical distances by a factor greater than 1.
-
Vertical Compression: Transformation that multiplies vertical distances by a factor between 0 and 1.
-
Coefficient a: Parameter controlling vertical scale and direction of opening.
-
Horizontal Shift h: Parameter controlling horizontal position.
-
Vertical Shift k: Parameter controlling vertical position.
-
Transformation Order: Sequence in which transformations are applied.
-
Commutative Transformations: Transformations whose order can be reversed without changing the result.
-
Minimum Value: Lowest value of a function.
-
Maximum Value: Highest value of a function.
-
Domain: Set of possible input values.
-
Range: Set of possible output values.
-
x-Intercept: Point where a graph crosses or touches the x-axis.
-
Quadratic Model: Quadratic function used to represent a real-world relationship.
Key Takeaways
-
Quadratic functions can undergo multiple transformations simultaneously.
-
Vertex form makes transformations easy to identify.
-
The coefficient a controls vertical scale and direction of opening.
-
The parameter h controls horizontal position.
-
The parameter k controls vertical position.
-
Negative a-values indicate reflection across the x-axis.
-
Larger |a| values produce narrower parabolas.
-
Smaller nonzero |a| values produce wider parabolas.
-
The vertex is located at (h, k).
-
The axis of symmetry is x = h.
-
The order of some transformations affects the final graph.
-
Completing the square helps identify transformations from standard form.
-
Graph characteristics can be predicted before plotting points.
-
The step pattern provides an efficient graphing method.
-
Combined transformations are useful in physics, engineering, business, and mathematical modelling.
Check Your Understanding
Identifying Transformations
-
Describe the transformations in y = 2(x − 3)² + 4.
-
Describe the transformations in y = −3(x + 2)² − 5.
-
Identify the vertex of y = 0.5(x − 4)² + 6.
-
Determine the axis of symmetry of y = −2(x + 1)² + 3.
-
Explain how the sign of a affects the direction of opening.
Predicting Graphs
-
Does y = 4(x − 2)² + 1 open upward or downward?
-
Is y = 0.25(x + 3)² − 2 narrower or wider than the parent?
-
Find the range of y = −3(x − 1)² + 5.
-
Find the range of y = 2(x + 4)² − 6.
-
Explain why vertex form is useful for predicting graph characteristics.
Transformation Order
-
Explain why reflecting y = x² across the x-axis and then translating up 4 differs from translating up 4 and then reflecting.
-
Write the equation obtained by reflecting y = x² and translating it up 5.
-
Write the equation obtained by vertically stretching y = x² by 3 and translating it down 2.
-
Write the equation obtained by translating y = x² right 4 and vertically compressing by 0.5.
-
Explain why some transformations do not commute.
Comparing Functions
-
Compare y = 2(x − 3)² + 4 and y = −2(x − 3)² + 4.
-
Compare the vertices of y = (x − 2)² + 3 and y = (x + 4)² − 1.
-
Determine the maximum value of y = −0.5(x − 6)² + 8.
-
Explain how changing a affects the graph when h and k remain constant.
-
Describe one real-world application of combined quadratic transformations.
Answer Key
|
Question |
Answer |
|---|---|
|
1 |
Stretch 2, right 3, up 4 |
|
2 |
Reflect, stretch 3, left 2, down 5 |
|
3 |
(4, 6) |
|
4 |
x = −1 |
|
5 |
Positive opens up; negative opens down |
|
6 |
Upward |
|
7 |
Wider |
|
8 |
y ≤ 5 |
|
9 |
y ≥ −6 |
|
10 |
It directly reveals a, h, and k |
|
11 |
Reflection changes the sign of the vertical translation if applied afterward |
|
12 |
y = −x² + 5 |
|
13 |
y = 3x² − 2 |
|
14 |
y = 0.5(x − 4)² |
|
15 |
Reversing the order can change the final equation |
|
16 |
Same vertex and width; opposite opening directions |
|
17 |
(2, 3) and (−4, −1) |
|
18 |
8 |
|
19 |
It changes width and possibly direction of opening |
|
20 |
Projectile motion, profit optimisation, or arch design |
Extended Challenge
Identifying Transformations
-
Describe all transformations in y = −4(x − 5)² + 7.
-
Describe all transformations in y = 0.25(x + 3)² − 6.
-
Determine the vertex and axis of symmetry of y = −2(x + 4)² + 9.
-
Compare y = 3(x − 2)² + 1 and y = −3(x − 2)² + 1.
-
Explain why changing k does not change the width of a parabola.
Writing Equations
-
Reflect y = x², stretch vertically by 3, translate right 4, and translate up 2.
-
Compress y = x² vertically by 0.5, translate left 3, and translate down 5.
-
Translate y = x² right 2, reflect across the x-axis, and translate up 6.
-
Write the equation of a parabola with vertex (−4, 3), opening downward, and vertical stretch factor 2.
-
Write the equation of a parabola with vertex (5, −2), opening upward, and vertical compression factor 0.25.
Comparing Graphs
-
Compare y = 2(x − 3)² + 4 and y = 0.5(x − 3)² + 4.
-
Determine which graph is narrower.
-
Explain why both graphs have the same vertex.
-
Sketch both graphs on the same coordinate grid.
-
Compare their ranges.
Applications
-
A projectile follows h(t) = −5(t − 2)² + 20. Identify all transformations from y = t².
-
A profit model is P(x) = −2(x − 10)² + 200. Determine its maximum value and the input at which it occurs.
-
An arch is modelled by y = −0.25(x − 4)² + 10. Determine its vertex and direction of opening.
-
Explain how changing a affects the width of a parabolic arch.
-
Describe how combined transformations can help compare related real-world mathematical models.
Final Investigation: Analysing Combined Quadratic Transformations
Consider the following quadratic functions:
Function A: y = x²
Function B: y = 2(x − 3)² + 4
Function C: y = −3(x + 2)² + 5
Function D: y = 0.5(x − 4)² − 6
Function E: y = −0.25(x + 5)² − 2
Complete the investigation.
-
Identify the parent quadratic function.
-
Determine a, h, and k for each function.
-
Identify the transformations applied to each function.
-
Determine the vertex of each function.
-
Determine the axis of symmetry of each function.
-
Identify which functions open upward.
-
Identify which functions open downward.
-
Identify which functions are narrower than the parent.
-
Identify which functions are wider than the parent.
-
Determine the maximum or minimum value of each function.
-
Determine the range of each function.
-
Create a table of values for Function A.
-
Create a table of values for Function B.
-
Graph Functions A and B on the same coordinate grid.
-
Graph Functions C, D, and E on a second coordinate grid.
-
Compare the shapes and positions of all five functions.
-
Explain how the sign and magnitude of a affect each graph.
-
Explain how h and k affect the vertex.
-
Describe a reliable sequence for applying combined transformations.
-
Write a conclusion explaining how multiple transformations can be used to predict and graph quadratic functions efficiently.