Transformations of Quadratic Functions
4. Stretching and Compressing
Learning outcomes
- I can identify vertical stretches.
- I can identify vertical compressions.
- I can compare narrow and wide parabolas.
- I can explain how coefficient a affects the graph.
- I can graph transformed functions.
Stretching and Compressing Quadratic Functions
Introduction
Quadratic functions can be transformed in several ways, including translations, reflections, vertical stretches, and vertical compressions.
A vertical stretch makes the graph of a quadratic function appear narrower, while a vertical compression makes it appear wider.
These transformations are controlled by the coefficient a in the quadratic function.
Consider the parent function:
y = x²
Now compare:
-
y = 3x² — narrower than the parent parabola.
-
y = 0.5x² — wider than the parent parabola.
-
y = −2x² — narrower and reflected across the x-axis.
Understanding vertical stretches and compressions helps us predict the shape of a parabola, compare quadratic functions, and graph transformed equations efficiently.


The Parent Quadratic Function
The parent quadratic function is:
f(x) = x²
Its graph is a U-shaped parabola.
Characteristics
-
Vertex: (0, 0)
-
Axis of symmetry: x = 0
-
Direction of opening: Upward
-
Minimum value: 0
-
Domain: All real numbers
-
Range: y ≥ 0
Table of Values
|
x |
y = x² |
|---|---|
|
−3 |
9 |
|
−2 |
4 |
|
−1 |
1 |
|
0 |
0 |
|
1 |
1 |
|
2 |
4 |
|
3 |
9 |
The parent function provides a reference for comparing other quadratic graphs.
Understanding the Coefficient a
The general quadratic function in vertex form is:
y = a(x − h)² + k
The coefficient a controls two important properties:
-
The direction of opening.
-
The vertical stretch or compression.
The magnitude |a| determines the vertical scale.
The sign of a determines whether the parabola opens upward or downward.
How a Affects the Graph
|
Value of a |
Effect |
|---|---|
|
a > 1 |
Vertical stretch; narrower parabola |
|
a = 1 |
Same width as parent |
|
0 < a < 1 |
Vertical compression; wider parabola |
|
−1 < a < 0 |
Vertical compression and reflection |
|
a = −1 |
Reflection; same width |
|
a < −1 |
Vertical stretch and reflection |
Important Observation
The coefficient a does not determine the location of the vertex when the equation is already in vertex form.
The values h and k determine the vertex.
Vertical Stretches
A vertical stretch occurs when the outputs of a function are multiplied by a factor greater than 1.
For the parent quadratic:
y = ax², where a > 1
The graph becomes narrower than y = x².
Example
Consider:
y = 3x²
Every y-value of the parent function is multiplied by 3.
Table of Values
|
x |
y = x² |
y = 3x² |
|---|---|---|
|
−2 |
4 |
12 |
|
−1 |
1 |
3 |
|
0 |
0 |
0 |
|
1 |
1 |
3 |
|
2 |
4 |
12 |
Interpretation
At x = 1:
Parent function: y = 1
Stretched function: y = 3
At x = 2:
Parent function: y = 4
Stretched function: y = 12
The y-values are three times as far from the x-axis.
Important Observation
The vertex remains at (0, 0).
The axis of symmetry remains x = 0.
The parabola opens upward but appears narrower.
Why Does a Vertical Stretch Make a Parabola Narrower?
A vertical stretch increases the distance of each point from the x-axis.
Consider:
y = x²
and:
y = 4x²
For x = 1:
-
Parent: y = 1
-
Stretched: y = 4
For x = 2:
-
Parent: y = 4
-
Stretched: y = 16
The stretched parabola rises more rapidly as x moves away from the vertex.
This makes its sides appear steeper and the graph narrower.
Important Distinction
The transformation is called a vertical stretch because the y-values are multiplied.
It is not a horizontal compression, even though the graph appears narrower.
For a quadratic parabola, the two transformations can produce equivalent shapes under suitable scale factors, but they are described differently.
Vertical Compressions
A vertical compression occurs when the outputs of a function are multiplied by a factor between 0 and 1.
For the parent quadratic:
y = ax², where 0 < a < 1
The graph becomes wider than y = x².
Example
Consider:
y = 0.25x²
Every y-value of the parent function is multiplied by 0.25.
Table of Values
|
x |
y = x² |
y = 0.25x² |
|---|---|---|
|
−4 |
16 |
4 |
|
−2 |
4 |
1 |
|
0 |
0 |
0 |
|
2 |
4 |
1 |
|
4 |
16 |
4 |
Interpretation
The y-values are one-quarter of the corresponding parent-function values.
The graph rises more slowly as x moves away from the vertex.
Important Observation
The vertex remains at (0, 0).
The axis of symmetry remains x = 0.
The parabola opens upward but appears wider.
Exploring Vertical Stretches and Compressions
Change the coefficient a to see how it affects the shape of the parabola.
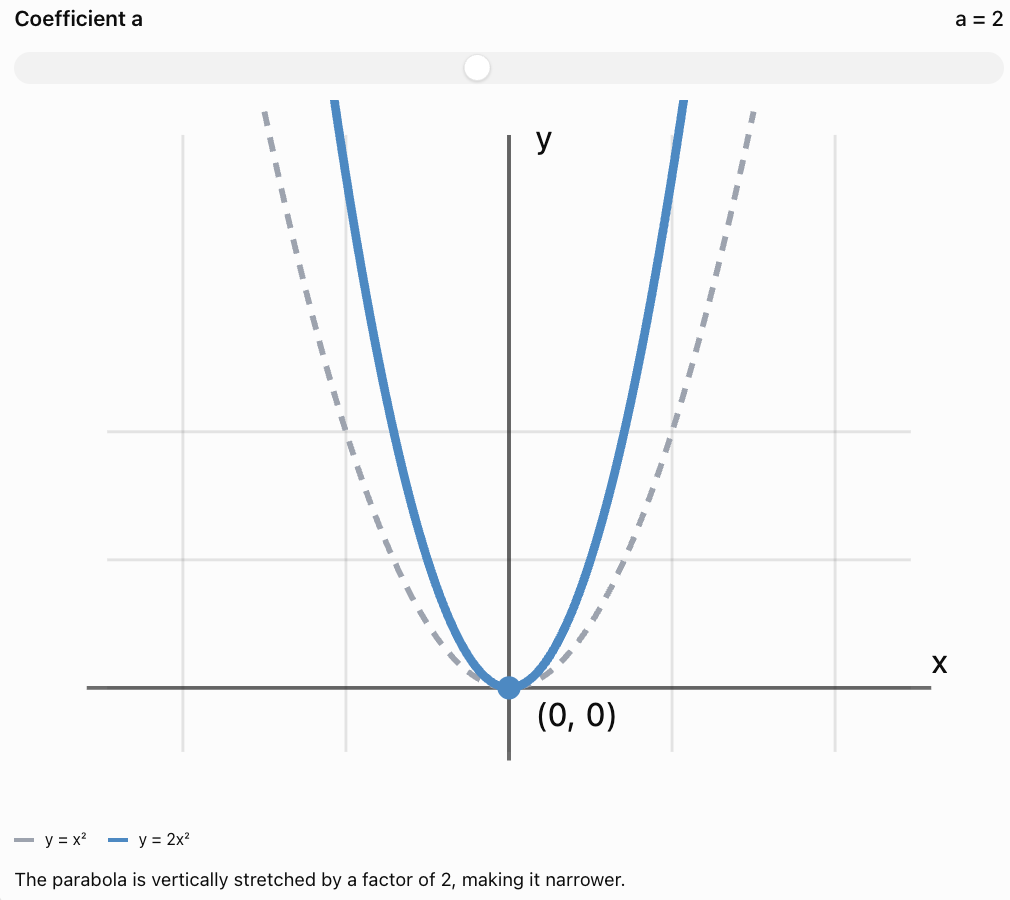
Key Observation
Increasing |a| makes the parabola narrower.
Decreasing |a| toward zero makes the parabola wider.
Comparing Narrow and Wide Parabolas
Consider these functions:
f(x) = x²
g(x) = 4x²
h(x) = 0.25x²
Comparison
|
Property |
f(x) |
g(x) |
h(x) |
|---|---|---|---|
|
Coefficient a |
1 |
4 |
0.25 |
|
Vertex |
(0, 0) |
(0, 0) |
(0, 0) |
|
Opens |
Up |
Up |
Up |
|
Width |
Parent |
Narrower |
Wider |
|
Axis of symmetry |
x = 0 |
x = 0 |
x = 0 |
|
Minimum value |
0 |
0 |
0 |
Observations
All three graphs share the same vertex.
All three graphs open upward.
The function y = 4x² rises more rapidly.
The function y = 0.25x² rises more slowly.
Important Conclusion
The magnitude of a determines the apparent width of a parabola.
Negative Coefficients and Reflections
The sign of a determines the direction of opening.
If a is negative, the parabola opens downward.
Example
Consider:
y = −2x²
The coefficient is:
a = −2
Since a is negative, the graph is reflected across the x-axis.
Since |a| = 2, the graph is vertically stretched by a factor of 2.
Comparison
|
Function |
Direction |
Width |
|---|---|---|
|
y = 2x² |
Up |
Narrower |
|
y = −2x² |
Down |
Narrower |
|
y = 0.5x² |
Up |
Wider |
|
y = −0.5x² |
Down |
Wider |
Important Observation
The sign of a determines whether the graph opens upward or downward.
The magnitude |a| determines whether the graph is narrower or wider than the parent parabola.
Vertical Stretches in Vertex Form
Vertical stretches and compressions can be applied to translated parabolas.
Consider:
y = 3(x − 2)² + 4
The coefficient is:
a = 3
The vertex is:
(2, 4)
Interpretation
Compared with y = (x − 2)² + 4:
-
The parabola is vertically stretched by a factor of 3.
-
The vertex remains at (2, 4).
-
The axis of symmetry remains x = 2.
-
The parabola opens upward.
-
The graph becomes narrower.
Important Observation
When the stretch is applied relative to the vertex form, the vertical distances from the vertex are multiplied by |a|.
The vertex itself remains unchanged.
Vertical Compressions in Vertex Form
Consider:
y = 0.5(x + 3)² − 2
The coefficient is:
a = 0.5
The vertex is:
(−3, −2)
Interpretation
Compared with y = (x + 3)² − 2:
-
The parabola is vertically compressed by a factor of 0.5.
-
The vertex remains at (−3, −2).
-
The axis of symmetry remains x = −3.
-
The parabola opens upward.
-
The graph becomes wider.
Important Observation
The vertical compression changes the shape but does not change the vertex coordinates.
Graphing Stretched and Compressed Parabolas
A useful method is to begin with the vertex and calculate several nearby points.
Example
Graph:
y = 2(x − 1)² + 3
Step 1: Identify the Vertex
Vertex:
(1, 3)
Step 2: Identify the Coefficient
a = 2
The parabola opens upward and is narrower than the parent.
Step 3: Calculate Points
|
x |
y = 2(x − 1)² + 3 |
|---|---|
|
−1 |
11 |
|
0 |
5 |
|
1 |
3 |
|
2 |
5 |
|
3 |
11 |
Step 4: Plot the Points
Plot:
(−1, 11)
(0, 5)
(1, 3)
(2, 5)
(3, 11)
Step 5: Draw the Parabola
Connect the points with a smooth curve.
The graph is symmetric about:
x = 1
Using the Step Pattern
A useful shortcut for graphing quadratic functions is the step pattern.
For the parent function y = x², moving one unit horizontally from the vertex changes the y-value by 1.
Moving another unit changes the y-value by an additional 3.
Moving another unit changes the y-value by an additional 5.
The pattern is:
1, 3, 5, 7, ...
For:
y = a(x − h)² + k
multiply these vertical changes by a.
Example
Consider:
y = 2(x − 1)² + 3
The step pattern becomes:
2, 6, 10, 14, ...
Starting from the vertex (1, 3):
-
Move one unit right and two units up.
-
Move another unit right and six units up.
-
Move another unit right and ten units up.
Repeat symmetrically to the left.
Important Observation
If a is negative, the vertical steps move downward.
If |a| is less than 1, the vertical steps are smaller.
Comparing Stretches and Compressions Algebraically
Suppose:
f(x) = x²
and:
g(x) = 5x²
Then:
g(x) = 5f(x)
This represents a vertical stretch by a factor of 5.
Now suppose:
h(x) = 0.2x²
Then:
h(x) = 0.2f(x)
This represents a vertical compression by a factor of 0.2.
General Rule
If:
g(x) = af(x)
then:
-
|a| > 1 produces a vertical stretch.
-
0 < |a| < 1 produces a vertical compression.
-
a < 0 also produces a reflection across the x-axis.
Important Distinction
Multiplying an entire function by a changes all its output values.
Multiplying only the squared term in vertex form changes vertical distances from the vertex while preserving the vertex location.
Stretching and Compressing Translated Parabolas
Consider:
f(x) = (x − 2)² + 3
The vertex is:
(2, 3)
Vertical Stretch Relative to the Vertex
Change the coefficient of the squared term:
g(x) = 4(x − 2)² + 3
The vertex remains:
(2, 3)
Vertical Compression Relative to the Vertex
Use:
h(x) = 0.25(x − 2)² + 3
The vertex remains:
(2, 3)
Comparing the Functions
|
Function |
Vertex |
Width |
|---|---|---|
|
f(x) = (x − 2)² + 3 |
(2, 3) |
Parent width |
|
g(x) = 4(x − 2)² + 3 |
(2, 3) |
Narrower |
|
h(x) = 0.25(x − 2)² + 3 |
(2, 3) |
Wider |
Important Observation
The coefficient a changes the shape of the parabola without changing its vertex when h and k remain constant.
Effect of a on the Range
The sign of a determines whether the vertex is a minimum or maximum.
Positive a
The parabola opens upward.
The vertex is a minimum.
For:
y = a(x − h)² + k, where a > 0
the range is:
y ≥ k
Negative a
The parabola opens downward.
The vertex is a maximum.
For:
y = a(x − h)² + k, where a < 0
the range is:
y ≤ k
Example
Consider:
y = −3(x − 2)² + 7
The vertex is:
(2, 7)
The parabola opens downward.
Maximum value:
7
Range:
y ≤ 7
Important Observation
Changing the magnitude of a does not change the range when the vertex and direction of opening remain unchanged.
Changing the sign of a reverses the direction of opening and changes the range.
Effect of a on Intercepts
Vertical stretches and compressions can affect the intercepts of a quadratic function.
Example
Consider:
y = x² − 4
The x-intercepts are:
x = −2 and x = 2
Now consider:
y = 4x² − 4
Set y = 0:
4x² − 4 = 0
4x² = 4
x² = 1
x = ±1
Interpretation
Increasing the coefficient of the squared term from 1 to 4 makes the parabola narrower.
The x-intercepts move closer to the axis of symmetry.
Important Observation
Changing a while keeping the vertex-form value k fixed can change the x-intercepts.
However, multiplying an entire function by a nonzero constant preserves its x-intercepts.
Real-World Application: Projectile Motion
Quadratic functions are used to model the height of projectiles.

Example
Consider two height-time models:
h₁(t) = −5(t − 2)² + 20
h₂(t) = −2(t − 2)² + 20
Both functions have the same vertex:
(2, 20)
Both reach a maximum height of 20 metres after two seconds.
However:
-
h₁(t) has a larger |a| and is narrower.
-
h₂(t) has a smaller |a| and is wider.
Interpretation
The first graph decreases more rapidly as time moves away from the vertex.
The second graph decreases more slowly.
Important Observation
In a physical projectile model, the coefficient of t² is related to acceleration.
Changing it may represent a different physical environment or mathematical scenario.
Real-World Application: Business Profit
Quadratic functions can represent profit relationships.
Example
Consider:
P₁(x) = −2(x − 10)² + 200
P₂(x) = −0.5(x − 10)² + 200
Both functions have the same maximum profit:
200
Both reach this maximum at:
x = 10
Comparison
P₁(x) is narrower.
P₂(x) is wider.
Interpretation
The first profit model decreases more rapidly as production moves away from the optimal quantity.
The second model decreases more gradually.
Important Observation
The magnitude of a can describe how sensitive an outcome is to changes in the input variable.
Real-World Application: Engineering Design
Parabolic curves are used in architecture and engineering.

Example
Consider two arch designs:
y = −0.5x² + 8
y = −0.2x² + 8
Both arches have a maximum height of eight metres.
However:
-
The first arch is narrower.
-
The second arch is wider.
Interpretation
Changing the coefficient a changes the curvature and width of the arch.
Engineers can use quadratic models to compare different structural designs.
Common Mistakes
Confusing stretches and compressions
A larger |a| makes a parabola narrower.
A smaller nonzero |a| makes it wider.
Assuming a negative coefficient always means compression
A negative sign indicates reflection.
The magnitude determines stretching or compression.
Ignoring the absolute value of a
Use |a| when comparing widths.
Changing the vertex unnecessarily
Changing only a in vertex form does not change the vertex.
Confusing vertical and horizontal transformations
Vertical stretches multiply output differences.
Horizontal transformations change input values.
Assuming all parabolas open upward
Negative a-values produce downward-opening parabolas.
Using incorrect step patterns
The basic step pattern must be multiplied by a.
Forgetting that a cannot equal zero in a quadratic function
If a = 0, the squared term disappears and the function is no longer quadratic.
Assuming the range always changes when a changes
If the vertex and direction of opening remain unchanged, the range remains unchanged.
Confusing narrowness with translation
A narrow parabola is not necessarily shifted horizontally or vertically.
Key Terms
-
Vertical Stretch: Transformation that multiplies vertical distances by a factor greater than 1.
-
Vertical Compression: Transformation that multiplies vertical distances by a factor between 0 and 1.
-
Quadratic Function: Function whose highest variable power is two.
-
Parabola: Graph of a quadratic function.
-
Parent Function: Simplest function in a family of related functions.
-
Leading Coefficient: Coefficient of the x² term.
-
Coefficient a: Parameter controlling direction of opening and vertical scale.
-
Absolute Value: Distance of a number from zero.
-
Vertex: Maximum or minimum point of a parabola.
-
Axis of Symmetry: Vertical line dividing a parabola into two matching halves.
-
Reflection: Transformation producing a mirror image across a line.
-
Transformation: Change in the position, size, or orientation of a graph.
-
Vertex Form: Quadratic written as y = a(x − h)² + k.
-
Standard Form: Quadratic written as y = ax² + bx + c.
-
Narrow Parabola: Parabola with a larger |a| than a comparison parabola.
-
Wide Parabola: Parabola with a smaller nonzero |a| than a comparison parabola.
-
Step Pattern: Sequence of vertical changes used to graph a parabola.
-
Minimum Value: Lowest value of a function.
-
Maximum Value: Highest value of a function.
-
Domain: Set of possible input values.
-
Range: Set of possible output values.
-
x-Intercept: Point where a graph crosses or touches the x-axis.
-
y-Intercept: Point where a graph crosses the y-axis.
-
Quadratic Model: Quadratic function used to represent a real-world relationship.
Key Takeaways
-
The coefficient a controls the direction and vertical scale of a parabola.
-
Positive a-values produce upward-opening parabolas.
-
Negative a-values produce downward-opening parabolas.
-
When |a| > 1, the parabola is vertically stretched relative to the parent function.
-
When 0 < |a| < 1, the parabola is vertically compressed.
-
Larger |a| values produce narrower parabolas.
-
Smaller nonzero |a| values produce wider parabolas.
-
The sign of a determines the direction of opening.
-
The magnitude of a determines the vertical scale.
-
Changing only a in vertex form does not change the vertex.
-
The axis of symmetry remains unchanged when only a changes.
-
The step pattern can be multiplied by a to graph transformed parabolas.
-
Vertical stretches and compressions can be combined with reflections and translations.
-
The range depends on the vertex and direction of opening.
-
Quadratic transformations are useful in physics, engineering, business, and mathematical modelling.
Check Your Understanding
Identifying Stretches and Compressions
-
Is y = 4x² narrower or wider than y = x²?
-
Is y = 0.2x² narrower or wider than y = x²?
-
What does a = −3 indicate?
-
What does a = −0.5 indicate?
-
Which is narrower: y = 2x² or y = 5x²?
Comparing Graphs
-
Compare the directions of opening of y = 3x² and y = −3x².
-
Which is wider: y = 0.25x² or y = 0.75x²?
-
Find the vertex of y = 4(x − 2)² + 3.
-
Find the axis of symmetry of y = −2(x + 5)² − 1.
-
Explain why changing a in vertex form does not change the vertex.
Graphing
-
Calculate y when x = 2 for y = 3x².
-
Calculate y when x = 4 for y = 0.25x².
-
Find the first three vertical step changes for y = 2x².
-
Find the first three vertical step changes for y = −3x².
-
Describe how to graph y = 0.5(x − 1)² + 2.
Applications
-
Explain why a larger |a| produces a narrower parabola.
-
Find the range of y = 3(x − 2)² + 5.
-
Find the range of y = −0.5(x + 1)² + 4.
-
Explain how changing a affects the shape of a profit graph.
-
Describe one real-world application of vertical stretches or compressions.
Answer Key
|
Question |
Answer |
|---|---|
|
1 |
Narrower |
|
2 |
Wider |
|
3 |
Reflection and vertical stretch by factor 3 |
|
4 |
Reflection and vertical compression by factor 0.5 |
|
5 |
y = 5x² |
|
6 |
First opens upward; second opens downward |
|
7 |
y = 0.25x² |
|
8 |
(2, 3) |
|
9 |
x = −5 |
|
10 |
h and k remain unchanged |
|
11 |
12 |
|
12 |
4 |
|
13 |
2, 6, 10 |
|
14 |
−3, −9, −15 |
|
15 |
Plot vertex (1, 2), then use a compressed upward-opening shape |
|
16 |
The y-values increase more rapidly away from the vertex |
|
17 |
y ≥ 5 |
|
18 |
y ≤ 4 |
|
19 |
It changes how rapidly profit decreases away from the optimum |
|
20 |
Projectile motion, profit optimisation, or arch design |
Extended Challenge
Identifying Transformations
-
Describe the transformation from y = x² to y = 6x².
-
Describe the transformation from y = x² to y = 0.125x².
-
Describe the transformation from y = x² to y = −4x².
-
Describe the transformation from y = x² to y = −0.25x².
-
Explain why y = −3x² and y = 3x² have the same width.
Comparing Parabolas
-
Compare y = 2x² and y = 0.5x².
-
Determine which graph is narrower.
-
Calculate the y-values at x = 2 for both functions.
-
Explain how the coefficient affects the rate of increase.
-
Sketch both graphs on the same coordinate grid.
Vertex Form
-
Find the vertex of y = 5(x − 3)² + 2.
-
Find the vertex of y = −0.5(x + 4)² − 1.
-
Compare the widths of y = 3(x − 2)² + 4 and y = 0.25(x − 2)² + 4.
-
Explain why both functions in Question 13 have the same vertex.
-
Determine the ranges of both functions.
Applications
-
Compare h₁(t) = −5(t − 2)² + 20 and h₂(t) = −2(t − 2)² + 20.
-
Explain which height-time graph is narrower.
-
Compare P₁(x) = −3(x − 10)² + 200 and P₂(x) = −0.5(x − 10)² + 200.
-
Explain which profit model is more sensitive to changes in production.
-
Describe how engineers might use different a-values when designing parabolic arches.
Final Investigation: Comparing Vertical Stretches and Compressions
Consider the following quadratic functions:
Function A: y = x²
Function B: y = 3x²
Function C: y = 0.25x²
Function D: y = −2x²
Function E: y = 0.5(x − 2)² + 3
Complete the investigation.
-
Identify the parent quadratic function.
-
Determine the coefficient a for each function.
-
Identify which functions open upward.
-
Identify which functions open downward.
-
Identify which functions are vertically stretched relative to the parent.
-
Identify which functions are vertically compressed relative to the parent.
-
Determine the vertex of each function.
-
Determine the axis of symmetry of each function.
-
Create a table of values for Function A using x = −2, −1, 0, 1, 2.
-
Create corresponding tables for Functions B, C, and D.
-
Graph Functions A, B, C, and D on the same coordinate grid.
-
Compare the widths of the four graphs.
-
Explain why Function B is narrower than Function A.
-
Explain why Function C is wider than Function A.
-
Explain how Function D combines a reflection and stretch.
-
Determine the vertex and axis of symmetry of Function E.
-
Graph Function E.
-
Explain how Function E differs from the parent function.
-
Write a general rule describing the effect of coefficient a.
-
Write a conclusion explaining how vertical stretches, compressions, reflections, and translations can be combined to transform quadratic functions.