Transformations of Quadratic Functions
3. Reflections
Learning outcomes
- I can identify reflections across the x-axis.
- I can predict the effect of negative coefficients.
- I can graph reflected parabolas.
- I can compare original and reflected graphs.
- I can describe reflections algebraically.
Reflections of Quadratic Functions
Introduction
A reflection is a transformation that produces a mirror image of a graph across a line.
For quadratic functions, one of the most important reflections occurs across the x-axis. This changes an upward-opening parabola into a downward-opening parabola, or vice versa.
Consider the parent quadratic function:
y = x²
Its graph is a U-shaped parabola that opens upward.
Now consider:
y = −x²
The negative sign in front of x² reflects the graph across the x-axis. The new parabola opens downward.
Understanding reflections allows us to predict how negative coefficients affect quadratic graphs, identify changes to the vertex and intercepts, and compare original and reflected functions.


The Parent Quadratic Function
The parent quadratic function is:
f(x) = x²
Its graph is a parabola with the following characteristics:
-
Vertex: (0, 0)
-
Axis of symmetry: x = 0
-
Direction of opening: Upward
-
Minimum value: 0
-
Domain: All real numbers
-
Range: y ≥ 0
Table of Values
|
x |
y = x² |
|---|---|
|
−3 |
9 |
|
−2 |
4 |
|
−1 |
1 |
|
0 |
0 |
|
1 |
1 |
|
2 |
4 |
|
3 |
9 |
The graph is symmetric about the y-axis.
The vertex is the lowest point on the parabola.
What Is a Reflection Across the x-Axis?
A reflection across the x-axis changes the sign of every y-coordinate.
The transformation rule is:
(x, y) → (x, −y)
This means:
-
Positive y-values become negative.
-
Negative y-values become positive.
-
Points on the x-axis remain unchanged.
-
x-coordinates do not change.
Function Notation
If the original function is:
f(x)
then its reflection across the x-axis is:
g(x) = −f(x)
Example
Original function:
f(x) = x²
Reflected function:
g(x) = −x²
Every output of the original function is multiplied by −1.
Exploring Reflections
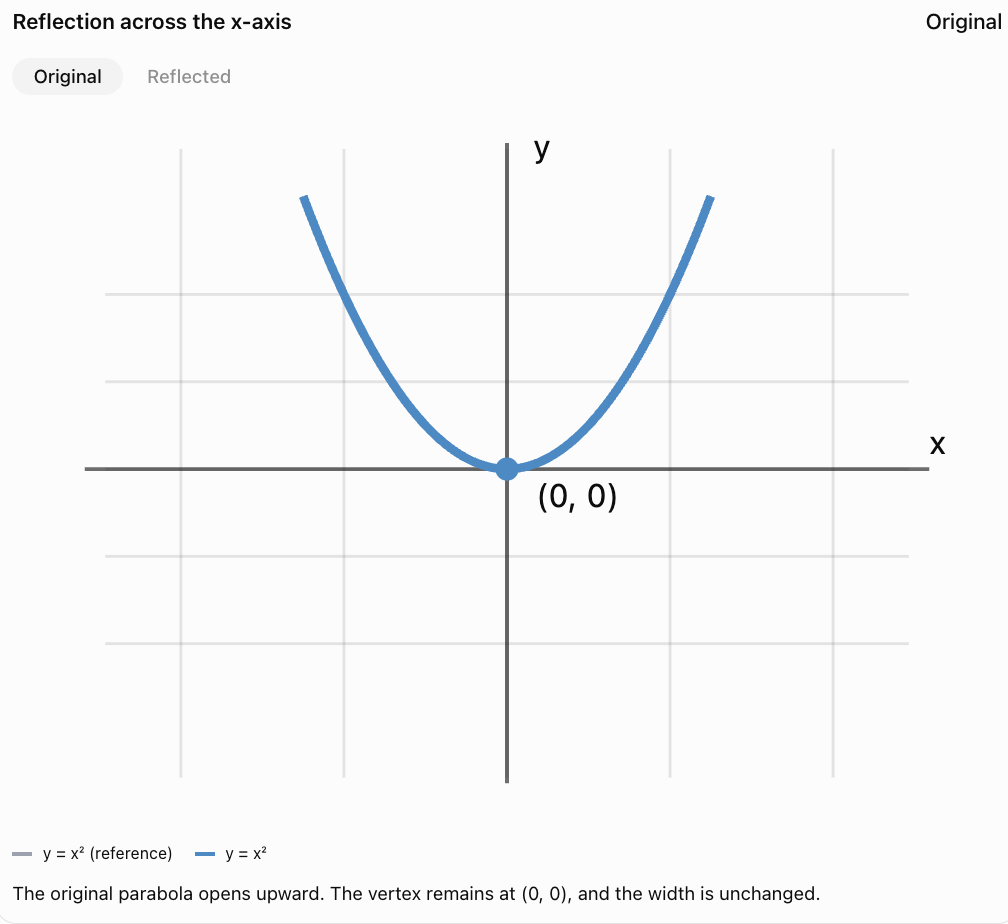
The following graph shows a parabola and its reflection across the x-axis.
Key Observation
Reflection across the x-axis changes the direction of opening but does not change the width of the parabola.
Comparing Original and Reflected Points
Consider:
f(x) = x²
and:
g(x) = −x²
Table of Values
|
x |
f(x) = x² |
g(x) = −x² |
|---|---|---|
|
−3 |
9 |
−9 |
|
−2 |
4 |
−4 |
|
−1 |
1 |
−1 |
|
0 |
0 |
0 |
|
1 |
1 |
−1 |
|
2 |
4 |
−4 |
|
3 |
9 |
−9 |
Notice that every y-value has the opposite sign.
Example
Original point:
(2, 4)
Reflected point:
(2, −4)
Original point:
(−3, 9)
Reflected point:
(−3, −9)
Important Observation
The x-coordinate stays the same.
Only the y-coordinate changes sign.
Predicting the Effect of Negative Coefficients
The general quadratic function is:
y = ax² + bx + c
The sign of the leading coefficient a determines the direction of opening.
Positive Leading Coefficient
If:
a > 0
the parabola opens upward.
Example:
y = 2x²
Negative Leading Coefficient
If:
a < 0
the parabola opens downward.
Example:
y = −2x²
Important Distinction
A negative leading coefficient tells us that the parabola opens downward.
However, a negative leading coefficient does not necessarily mean that a given quadratic is the reflection of the parent function alone.
For example:
y = −2x²
is a reflection of y = 2x² across the x-axis.
It is also a reflection and vertical stretch of y = x².
Reflections with Vertical Stretches
Consider:
y = 3x²
This parabola opens upward and is narrower than y = x².
Now consider:
y = −3x²
The negative sign reflects the graph across the x-axis.
Both graphs have the same width.
Comparison
|
Function |
Direction |
Relative width |
|---|---|---|
|
y = x² |
Up |
Parent width |
|
y = −x² |
Down |
Parent width |
|
y = 3x² |
Up |
Narrower |
|
y = −3x² |
Down |
Narrower |
|
y = 0.5x² |
Up |
Wider |
|
y = −0.5x² |
Down |
Wider |
Important Observation
The sign of a controls the direction of opening.
The magnitude |a| controls the vertical stretch or compression.
Reflections of Translated Parabolas
Reflections can also be applied to parabolas that have already been translated.
Consider:
f(x) = (x − 2)² + 3
The vertex is:
(2, 3)
Reflect the entire graph across the x-axis.
Step 1: Multiply the Function by −1
g(x) = −f(x)
Step 2: Substitute
g(x) = −[(x − 2)² + 3]
Step 3: Simplify
g(x) = −(x − 2)² − 3
New Vertex
(2, −3)
Interpretation
The original vertex (2, 3) reflects to (2, −3).
The parabola now opens downward.
Important Observation
When reflecting a translated quadratic across the x-axis, both the squared term and the vertical constant must change sign.
Reflections in Vertex Form
A quadratic function in vertex form is:
y = a(x − h)² + k
Its vertex is:
(h, k)
Reflecting across the x-axis gives:
y = −a(x − h)² − k
What Changes?
-
The sign of a changes.
-
The sign of k changes.
-
The x-coordinate h remains unchanged.
-
The direction of opening reverses.
Example
Original:
y = 2(x + 4)² − 5
Vertex:
(−4, −5)
Reflected:
y = −2(x + 4)² + 5
New vertex:
(−4, 5)
Reflections in Standard Form
Consider:
f(x) = 2x² − 6x + 4
Reflect across the x-axis.
Step 1: Multiply by −1
g(x) = −f(x)
Step 2: Distribute
g(x) = −(2x² − 6x + 4)
Step 3: Simplify
g(x) = −2x² + 6x − 4
Important Observation
When reflecting an entire quadratic function across the x-axis, every term changes sign.
It is not enough to change only the sign of the x² term.
Reflections and the Vertex
The vertex is the maximum or minimum point of a parabola.
Upward-Opening Parabola
For:
y = (x − 3)² + 2
Vertex:
(3, 2)
The vertex is a minimum.
Reflected Parabola
For:
y = −(x − 3)² − 2
Vertex:
(3, −2)
The vertex is a maximum.
Comparison
|
Property |
Original |
Reflected |
|---|---|---|
|
Vertex |
(3, 2) |
(3, −2) |
|
Axis of symmetry |
x = 3 |
x = 3 |
|
Opens |
Up |
Down |
|
Extremum |
Minimum |
Maximum |
|
Range |
y ≥ 2 |
y ≤ −2 |
Important Observation
The x-coordinate of the vertex remains unchanged.
The y-coordinate changes sign.
Reflections and the Axis of Symmetry
A reflection across the x-axis does not change the axis of symmetry.
Consider:
y = (x − 5)² + 4
Axis of symmetry:
x = 5
Reflected function:
y = −(x − 5)² − 4
Axis of symmetry:
x = 5
Why?
Reflection across the x-axis changes vertical positions but not horizontal positions.
The parabola remains symmetric about the same vertical line.
Reflections and the Range
A reflection across the x-axis reverses the direction of opening and changes the range.
Example
Original function:
y = x² + 4
Minimum value:
4
Range:
y ≥ 4
Reflected function:
y = −x² − 4
Maximum value:
−4
Range:
y ≤ −4
Important Observation
A minimum becomes a maximum after reflection.
A maximum becomes a minimum.
Reflections and Intercepts
Reflections affect x-intercepts and y-intercepts differently.
x-Intercepts
Points on the x-axis have y = 0.
Reflecting them across the x-axis leaves them unchanged.
Therefore, the x-intercepts of a function and its reflection across the x-axis are identical.
Example
Original:
y = x² − 4
x-intercepts:
(−2, 0) and (2, 0)
Reflected:
y = −x² + 4
x-intercepts:
(−2, 0) and (2, 0)
y-Intercepts
The y-intercept changes sign.
Original:
y = x² − 4
y-intercept:
(0, −4)
Reflected:
y = −x² + 4
y-intercept:
(0, 4)
Reflections Compared with Translations
Reflections and translations are different transformations.
Reflection
Changes the orientation of the graph.
Example:
y = −x²
Vertical Translation
Moves the graph up or down.
Example:
y = x² + 4
Horizontal Translation
Moves the graph left or right.
Example:
y = (x − 3)²
Comparison
|
Transformation |
Function |
Effect |
|---|---|---|
|
Parent |
y = x² |
Opens upward |
|
Reflection |
y = −x² |
Opens downward |
|
Vertical translation |
y = x² + 4 |
Up 4 |
|
Horizontal translation |
y = (x − 3)² |
Right 3 |
|
Reflection and translation |
y = −(x − 3)² + 4 |
Downward-opening parabola with vertex (3, 4) |
Important Observation
Multiple transformations can be combined in a single quadratic equation.
Combining Reflections and Translations
Consider:
y = −(x − 2)² + 5
Starting from the parent function y = x²:
-
Reflect across the x-axis.
-
Translate two units right.
-
Translate five units up.
Characteristics
-
Vertex: (2, 5)
-
Axis of symmetry: x = 2
-
Opens downward
-
Maximum value: 5
-
Range: y ≤ 5
Important Observation
The negative sign reflects the graph.
The expression (x − 2) moves it right.
The +5 moves it upward.
Real-World Application: Projectile Motion
Quadratic functions are commonly used to model projectile motion.

Example
The height of a ball is modelled by:
h(t) = −5t² + 20t
where:
-
h = height in metres.
-
t = time in seconds.
The negative coefficient means the parabola opens downward.
Why?
Gravity causes the ball to rise, slow down, reach a maximum height, and then fall.
The graph has a maximum point rather than a minimum point.
Finding the Maximum Height
Complete the square:
h(t) = −5(t² − 4t)
h(t) = −5[(t − 2)² − 4]
h(t) = −5(t − 2)² + 20
Vertex
(2, 20)
The ball reaches a maximum height of 20 metres after two seconds.
Important Observation
Downward-opening parabolas are useful for modelling situations involving maximum values.
Real-World Application: Business Profit
Quadratic functions can model profit relationships.
Example
A company's profit is modelled by:
P(x) = −2(x − 10)² + 200
The parabola opens downward.
The vertex is:
(10, 200)
Interpretation
The maximum profit is 200 units when x = 10.
The negative leading coefficient indicates that profit decreases when production moves away from the optimal quantity in this model.
Important Observation
Reflected parabolas can represent maximum values in business and economics.
Real-World Application: Engineering Design
Parabolic arches and structures can be modelled using quadratic functions.

Example
An arch is modelled by:
y = −0.5x² + 8
The negative coefficient means the arch opens downward.
The vertex is:
(0, 8)
This represents the highest point of the arch.
Comparison
The function:
y = 0.5x² − 8
is the reflection of the original function across the x-axis.
Its vertex is:
(0, −8)
It opens upward.
Important Observation
The sign of the leading coefficient helps distinguish between upward-opening and downward-opening parabolic shapes.
Common Mistakes
Changing only the sign of the x² term
When reflecting an entire function, every output must be multiplied by −1.
Confusing reflections with translations
A reflection changes orientation, while a translation changes position.
Assuming the vertex always stays unchanged
The vertex stays unchanged only if it lies on the x-axis.
Changing x-coordinates instead of y-coordinates
Reflection across the x-axis follows (x, y) → (x, −y).
Assuming a negative coefficient always means a reflection of y = x² alone
A coefficient such as −3 also represents a vertical stretch.
Confusing the sign and magnitude of a
The sign determines the direction of opening.
The magnitude determines the vertical scale.
Forgetting that x-intercepts remain unchanged
Points on the x-axis are unaffected by reflection across the x-axis.
Confusing maximum and minimum values
An upward-opening parabola has a minimum.
A downward-opening parabola has a maximum.
Incorrectly reflecting vertex form
For y = a(x − h)² + k, the reflected function is y = −a(x − h)² − k.
Assuming reflections change the axis of symmetry
Reflection across the x-axis preserves the vertical axis of symmetry.
Key Terms
-
Reflection: Transformation producing a mirror image across a line.
-
x-Axis Reflection: Reflection that changes every y-coordinate to its opposite.
-
Transformation: Change in the position, size, or orientation of a graph.
-
Parent Function: Simplest function in a family of related functions.
-
Quadratic Function: Function whose highest variable power is two.
-
Parabola: Graph of a quadratic function.
-
Vertex: Maximum or minimum point of a parabola.
-
Axis of Symmetry: Line dividing a parabola into two matching halves.
-
Leading Coefficient: Coefficient of the x² term.
-
Direction of Opening: Whether a parabola opens upward or downward.
-
Vertical Stretch: Transformation that increases vertical distances from the x-axis.
-
Vertical Compression: Transformation that decreases vertical distances from the x-axis.
-
Vertex Form: Quadratic written as y = a(x − h)² + k.
-
Standard Form: Quadratic written as y = ax² + bx + c.
-
Minimum Value: Lowest value of a function.
-
Maximum Value: Highest value of a function.
-
Domain: Set of possible input values.
-
Range: Set of possible output values.
-
x-Intercept: Point where a graph crosses or touches the x-axis.
-
y-Intercept: Point where a graph crosses the y-axis.
-
Corresponding Points: Points related by a transformation.
-
Function Notation: Representation of functions using symbols such as f(x).
-
Quadratic Model: Quadratic function used to represent a real-world relationship.
Key Takeaways
-
A reflection across the x-axis changes every y-coordinate to its opposite.
-
The transformation rule is (x, y) → (x, −y).
-
In function notation, the reflection is g(x) = −f(x).
-
A positive leading coefficient produces an upward-opening parabola.
-
A negative leading coefficient produces a downward-opening parabola.
-
Reflections reverse the direction of opening.
-
Reflections preserve the width of a parabola when only the sign changes.
-
The vertex x-coordinate remains unchanged.
-
The vertex y-coordinate changes sign.
-
The axis of symmetry remains unchanged.
-
The x-intercepts remain unchanged.
-
The y-intercept changes sign.
-
A minimum becomes a maximum after reflection.
-
Reflections can be combined with translations and stretches.
-
Reflected quadratic functions are useful for modelling maximum values.
Check Your Understanding
Identifying Reflections
-
Describe the transformation from y = x² to y = −x².
-
What happens to the point (3, 9) when reflected across the x-axis?
-
What happens to the point (−2, −5) when reflected across the x-axis?
-
Does reflection across the x-axis change x-coordinates?
-
Does reflection across the x-axis change the width of a parabola?
Negative Coefficients
-
Does y = −3x² open upward or downward?
-
Compare the directions of opening of y = 2x² and y = −2x².
-
What does the negative sign in y = −0.5x² indicate?
-
Explain the difference between y = −x² and y = −4x².
-
What is the effect of multiplying an entire quadratic function by −1?
Reflecting Equations
-
Reflect y = x² + 3 across the x-axis.
-
Reflect y = 2x² − 4x + 1 across the x-axis.
-
Reflect y = (x − 3)² + 5 across the x-axis.
-
Reflect y = −2(x + 1)² − 4 across the x-axis.
-
Write the general function rule for reflection across the x-axis.
Comparing Graphs
-
Compare the vertices of y = x² + 4 and y = −x² − 4.
-
Find the range of y = −(x − 2)² + 6.
-
Explain why x-intercepts remain unchanged under reflection across the x-axis.
-
Determine the axis of symmetry of y = −3(x + 4)² + 2.
-
Describe one real-world application of a downward-opening parabola.
Answer Key
|
Question |
Answer |
|---|---|
|
1 |
Reflection across the x-axis |
|
2 |
(3, −9) |
|
3 |
(−2, 5) |
|
4 |
No |
|
5 |
No |
|
6 |
Downward |
|
7 |
First opens upward; second opens downward |
|
8 |
Reflection across the x-axis |
|
9 |
Both open downward; y = −4x² is narrower |
|
10 |
Reflects the graph across the x-axis |
|
11 |
y = −x² − 3 |
|
12 |
y = −2x² + 4x − 1 |
|
13 |
y = −(x − 3)² − 5 |
|
14 |
y = 2(x + 1)² + 4 |
|
15 |
g(x) = −f(x) |
|
16 |
(0, 4) and (0, −4) |
|
17 |
y ≤ 6 |
|
18 |
Their y-coordinates are zero |
|
19 |
x = −4 |
|
20 |
Projectile motion, profit optimisation, or a parabolic arch |
Extended Challenge
Identifying Reflections
-
Reflect the point (5, −7) across the x-axis.
-
Reflect the point (−4, 12) across the x-axis.
-
Explain why points on the x-axis remain unchanged.
-
Describe how reflection affects the vertex of a parabola.
-
Explain why reflection across the x-axis preserves the axis of symmetry.
Reflecting Functions
-
Reflect y = 3x² + 2x − 5 across the x-axis.
-
Reflect y = −4x² + 8x + 1 across the x-axis.
-
Reflect y = 2(x − 5)² + 3 across the x-axis.
-
Reflect y = −3(x + 2)² − 7 across the x-axis.
-
Explain how to reflect a quadratic function written in standard form.
Comparing Graphs
-
Compare y = 2x² − 8 and y = −2x² + 8.
-
Determine the vertices of both functions.
-
Determine the ranges of both functions.
-
Determine their x-intercepts.
-
Explain why their x-intercepts are identical.
Applications
-
A projectile follows h(t) = −5t² + 20t. Determine the vertex and interpret it.
-
A profit model is P(x) = −2(x − 10)² + 200. Explain why the graph opens downward.
-
A parabolic arch is described by y = −0.25x² + 12. Determine its maximum height.
-
Explain why downward-opening parabolas are useful for modelling maximum values.
-
Describe how reflections can be combined with translations in real-world models.
Final Investigation: Comparing Reflected Parabolas
Consider the following functions:
Function A: y = x²
Function B: y = −x²
Function C: y = 2x² + 4
Function D: y = −2x² − 4
Function E: y = −(x − 3)² + 5
Complete the investigation.
-
Identify the parent quadratic function.
-
Describe the transformation from A to B.
-
Determine the vertex of each function.
-
Determine the axis of symmetry of each function.
-
Identify which functions open upward.
-
Identify which functions open downward.
-
Create a table of values for Function A using x = −2, −1, 0, 1, 2.
-
Create a corresponding table for Function B.
-
Explain how the y-values of A and B are related.
-
Graph Functions A and B on the same coordinate grid.
-
Describe the relationship between Functions C and D.
-
Determine the ranges of C and D.
-
Determine the x-intercepts of C and D.
-
Explain why their x-intercepts are identical.
-
Determine the vertex of Function E.
-
Identify the transformations from y = x² to Function E.
-
Graph Function E.
-
Explain why Function E has a maximum rather than a minimum.
-
Write the general rule for reflection across the x-axis.
-
Write a conclusion explaining how reflections affect quadratic graphs and how negative coefficients can be used to predict their behaviour.