Understanding Quadratic Functions
5. Graphing Quadratic Functions
Learning outcomes
- I can create a table of values.
- I can plot points accurately.
- I can sketch quadratic graphs.
- I can identify important features while graphing.
- I can verify whether a graph is reasonable.
Why graph a quadratic function?
An equation describes a relationship using algebra. A graph makes that relationship visible.
Graphing a quadratic helps us identify:
- Where the function increases or decreases.
- Its maximum or minimum value.
- Where the graph meets the coordinate axes.
- Its symmetry.
- Its domain and range.
A quadratic function has the form:
y = ax² + bx + c, where a ≠ 0
Its graph is a parabola: a smooth curve with one turning point.
- If a > 0, the parabola opens upwards.
- If a < 0, the parabola opens downwards.
A table of values provides points on the curve. The equation’s other features help us connect those points correctly.
Creating a table of values
A table of values lists selected inputs and their corresponding outputs.
To create one:
- Choose suitable x-values.
- Substitute each x-value into the equation.
- Calculate the corresponding y-value.
- Record each pair as a point (x, y).
Choose values on both sides of the vertex whenever possible. This shows both branches of the parabola and makes its symmetry easier to recognize.
Worked example
Create a table for:
y = x² − 4x + 1
For this quadratic, the vertex’s x-coordinate is:
x = −b / (2a)
x = −(−4) / (2 × 1)
x = 2
Choose x-values from −1 to 5, centred around x = 2.
| x | Substitution | y |
|---|---|---|
| −1 | (−1)² − 4(−1) + 1 | 6 |
| 0 | 0² − 4(0) + 1 | 1 |
| 1 | 1² − 4(1) + 1 | −2 |
| 2 | 2² − 4(2) + 1 | −3 |
| 3 | 3² − 4(3) + 1 | −2 |
| 4 | 4² − 4(4) + 1 | 1 |
| 5 | 5² − 4(5) + 1 | 6 |
The points are:
(−1, 6), (0, 1), (1, −2), (2, −3), (3, −2), (4, 1), (5, 6)
Notice the matching outputs on either side of x = 2:
- x = 1 and x = 3 both give y = −2.
- x = 0 and x = 4 both give y = 1.
- x = −1 and x = 5 both give y = 6.
These pairs reveal the graph’s symmetry.
Substituting negative numbers correctly
Negative inputs are a common source of calculation errors. Use brackets when substituting them.
For x = −1:
y = (−1)² − 4(−1) + 1
y = 1 + 4 + 1
y = 6
Two important rules are involved:
- Squaring a negative number gives a positive result: (−1)² = 1.
- Multiplying two negative numbers gives a positive result: −4 × −1 = 4.
Also distinguish between:
(−2)² = 4
and:
−2² = −4
In the second expression, the exponent is applied before the negative sign. On a calculator, brackets make your intended input clear.
Choosing an appropriate scale
Before plotting, inspect the smallest and largest values in your table.
For the example:
- x-values run from −1 to 5.
- y-values run from −3 to 6.
Choose axes that comfortably include these points and leave space around the vertex.
A clear graph should have:
- A labelled horizontal x-axis and vertical y-axis.
- Evenly spaced numerical intervals on each axis.
- A scale that uses the available space effectively.
- Units where quantities represent measurements.
- The function’s equation as a title or label.
The two axes may use different scales. However, the scale must remain consistent along each individual axis.
For example, one square could represent 1 unit horizontally and 2 units vertically. Label this clearly.
Plotting points accurately
Coordinates are written in the order:
(x, y)
Start at the origin, move horizontally according to x, and then vertically according to y.
For example:
- (−1, 6): Move 1 unit left and 6 units up.
- (1, −2): Move 1 unit right and 2 units down.
- (2, −3): Move 2 units right and 3 units down.
Use small dots or crosses so that the position of each point is clear.
After plotting, compare each point with its table entry. Reversing the coordinates of a point changes its location.
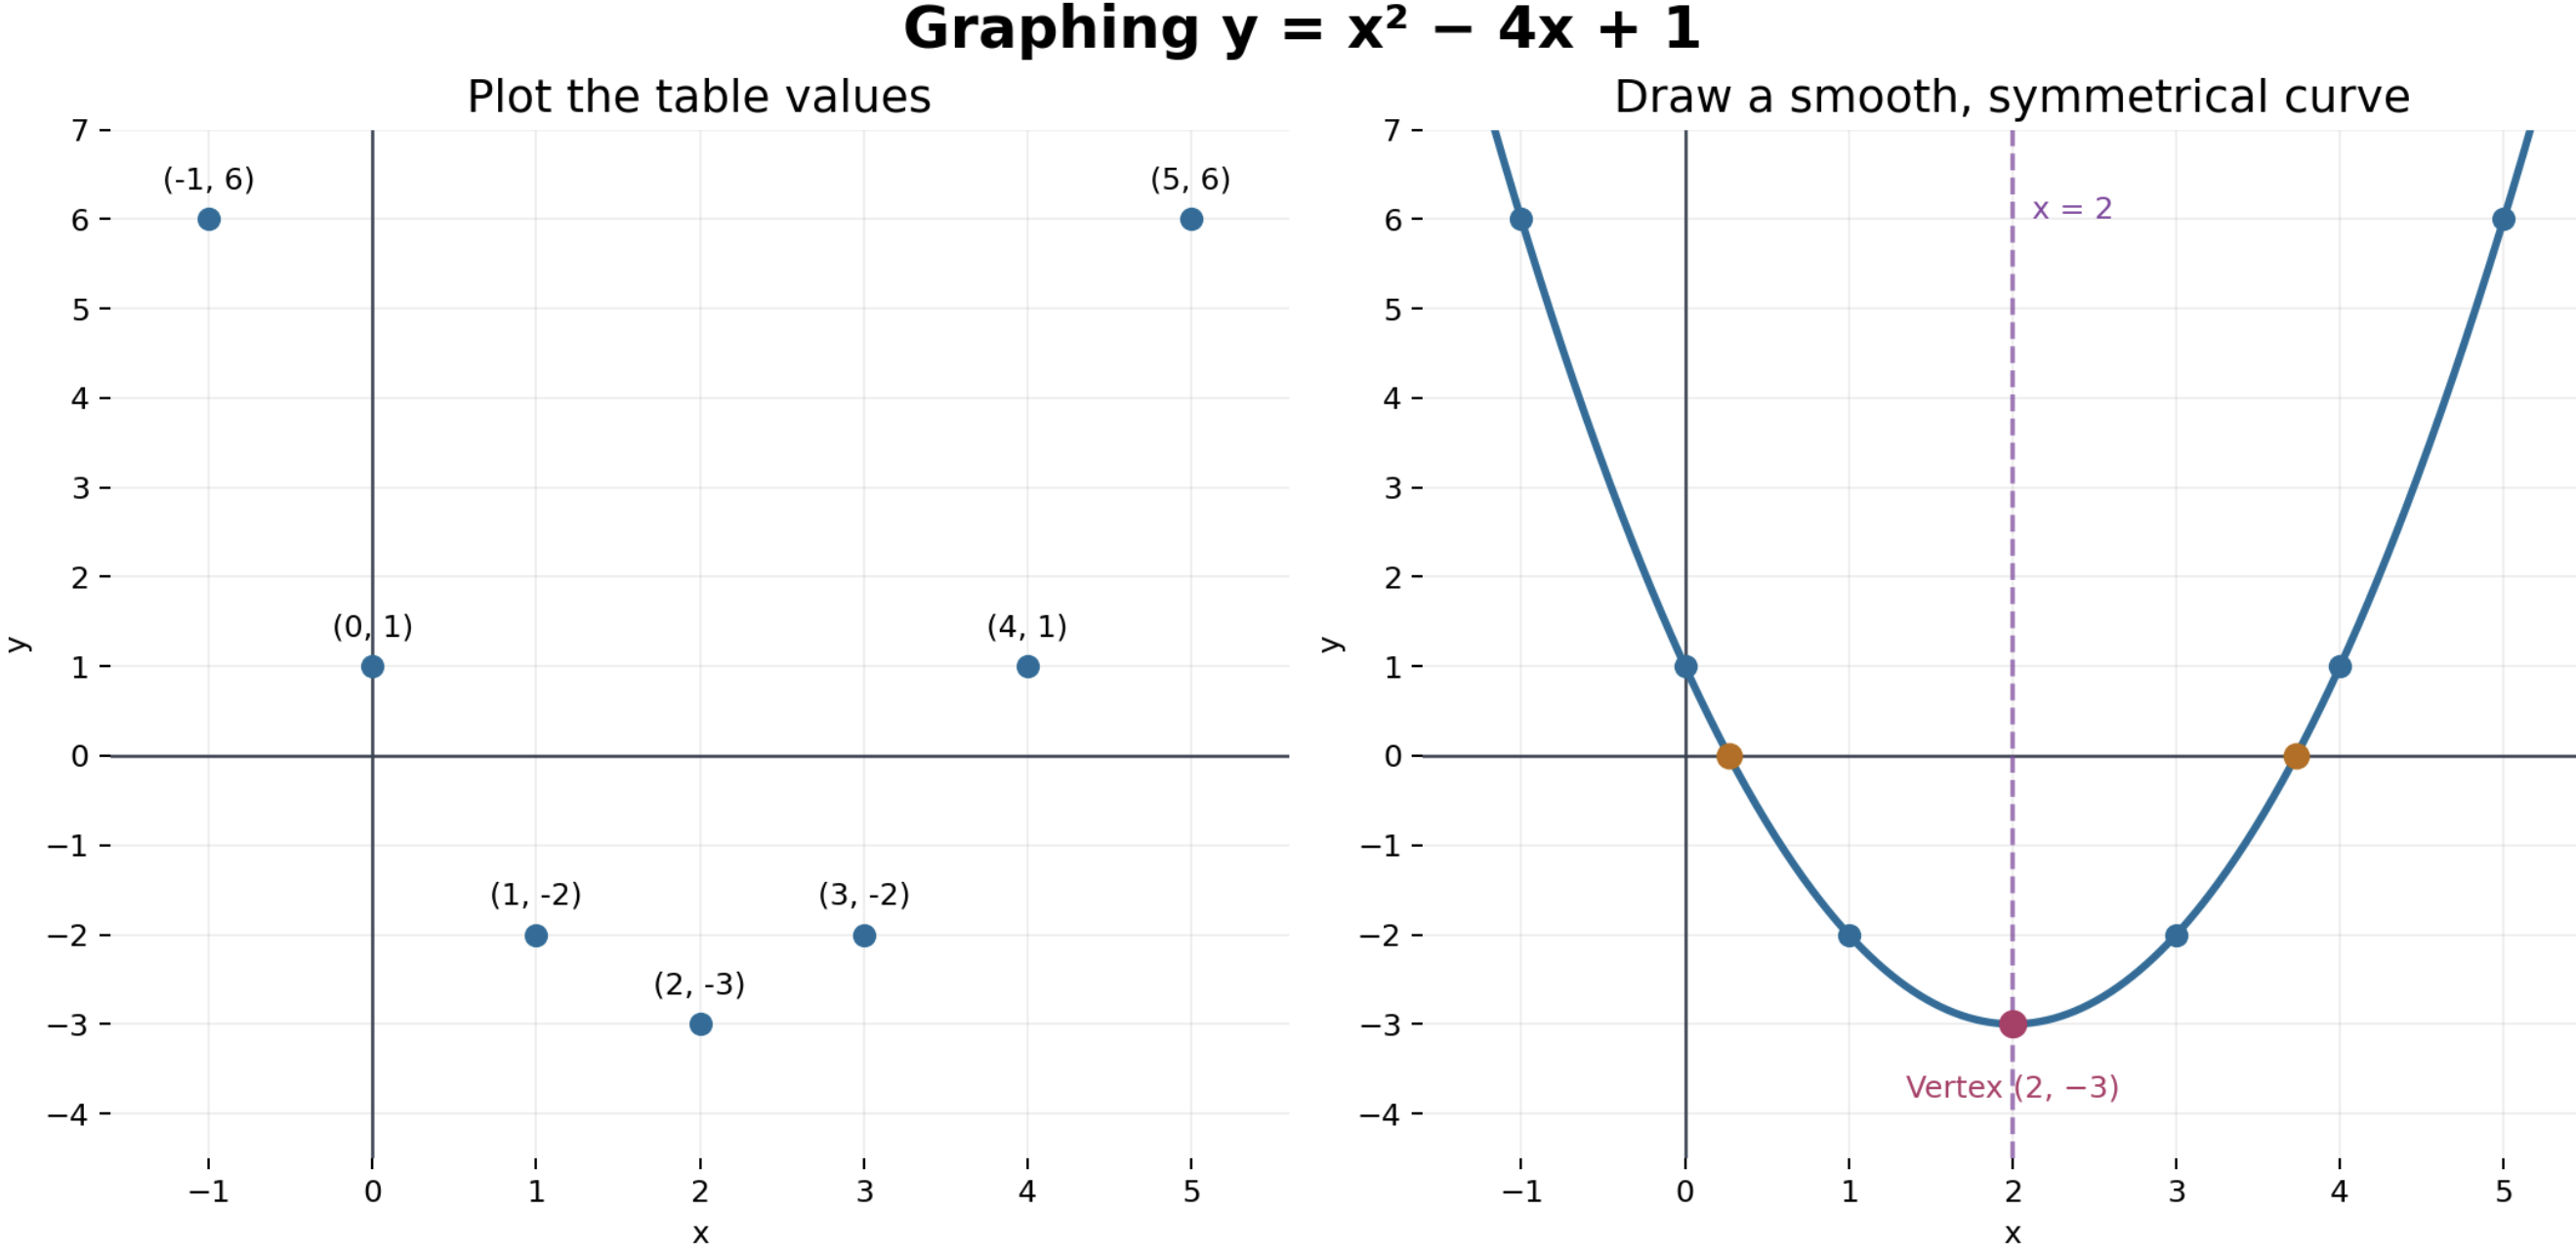
The left graph shows the table values. The right graph shows the smooth parabola through them, with its vertex in pink, axis of symmetry dashed, and x-intercepts in orange.
Drawing the parabola
Once the points are plotted, draw a smooth curve through them.
A quadratic graph should:
- Have one rounded turning point.
- Be symmetrical about a vertical line.
- Pass through the correctly calculated points.
- Continue smoothly on both sides.
Do not join consecutive points with straight line segments. This produces corners that do not belong to a parabola.
The table contains only a selection of points. The curve also contains the points for inputs between those listed.
For example, when x = 1.5:
y = 1.5² − 4(1.5) + 1
y = 2.25 − 6 + 1
y = −2.75
Therefore, (1.5, −2.75) lies on the curve between the plotted points (1, −2) and (2, −3).
Unless a domain restriction is given, continue the curve towards the edges of the graph and use arrows to indicate that it extends further.
Identifying important features
For the function:
y = x² − 4x + 1
we can identify several features while graphing.
Opening direction
The coefficient of x² is positive, so the parabola opens upwards.
Vertex
The lowest point is:
(2, −3)
This is the vertex, and the minimum output is −3.
Axis of symmetry
The vertical line through the vertex is:
x = 2
Write the axis of symmetry as an equation, rather than simply “2.”
y-intercept
Set x = 0:
y = 1
The y-intercept is (0, 1).
x-intercepts
Set y = 0:
x² − 4x + 1 = 0
Using the quadratic formula:
x = [4 ± √(16 − 4)] / 2
x = 2 ± √3
The x-intercepts are approximately:
(0.268, 0) and (3.732, 0)
These intercepts occur between the integer inputs in the table. A table does not need to contain an output of exactly zero for the graph to cross the x-axis.
Domain and range
For the complete quadratic:
- Domain: (−∞, ∞)
- Range: [−3, ∞)
Using symmetry to make graphing more efficient
Points the same horizontal distance from the axis of symmetry have the same y-coordinate.
For a parabola with axis x = 2:
- The reflection of (0, 1) is (4, 1).
- The reflection of (1, −2) is (3, −2).
- The reflection of (−1, 6) is (5, 6).
Once you know the axis of symmetry, you can calculate points on one side and reflect them to the other.
This also provides a useful check. If two inputs are equally far from the symmetry axis but your calculated outputs differ, recheck your arithmetic.
Graphing a downward-opening quadratic
Worked example
Sketch:
y = −x² + 2x + 3
Find the vertex’s x-coordinate:
x = −2 / [2(−1)]
x = 1
Choose inputs around x = 1.
| x | −2 | −1 | 0 | 1 | 2 | 3 | 4 |
|---|---|---|---|---|---|---|---|
| y | −5 | 0 | 3 | 4 | 3 | 0 | −5 |
The table reveals:
- Vertex: (1, 4).
- Axis of symmetry: x = 1.
- y-intercept: (0, 3).
- x-intercepts: (−1, 0) and (3, 0).
Because the coefficient of x² is negative, the graph opens downwards. Draw a smooth curve rising to the maximum at (1, 4), then falling symmetrically.
For the complete function:
- Domain: (−∞, ∞)
- Range: (−∞, 4]
When integer inputs miss the vertex
A table using only whole-number inputs may not include the exact turning point.
Consider:
y = x² − 3x + 1
The vertex’s x-coordinate is:
x = −(−3) / (2 × 1)
x = 1.5
A table gives y = −1 at both x = 1 and x = 2. Neither point is the vertex.
Calculate the output halfway between them:
y = 1.5² − 3(1.5) + 1
y = 2.25 − 4.5 + 1
y = −1.25
The vertex is (1.5, −1.25).
Add this point to the table before drawing the curve. Otherwise, you might accidentally draw a flat bottom or place the minimum too high.
Checking whether a graph is reasonable
A finished graph should agree with both the table and the equation.
Check the opening direction.
- Positive a: opens upwards.
- Negative a: opens downwards.
Check the y-intercept.
For y = ax² + bx + c, the graph must pass through (0, c).
Check the vertex and symmetry.
The turning point should lie on:
x = −b / (2a)
The two sides should be mirror images across this line.
Check the intercepts.
Any calculated real roots should match the points where the curve meets the x-axis.
Check an additional point.
Choose an input not used in the original table, calculate its output and see whether it lies on the drawn curve.
Check the shape.
A quadratic should have a smooth turn. It should not contain corners, loops or several turning points.
Check the domain and context.
If the question restricts the inputs, show only the required portion of the graph.
Example of spotting an error
A student sketches y = x² − 4x + 1 opening downwards with vertex (2, 3).
Two checks reveal problems:
- The positive coefficient of x² requires an upward-opening curve.
- Substituting x = 2 gives y = −3, so the vertex should be (2, −3).
These checks identify the errors without recalculating the entire table.
Using graphing technology
A graphing calculator or graphing application can help verify a hand-drawn graph.
Enter the equation carefully, then choose a viewing window that includes:
- The vertex.
- The y-intercept where useful.
- Any x-intercepts.
- Enough of both branches to show the shape.
A poor viewing window can hide important features. For example, a window showing only one branch may make a parabola appear almost straight.
Use the table or point-evaluation feature to compare several outputs with your calculations. Technology is most useful when you can explain why the displayed graph makes sense.
Real-world connection: graphing a ball’s flight
A simplified model gives the height of a ball as:
h = −5t² + 20t
Here, h is height in metres and t is time in seconds after launch.
| Time, t (s) | 0 | 1 | 2 | 3 | 4 |
|---|---|---|---|---|---|
| Height, h (m) | 0 | 15 | 20 | 15 | 0 |
Plot time on the horizontal axis and height on the vertical axis.
The graph shows:
- The ball starts at ground level.
- It reaches a maximum height of 20 m after 2 s.
- It returns to ground level after 4 s.
For the flight, use the domain 0 ≤ t ≤ 4. The modelled graph stops at landing.
This is a height–time graph. It shows how height changes with time; it does not show the ball’s physical path through space.
Did you know?
For equally spaced x-values, a quadratic table has constant second differences.
For y = x² − 4x + 1, the outputs in our first table are:
6, 1, −2, −3, −2, 1, 6
Subtract consecutive outputs to find the first differences:
−5, −3, −1, 1, 3, 5
Subtract consecutive first differences:
2, 2, 2, 2, 2
The constant second difference is a useful pattern for checking a table. For x-values spaced 1 unit apart, it equals 2a.
Common misconceptions
- “A parabola is made from straight segments.” Draw a smooth curve through the points.
- “The smallest output in my table must be the minimum.” The vertex may lie between the selected inputs.
- “Every parabola is symmetrical about the y-axis.” Its axis is x = −b / (2a), which may be elsewhere.
- “No zero in the table means no x-intercepts.” Intercepts may occur between the listed inputs.
- “Five points are always enough.” Add points when needed to locate the vertex, intercepts or uncertain parts of the curve.
- “A calculator graph must show every important feature.” The viewing window may hide them.
Key terms
- Table of values: A list of selected inputs and their corresponding outputs.
- Ordered pair: A point written as (x, y).
- Scale: The numerical value represented by intervals on an axis.
- Parabola: The smooth curve representing a quadratic function.
- Vertex: The maximum or minimum point of a parabola.
- Axis of symmetry: The vertical line dividing a parabola into matching halves.
- Intercept: A point where a graph meets a coordinate axis.
- Sketch: A drawing showing a graph’s overall shape and important features.
- Viewing window: The portion of the coordinate plane displayed by graphing technology.
- Second differences: Differences between consecutive first differences in a sequence of outputs.
Key takeaways
- Create a table by substituting carefully chosen inputs into the equation.
- Include values on both sides of the vertex.
- Use brackets when substituting negative numbers.
- Label axes and use consistent scales.
- Plot coordinates accurately and draw a smooth curve.
- Identify the vertex, symmetry axis, intercepts and opening direction.
- Add extra points when the original table misses an important feature.
- Verify the graph against the equation, and respect any domain restrictions.