Applications of Sequences and Series
3. Motion and Repeated Processes
Learning outcomes
- I can identify repeated processes that can be modeled using sequences.
- I can describe patterns of change in motion-related situations.
- I can use sequences to model repeated events or actions.
- I can interpret sequence models in scientific and technological contexts.
- I can explain how mathematical patterns help predict future outcomes.
Introduction
Many events in the world occur repeatedly. A pendulum swings back and forth, a wheel completes rotations, a machine produces items in cycles, and a bouncing ball repeatedly rises and falls. Even when motion appears complicated, mathematical patterns can help us describe and predict what happens.
Consider a car travelling at a constant speed of 15 metres per second.
After one second, it has travelled 15 metres. After two seconds, it has travelled 30 metres. After three seconds, it has travelled 45 metres.
The distances form the sequence:
0, 15, 30, 45, 60, 75, ...
This is an arithmetic sequence because the distance increases by the same amount during every second.
Now consider a bouncing ball that reaches 80% of its previous maximum height after every bounce.
If its first maximum height is 2 metres, the following heights are:
2, 1.6, 1.28, 1.024, 0.8192, ...
This is a geometric sequence because each height is multiplied by 0.8.
Both situations involve motion, but they follow different mathematical patterns.
By identifying these patterns, we can construct mathematical models, calculate future values, and explain how repeated physical processes behave.
In this lesson, we will explore connections between sequences, motion, repeated events, physics, engineering, and technology.
Understanding Repeated Processes
A repeated process is an event or action that occurs more than once according to a recognisable rule.
Repeated processes may involve:
-
Equal changes during each time interval
-
Repeated multiplication by a constant
-
Cycles that repeat after fixed intervals
-
Changes that depend on previous values
-
Repeated movements or mechanical operations
-
Accumulation of distance, energy, or material
-
Gradual decreases caused by friction or energy losses
Mathematical sequences are useful because they describe quantities at separate stages of a process.
For example, a machine that produces 12 components every minute creates the cumulative production sequence:
12, 24, 36, 48, 60, ...
A rotating wheel completing five revolutions every second produces:
5, 10, 15, 20, 25, ...
Both sequences increase by a constant amount.
However, not every repeated process produces an arithmetic sequence. The mathematical model depends on how the quantity changes.
Discrete and Continuous Models
Motion usually occurs continuously, but we often record measurements at regular intervals.
For example, a car's position may be recorded every second.
|
Time (s) |
Position (m) |
|---|---|
|
0 |
0 |
|
1 |
10 |
|
2 |
20 |
|
3 |
30 |
|
4 |
40 |
These measurements form a discrete sequence.
The underlying motion may be described by a continuous function:
x(t) = 10t
where:
-
x is position in metres.
-
t is time in seconds.
At whole-number times, the function generates the sequence:
0, 10, 20, 30, 40, ...
This connection between continuous functions and discrete sequences is important in physics, engineering, and computer simulations.
A sequence model describes selected time steps, while a continuous model describes the quantity at every time within its domain.
Constant Velocity and Arithmetic Sequences
An object moving at constant velocity travels equal displacements during equal time intervals.
For motion in a straight line:
Displacement = Velocity × Time
or:
Δx = vt
If the initial position is x₀, the position after time t is:
x = x₀ + vt
When positions are measured at equal time intervals Δt, the sequence follows:
xₙ = x₀ + nvΔt
This is an arithmetic sequence because the difference between consecutive positions is constant.
Worked Example 1: A Train Moving at Constant Velocity
A train begins at position 200 m and travels east at 25 m/s.
Find its position every two seconds for the first ten seconds.
Step 1: Identify the values.
Initial position:
x₀ = 200 m
Velocity:
v = 25 m/s
Time interval:
Δt = 2 s
Step 2: Calculate the displacement during each interval.
Δx = vΔt
= 25 × 2
= 50 m
Step 3: Write the sequence.
200, 250, 300, 350, 400, 450
|
Time (s) |
Position (m) |
|---|---|
|
0 |
200 |
|
2 |
250 |
|
4 |
300 |
|
6 |
350 |
|
8 |
400 |
|
10 |
450 |
Step 4: Write an explicit rule.
xₙ = 200 + 50n
where n is the number of two-second intervals.
Step 5: Verify.
After five intervals:
x₅ = 200 + 50(5)
= 450 m
Answer: The train is at position 450 m after ten seconds.
Visualising constant velocity
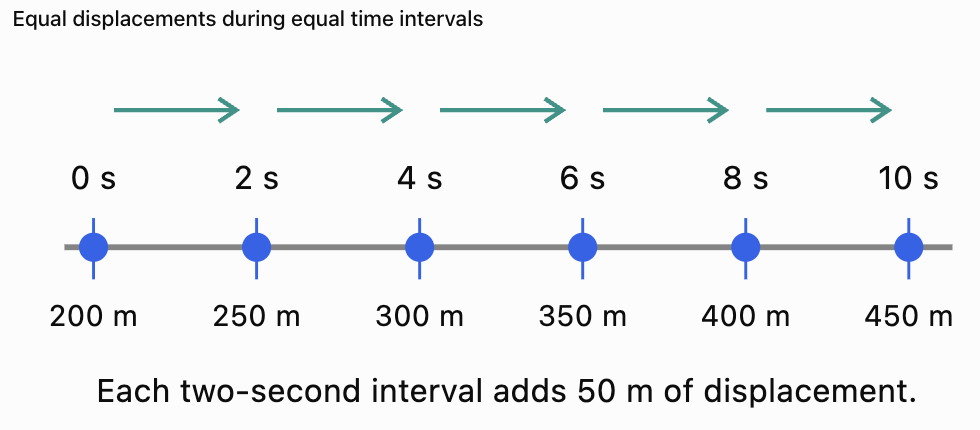
The equal spacing illustrates the constant difference between consecutive terms.
Acceleration and Quadratic Patterns
Not all objects move at constant velocity.
When an object accelerates, its velocity changes over time.
For constant acceleration:
v = u + at
where:
-
v = final velocity
-
u = initial velocity
-
a = acceleration
-
t = time
The displacement from the initial position is:
s = ut + ½at²
The term t² creates a quadratic relationship between displacement and time.
Worked Example 2: Motion from Rest
A car starts from rest and accelerates uniformly at 2 m/s².
Calculate its displacement after each of the first five seconds.
Given:
u = 0
a = 2 m/s²
Use:
s = ut + ½at²
Since u = 0:
s = ½(2)t²
s = t²
Calculate:
|
Time (s) |
Displacement (m) |
|---|---|
|
0 |
0 |
|
1 |
1 |
|
2 |
4 |
|
3 |
9 |
|
4 |
16 |
|
5 |
25 |
The sequence is:
0, 1, 4, 9, 16, 25, ...
These are square numbers.
The first differences are:
1, 3, 5, 7, 9
The second differences are:
2, 2, 2, 2
This shows that uniformly accelerated motion produces a quadratic position sequence when measured at equally spaced times.
Why do the differences increase?
The car's velocity increases by 2 m/s every second.
Therefore, it travels a greater distance during each successive second.
The sequence of distances travelled during individual seconds is:
1, 3, 5, 7, 9, ...
This is an arithmetic sequence of odd numbers.
The total displacement is the sum of these distances.
Thus:
1 + 3 + 5 + ... + (2n − 1) = n²
This connects motion, arithmetic sequences, square numbers, and algebra.
Visualising quadratic displacement
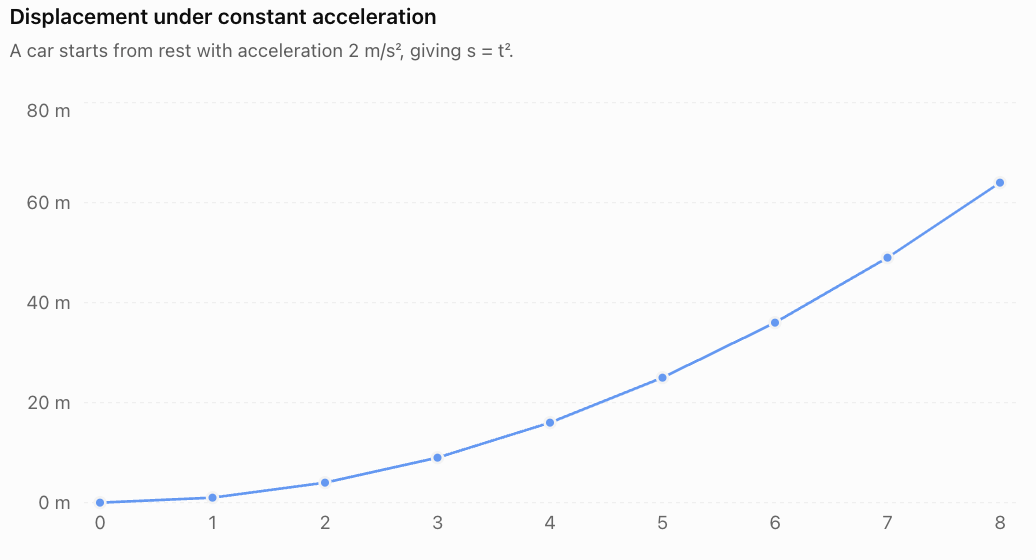
The upward-curving graph shows that displacement increases more rapidly as time passes.
Velocity as an Arithmetic Sequence
For constant acceleration:
v = u + at
At equal time intervals, the velocity increases or decreases by a constant amount.
Worked Example 3: Velocity of an Accelerating Object
A cyclist begins at 4 m/s and accelerates at 1.5 m/s².
Find the velocity after each of the first five seconds.
Use:
v = 4 + 1.5t
|
Time (s) |
Velocity (m/s) |
|---|---|
|
0 |
4.0 |
|
1 |
5.5 |
|
2 |
7.0 |
|
3 |
8.5 |
|
4 |
10.0 |
|
5 |
11.5 |
The velocity sequence is:
4, 5.5, 7, 8.5, 10, 11.5, ...
This is an arithmetic sequence with common difference 1.5.
The recursive rule is:
vₙ₊₁ = vₙ + 1.5
The explicit rule is:
vₙ = 4 + 1.5n
where n represents elapsed seconds.
This demonstrates an important distinction:
-
Velocity under constant acceleration follows an arithmetic sequence.
-
Position under constant acceleration follows a quadratic sequence.
Repeated Motion and Geometric Sequences
Some repeated processes involve multiplying a quantity by the same factor after each event.
A bouncing ball provides a useful example.
When a ball strikes the ground, some mechanical energy is dissipated through sound, heating, and deformation.
As a result, the ball generally rebounds to a lower height.
A simplified model assumes that each rebound reaches a fixed fraction of the previous maximum height.
If the rebound factor is r, then:
hₙ = h₀rⁿ
where:
-
h₀ = initial height
-
hₙ = height after n rebounds
-
r = rebound-height ratio, with 0 ≤ r < 1
Worked Example 4: Bouncing Ball
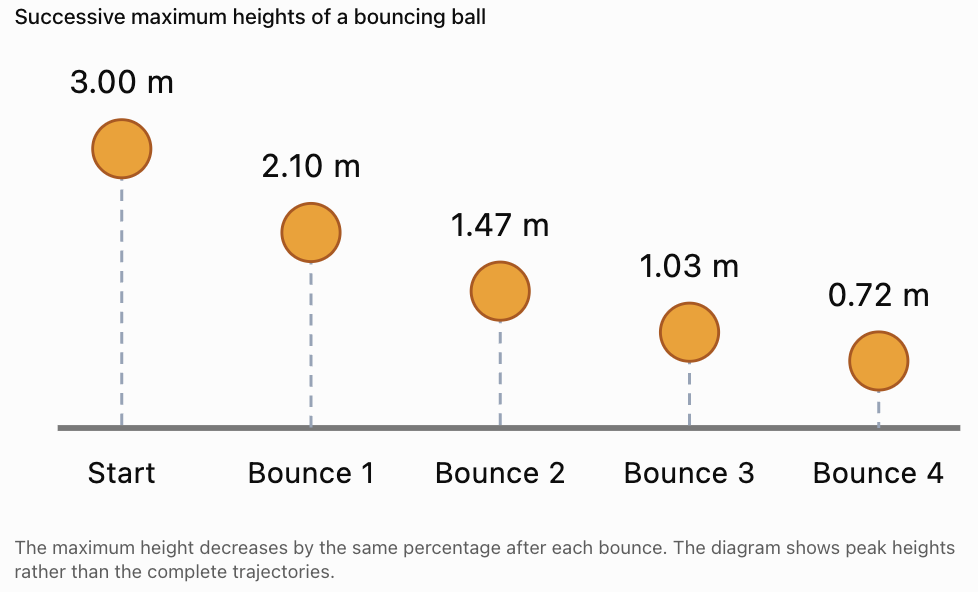
A ball is dropped from a height of 3 m.
After each bounce, it reaches 70% of its previous maximum height.
Calculate the first four rebound heights.
Initial height:
h₀ = 3 m
Rebound factor:
r = 0.70
First bounce
h₁ = 3(0.70)
= 2.10 m
Second bounce
h₂ = 3(0.70)²
= 1.47 m
Third bounce
h₃ = 3(0.70)³
= 1.029 m
Fourth bounce
h₄ = 3(0.70)⁴
= 0.7203 m
The sequence is:
3, 2.1, 1.47, 1.029, 0.7203, ...
This is a geometric sequence with common ratio 0.70.
Visualising successive bounces
Total Distance Travelled by a Bouncing Ball
Geometric sequences can also help calculate the total distance travelled during repeated bouncing.
Suppose a ball is dropped from height H and rebounds to a constant fraction r of its previous height.
The ball first travels downward through distance H.
After the first bounce, it travels upward through distance Hr and downward through another Hr.
After the second bounce, it travels upward through Hr² and downward through Hr².
The total distance is:
D = H + 2Hr + 2Hr² + 2Hr³ + ...
The geometric series is:
r + r² + r³ + ... = r/(1 − r)
for 0 ≤ r < 1.
Therefore:
D = H + 2Hr/(1 − r)
This is the total distance predicted by the idealised model over infinitely many bounces.
Worked Example 5: Total Bouncing Distance
A ball is dropped from 2 m and rebounds to 60% of its previous maximum height.
Find the total distance travelled in the idealised infinite-bounce model.
Given:
H = 2
r = 0.60
Use:
D = H + 2Hr/(1 − r)
D = 2 + [2(2)(0.60)]/(1 − 0.60)
= 2 + 2.4/0.4
= 2 + 6
Answer: 8 m
This result assumes the same rebound-height ratio for every bounce. Real balls eventually stop bouncing, and the ratio may change.
Periodic Motion and Repeating Cycles
A periodic process repeats after a fixed interval.
Examples include:
-
Pendulum oscillations
-
Wheel rotations
-
Vibrations of a spring
-
Alternating electrical signals
-
Rotating machinery
-
Repeating mechanical cycles
Two important quantities are:
Period (T): Time required for one complete cycle.
Frequency (f): Number of cycles completed per second.
Their relationship is:
f = 1/T
or:
T = 1/f
Frequency is measured in hertz (Hz).
Worked Example 6: Pendulum Oscillations
A pendulum completes one oscillation every 2.5 seconds.
Calculate:
a) Its frequency.
b) The number of complete oscillations in 60 seconds.
Part a: Frequency
f = 1/T
= 1/2.5
f = 0.4 Hz
Part b: Number of oscillations
Number of cycles = Time/Period
= 60/2.5
Answer: 24 complete oscillations
The completion times form an arithmetic sequence:
2.5, 5.0, 7.5, 10.0, 12.5, ...
The nth completion time is:
tₙ = 2.5n
This illustrates how periodic motion can be represented using arithmetic sequences.
Rotational Motion and Repeated Events
Rotating objects are particularly suitable for sequence models.
Examples include:
-
Wheels
-
Gears
-
Turbines
-
Fans
-
Motors
-
Conveyor rollers
If a wheel rotates at a constant rate, the total number of completed revolutions increases linearly with time.
Worked Example 7: Wheel Revolutions
A wheel completes 12 revolutions every second.
Calculate:
a) The number of revolutions after 5 seconds.
b) The number of revolutions after 20 seconds.
c) The general rule for the number of revolutions after t seconds.
Part a
N = 12 × 5
N = 60 revolutions
Part b
N = 12 × 20
N = 240 revolutions
Part c
N(t) = 12t
At whole-second intervals, the sequence is:
12, 24, 36, 48, 60, ...
This is an arithmetic sequence.
Connecting rotations to distance
If a wheel rolls without slipping, the distance travelled during one complete revolution equals its circumference.
Circumference:
C = 2πr
If a wheel has radius 0.35 m:
C = 2π(0.35)
= 0.7π m
After 100 revolutions:
Distance = 100(0.7π)
= 70π m
Distance ≈ 219.91 m
This connects sequences, circular geometry, and motion.
Recursive Models in Motion
A recursive model calculates a new value using a previous value.
In motion, recursive models are useful when velocity, position, or another quantity changes repeatedly.
For example:
vₙ₊₁ = vₙ + aΔt
xₙ₊₁ = xₙ + vₙΔt
These rules form a simple numerical method for modelling motion.
The second rule uses the velocity at the beginning of the time interval, so it is an approximation when the object accelerates.
This method is known as forward Euler integration.
Worked Example 8: Numerical Motion Model
An object begins with:
Initial position = 0 m
Initial velocity = 2 m/s
Acceleration = 1 m/s²
Time step = 1 s
Use:
vₙ₊₁ = vₙ + 1
xₙ₊₁ = xₙ + vₙ
Calculate the first four time steps.
|
Time (s) |
Position (m) |
Velocity (m/s) |
|---|---|---|
|
0 |
0 |
2 |
|
1 |
2 |
3 |
|
2 |
5 |
4 |
|
3 |
9 |
5 |
|
4 |
14 |
6 |
The position sequence is:
0, 2, 5, 9, 14, ...
The first differences are:
2, 3, 4, 5
The second differences are:
1, 1, 1
The position sequence is quadratic.
Comparing the numerical model with exact motion
The exact displacement after four seconds is:
s = ut + ½at²
= 2(4) + ½(1)(4²)
= 8 + 8
s = 16 m
The numerical model predicts 14 m.
The difference occurs because the model uses the velocity at the beginning of each time step and does not account for the increase in velocity within that step.
Smaller time steps generally improve the approximation for this situation.
This is an important example of how mathematical sequences are used in scientific computing.
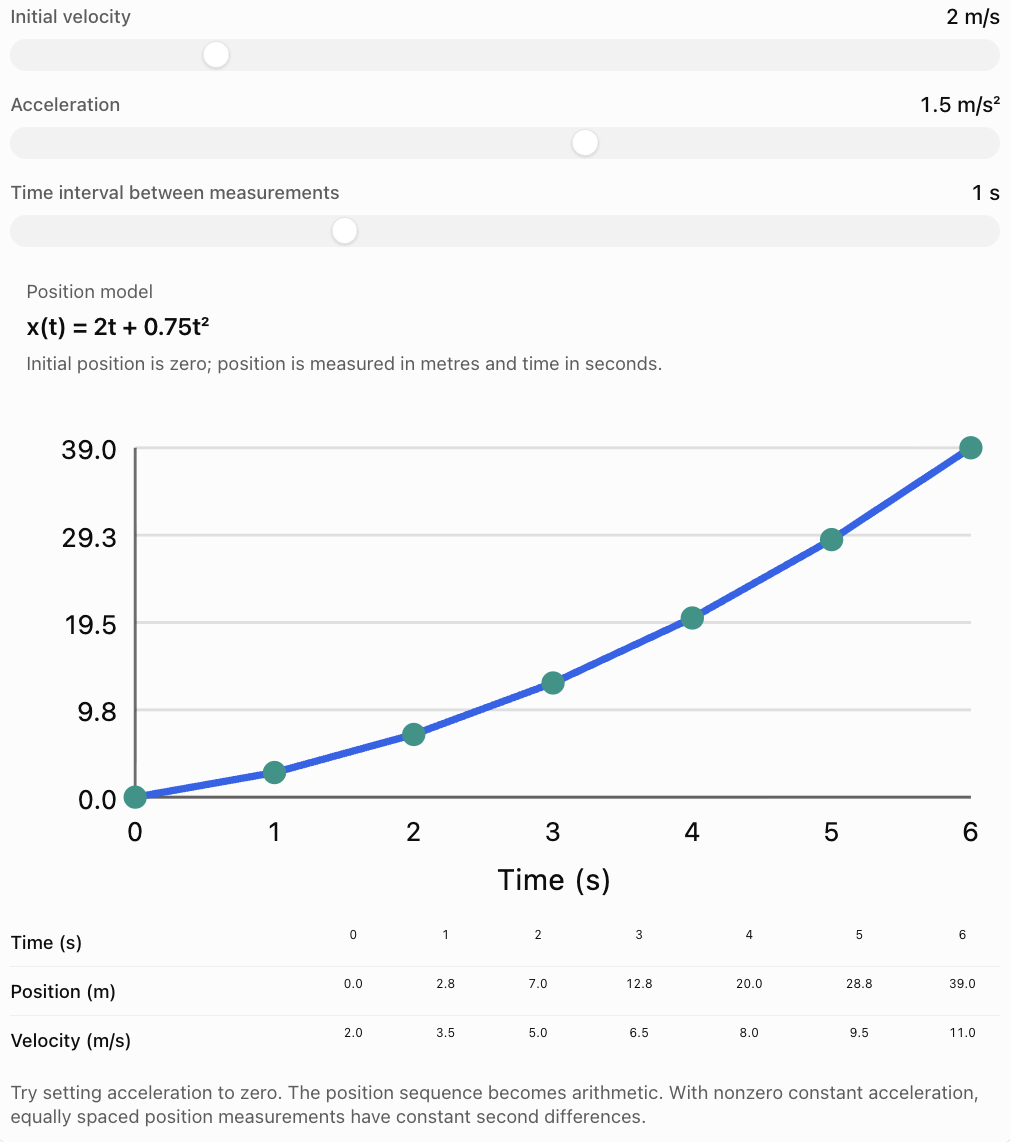
Interactive Motion Sequence Explorer
Explore how the sequence of positions changes when an object moves with different initial velocities and constant accelerations.
Repeated Processes in Technology
Mathematical sequences are widely used in technology because machines and computers frequently perform repeated operations.
1. Manufacturing systems
A machine produces 40 components every minute.
The cumulative number of components after n minutes is:
Cₙ = 40n
This is an arithmetic sequence.
2. Computer simulations
A computer repeatedly updates position and velocity using numerical rules.
For example:
vₙ₊₁ = vₙ + aΔt
xₙ₊₁ = xₙ + vₙΔt
This allows computers to approximate the motion of vehicles, projectiles, and other objects.
3. Mechanical vibrations
Machines may vibrate repeatedly.
If the amplitude decreases by a fixed factor after each cycle, the peak amplitudes may follow a geometric sequence.
4. Automated systems
Robots often perform repeated movements.
If a robotic arm moves 0.25 m during each cycle, its cumulative travel distance after n cycles is:
Dₙ = 0.25n
5. Digital signals
Computers record sound, motion, and other signals at regular time intervals.
These measurements form sequences that can be analysed mathematically.
Damped Oscillations and Geometric Decay
A vibrating system may gradually lose energy because of friction or resistance.
As a result, its amplitude may decrease over time.
A simplified discrete model is:
Aₙ = A₀rⁿ
where:
-
A₀ = initial amplitude
-
r = amplitude reduction factor
-
n = number of completed cycles
Worked Example 9: Damped Vibration
A vibrating system begins with an amplitude of 10 cm.
After each cycle, the amplitude becomes 85% of its previous value.
Calculate the amplitude after six cycles.
Given:
A₀ = 10 cm
r = 0.85
n = 6
Use:
A₆ = 10(0.85)⁶
≈ 10(0.3771495)
Answer: Approximately 3.77 cm
The sequence is:
10, 8.5, 7.225, 6.14125, ...
This is a geometric decay pattern.
Why is this useful?
Damping models are important when studying:
-
Vehicle suspension systems
-
Building vibrations
-
Mechanical springs
-
Industrial machinery
-
Measuring instruments
-
Electronic oscillators
The fixed-ratio model is an approximation. Real damping may depend on velocity, amplitude, and other physical conditions.
Repeated Processes and Cumulative Change
Some processes involve repeatedly adding quantities.
Others involve repeatedly multiplying quantities.
This distinction helps us choose the correct model.
|
Process |
Mathematical pattern |
Typical model |
|---|---|---|
|
Constant-speed motion |
Arithmetic |
xₙ = x₀ + nd |
|
Constant-acceleration velocity |
Arithmetic |
vₙ = v₀ + naΔt |
|
Constant-acceleration position |
Quadratic |
xₙ = x₀ + unΔt + ½a(nΔt)² |
|
Bouncing-ball heights |
Geometric decay |
hₙ = h₀rⁿ |
|
Constant-rate rotations |
Arithmetic |
Nₙ = kn |
|
Repeated amplitude reduction |
Geometric decay |
Aₙ = A₀rⁿ |
|
Periodic cycle completion times |
Arithmetic |
tₙ = nT |
|
Numerical motion simulation |
Recursive |
Update position and velocity each step |
Recognising the type of pattern is often the most important step in constructing a useful model.
Predicting Future Outcomes
Mathematical patterns allow us to predict values beyond the observations already collected.
However, a prediction is only as reliable as the assumptions behind the model.
Worked Example 10: Predicting Future Motion
A vehicle's position is recorded every two seconds.
The positions are:
5, 17, 29, 41, 53, ...
Find its position at the tenth measurement, counting the initial position as the first term.
Step 1: Identify the common difference.
17 − 5 = 12
29 − 17 = 12
The sequence is arithmetic.
Step 2: Write the general formula.
aₙ = a₁ + (n − 1)d
aₙ = 5 + 12(n − 1)
Step 3: Calculate the tenth term.
a₁₀ = 5 + 12(9)
= 5 + 108
Answer: 113 m
Interpreting the result
The vehicle moves 12 m every two seconds.
Therefore, its velocity is:
v = 12/2
v = 6 m/s
The prediction assumes the vehicle continues moving at constant velocity.
If the vehicle accelerates or brakes, the model will no longer accurately describe its position.
Evaluating Motion and Repeated-Process Models
Mathematical models simplify real-world processes.
This makes them useful, but it also creates limitations.
Constant velocity assumptions
A constant-velocity model ignores acceleration, braking, and changes in direction.
Constant acceleration assumptions
A constant-acceleration model assumes acceleration does not change during the time interval.
Real acceleration may vary because of friction, drag, or changing forces.
Energy losses
Bouncing-ball and vibration models may assume a constant reduction factor.
Actual energy losses can change with speed, temperature, and material properties.
Measurement errors
Recorded positions, times, and velocities may contain uncertainty.
Discrete approximations
Numerical models use finite time steps.
Large time steps may produce inaccurate predictions.
Long-term predictions
A model that describes a few cycles accurately may not remain valid indefinitely.
Physical constraints
Mathematical models must respect physical limits.
For example, a bouncing ball cannot continue bouncing indefinitely with perfectly predictable behaviour.
A good mathematical model should be tested against observations and revised when necessary.
Real-World Applications
Transportation
Motion sequences help describe vehicle positions, speeds, acceleration, travel times, and braking distances.
Robotics and automation
Repeated movement sequences help control robotic arms, conveyor systems, and automated production equipment.
Timekeeping
Periodic motion provides predictable cycles that can be counted to measure elapsed time.
Engineering
Damped oscillation models help engineers investigate vibrations, suspension systems, and mechanical stability.
Computer modelling
Recursive sequences allow computers to simulate motion by repeatedly updating quantities such as position and velocity.
Common Mistakes
Mistake 1: Assuming every repeated process is arithmetic
Some repeated processes are geometric, quadratic, periodic, or recursive.
Mistake 2: Confusing distance and displacement
Distance measures total path length, while displacement measures the change in position.
Mistake 3: Confusing constant velocity with constant acceleration
Constant velocity means velocity does not change. Constant acceleration means velocity changes at a constant rate.
Mistake 4: Assuming position and velocity follow the same sequence
Under constant acceleration, velocity is arithmetic at equal time intervals, while position is quadratic.
Mistake 5: Using the wrong common ratio
A 20% reduction corresponds to a multiplier of 0.80, not 0.20.
Mistake 6: Confusing period and frequency
Period is time per cycle. Frequency is cycles per second.
Mistake 7: Forgetting the initial value
A recursive model requires a starting position, velocity, amplitude, or other initial quantity.
Mistake 8: Ignoring units
Position, velocity, acceleration, time, and frequency have different units.
Mistake 9: Assuming a numerical approximation is exact
Recursive numerical methods may introduce approximation errors.
Mistake 10: Extending a model beyond realistic conditions
A mathematical rule may no longer describe a physical process after conditions change.
Mistake 11: Confusing cumulative distance with distance per cycle
A sequence of total distances may follow a different pattern from the distances travelled during individual cycles.
Mistake 12: Assuming a prediction is guaranteed
Predictions depend on the accuracy of the model and its assumptions.
Key Terms
-
Motion: Change in position over time.
-
Repeated Process: Event or action occurring multiple times according to a rule.
-
Sequence: Ordered list of values.
-
Arithmetic Sequence: Sequence with a constant difference between consecutive terms.
-
Geometric Sequence: Sequence with a constant ratio between consecutive terms.
-
Quadratic Sequence: Sequence described by a quadratic expression.
-
Recursive Rule: Rule calculating a term from previous terms.
-
Explicit Formula: Formula calculating a term directly from its position.
-
Discrete Model: Model describing values at separate points or time steps.
-
Continuous Model: Model describing quantities continuously over an interval.
-
Position: Location of an object relative to a reference point.
-
Displacement: Change in position.
-
Distance: Total length of the path travelled.
-
Velocity: Rate of change of displacement.
-
Speed: Rate at which distance is travelled.
-
Acceleration: Rate of change of velocity.
-
Constant Velocity: Motion with unchanged velocity.
-
Constant Acceleration: Motion with a constant rate of change of velocity.
-
Periodic Motion: Motion that repeats after equal time intervals.
-
Period: Time required for one complete cycle.
-
Frequency: Number of cycles completed per second.
-
Oscillation: Repeated movement around an equilibrium position.
-
Amplitude: Maximum displacement from equilibrium.
-
Damping: Reduction in oscillation amplitude caused by energy losses.
-
Rebound Factor: Ratio between consecutive rebound heights.
-
Rotation: Turning movement around an axis.
-
Revolution: One complete rotation.
-
Circumference: Distance around a circle.
-
Numerical Model: Model using numerical calculations to approximate a process.
-
Time Step: Interval between successive calculations or measurements.
-
Prediction: Estimated future outcome based on a model.
-
Extrapolation: Using a model to predict beyond observed values.
-
Mathematical Simulation: Computational representation of a process using mathematical rules.
-
Model Limitation: Condition restricting the accuracy or usefulness of a model.
Key Takeaways
-
Repeated processes occur in motion, engineering, technology, and many natural systems.
-
Mathematical sequences describe quantities measured at successive stages.
-
Constant velocity produces an arithmetic position sequence at equal time intervals.
-
Constant acceleration produces an arithmetic velocity sequence.
-
Constant acceleration produces a quadratic position sequence.
-
Repeated percentage reductions produce geometric decay sequences.
-
Bouncing-ball heights can be modelled using geometric sequences.
-
Periodic motion repeats after a fixed time interval.
-
Frequency and period are reciprocals.
-
Constant-rate rotations can be represented using arithmetic sequences.
-
Recursive rules are useful for modelling motion step by step.
-
Numerical models approximate continuous motion using discrete calculations.
-
Mathematical patterns help predict future positions, velocities, amplitudes, and event counts.
-
Real-world models depend on assumptions that must be evaluated.
-
Recognising mathematical structures helps connect sequences with physics and technology.
Check Your Understanding
Questions
Question 1: Identifying a Motion Pattern
A vehicle's position is recorded every second:
0, 8, 16, 24, 32, ...
Identify the type of sequence and determine the vehicle's velocity.
Question 2: Constant Velocity
A train begins at position 100 m and moves at 20 m/s.
Find its position after six seconds.
Question 3: Arithmetic Velocity Sequence
A car begins at 5 m/s and accelerates at 2 m/s².
Write the velocity sequence for the first five seconds, including the initial velocity.
Question 4: Quadratic Motion
An object starts from rest and accelerates at 4 m/s².
Calculate its displacement after three seconds.
Question 5: First Differences
The positions of an object are:
0, 2, 8, 18, 32, ...
Find the first and second differences.
What type of sequence is this?
Question 6: Bouncing Ball
A ball is dropped from 4 m and rebounds to 75% of its previous height.
Calculate the maximum height after three bounces.
Question 7: Geometric Decay
A vibrating system begins with an amplitude of 12 cm.
The amplitude decreases by 10% after each cycle.
Calculate the amplitude after five cycles.
Question 8: Pendulum Frequency
A pendulum completes one oscillation every 4 seconds.
Calculate its frequency.
Question 9: Counting Oscillations
A pendulum has a period of 1.5 seconds.
How many complete oscillations does it make in 60 seconds?
Question 10: Wheel Revolutions
A wheel completes 8 revolutions per second.
Calculate the number of revolutions after 25 seconds.
Question 11: Wheel Distance
A wheel has radius 0.4 m.
It rolls without slipping for 50 revolutions.
Calculate the distance travelled.
Question 12: Recursive Motion Model
An object begins with velocity 3 m/s.
Its velocity increases by 2 m/s during every one-second interval.
Write a recursive model and calculate its velocity after five seconds.
Question 13: Numerical Approximation
An object begins at position 0 m with velocity 4 m/s.
Its acceleration is 2 m/s².
Using a one-second time step and the rules:
vₙ₊₁ = vₙ + 2
xₙ₊₁ = xₙ + vₙ
calculate its approximate position after three seconds.
Question 14: Evaluating Models
Explain three limitations of using a fixed rebound factor to model a bouncing ball over many bounces.
Question 15: Integrated Challenge
A car starts from rest and accelerates uniformly at 3 m/s².
a) Write the velocity formula.
b) Calculate the velocity after five seconds.
c) Write the displacement formula.
d) Calculate the displacement after five seconds.
e) Generate the displacement sequence at times 0, 1, 2, 3, 4, and 5 seconds.
f) Explain why the displacement sequence is quadratic.
Fully Worked Answers
Answer 1: Identifying a Motion Pattern
Sequence:
0, 8, 16, 24, 32, ...
Common difference:
8
The sequence is arithmetic.
The position increases by 8 m every second.
Velocity:
v = 8/1
Answer: 8 m/s
Answer 2: Constant Velocity
Initial position:
x₀ = 100 m
Velocity:
v = 20 m/s
Time:
t = 6 s
Use:
x = x₀ + vt
x = 100 + 20(6)
= 100 + 120
Answer: 220 m
Answer 3: Arithmetic Velocity Sequence
Initial velocity:
u = 5 m/s
Acceleration:
a = 2 m/s²
Use:
v = u + at
At t = 0:
v = 5 m/s
At t = 1:
v = 7 m/s
At t = 2:
v = 9 m/s
At t = 3:
v = 11 m/s
At t = 4:
v = 13 m/s
At t = 5:
v = 15 m/s
Sequence: 5, 7, 9, 11, 13, 15
Answer 4: Quadratic Motion
Initial velocity:
u = 0
Acceleration:
a = 4 m/s²
Time:
t = 3 s
Use:
s = ut + ½at²
s = 0 + ½(4)(3²)
= 2(9)
Answer: 18 m
Answer 5: First Differences
Position sequence:
0, 2, 8, 18, 32
First differences:
2, 6, 10, 14
Second differences:
4, 4, 4
Because the second differences are constant, the sequence is quadratic.
Answer: Quadratic sequence
Answer 6: Bouncing Ball
Initial height:
h₀ = 4 m
Rebound factor:
r = 0.75
Number of bounces:
n = 3
Use:
hₙ = h₀rⁿ
h₃ = 4(0.75)³
= 4(0.421875)
Answer: 1.6875 m
Answer 7: Geometric Decay
Initial amplitude:
A₀ = 12 cm
Reduction:
10%
Remaining factor:
r = 0.90
Number of cycles:
n = 5
Use:
Aₙ = A₀rⁿ
A₅ = 12(0.90)⁵
= 12(0.59049)
Answer: Approximately 7.09 cm
Answer 8: Pendulum Frequency
Period:
T = 4 s
Use:
f = 1/T
f = 1/4
Answer: 0.25 Hz
Answer 9: Counting Oscillations
Period:
T = 1.5 s
Time:
t = 60 s
Number of cycles:
N = t/T
N = 60/1.5
Answer: 40 complete oscillations
Answer 10: Wheel Revolutions
Rotation rate:
8 revolutions per second
Time:
25 seconds
Number of revolutions:
N = 8 × 25
Answer: 200 revolutions
Answer 11: Wheel Distance
Radius:
r = 0.4 m
Circumference:
C = 2πr
= 2π(0.4)
= 0.8π m
Number of revolutions:
50
Distance:
D = 50(0.8π)
= 40π
Answer: Approximately 125.66 m
Answer 12: Recursive Motion Model
Initial velocity:
v₀ = 3 m/s
Increase per second:
2 m/s
Recursive rule:
vₙ₊₁ = vₙ + 2
After five seconds:
v₅ = 3 + 5(2)
= 13
Answer: 13 m/s
Answer 13: Numerical Approximation
Initial values:
x₀ = 0 m
v₀ = 4 m/s
Acceleration:
2 m/s²
Time step:
1 s
Rules:
vₙ₊₁ = vₙ + 2
xₙ₊₁ = xₙ + vₙ
First step
x₁ = 0 + 4 = 4
v₁ = 4 + 2 = 6
Second step
x₂ = 4 + 6 = 10
v₂ = 6 + 2 = 8
Third step
x₃ = 10 + 8 = 18
v₃ = 8 + 2 = 10
Answer: Approximate position = 18 m
For comparison, the exact constant-acceleration model gives:
s = 4(3) + ½(2)(3²)
= 12 + 9
= 21 m
The numerical model underestimates the exact displacement by 3 m.
Answer 14: Evaluating Models
Three limitations are:
1. Changing energy losses
The proportion of energy lost during each bounce may change as the ball slows.
2. Surface conditions
The rebound behaviour depends on the material and condition of the ball and surface.
3. Real stopping behaviour
A mathematical geometric sequence predicts smaller and smaller rebounds indefinitely, but a real ball eventually stops bouncing.
Therefore, the fixed-ratio model is useful as an approximation but does not describe every detail of real bouncing motion.
Answer 15: Integrated Challenge
Initial velocity:
u = 0
Acceleration:
a = 3 m/s²
Part a: Velocity formula
v = u + at
Since u = 0:
v = 3t
Part b: Velocity after five seconds
v = 3(5)
Answer: 15 m/s
Part c: Displacement formula
s = ut + ½at²
Since u = 0:
s = ½(3)t²
s = 1.5t²
Part d: Displacement after five seconds
s = 1.5(5²)
= 1.5(25)
Answer: 37.5 m
Part e: Displacement sequence
At t = 0:
s = 0
At t = 1:
s = 1.5
At t = 2:
s = 6
At t = 3:
s = 13.5
At t = 4:
s = 24
At t = 5:
s = 37.5
Sequence: 0, 1.5, 6, 13.5, 24, 37.5
Part f: Explain the quadratic pattern
First differences:
1.5, 4.5, 7.5, 10.5, 13.5
Second differences:
3, 3, 3, 3
Because the second differences are constant, the sequence is quadratic.
This agrees with the displacement formula:
s = 1.5t²
The quadratic pattern occurs because the car's velocity increases at a constant rate, causing it to travel greater distances during successive equal time intervals.
Final Reflection
Motion and repeated processes provide important real-world applications of mathematical sequences.
Constant velocity creates arithmetic position patterns, while constant acceleration produces arithmetic velocity patterns and quadratic position patterns. Bouncing balls and damped vibrations can be represented using geometric decay, while periodic motion creates predictable cycles.
Recursive models extend these ideas by allowing computers and engineers to calculate changing quantities one step at a time.
Recognising the mathematical structure of a repeated process helps us select appropriate formulas, interpret observations, and predict future outcomes.
The most important lesson is that sequences provide a powerful connection between mathematics, physics, and technology. By understanding how quantities change during repeated processes, we can construct models that explain motion, support scientific calculations, and help predict the behaviour of real systems.