Understanding Sequences
5. Sequences in Nature and Society
Learning outcomes
- I can identify examples of sequences in nature and everyday life.
- I can describe how patterns can be used to model real-world situations.
- I can recognize sequences in population growth, finance, and natural phenomena.
- I can explain how sequences help predict future outcomes.
- I can apply sequence concepts to simple real-world problems.
Sequences in Nature and Society
Sequences are not only mathematical exercises. They appear whenever quantities change in a predictable way over time, position, or repeated stages.
Examples can be found in:
- population growth
- savings and investments
- loan payments
- plant growth
- animal populations
- patterns in flowers and seeds
- depreciation of objects
- disease spread
- construction and design
- computer science
By identifying a pattern and representing it as a sequence, we can describe what has already happened and make predictions about what might happen next.


From Real Situations to Sequences
Suppose someone saves $50 every month.
Their total savings might be:
50, 100, 150, 200, 250, ...
This sequence increases by a constant amount:
+50
We can describe it recursively:
a₁ = 50
aₙ = aₙ₋₁ + 50
We can also describe it explicitly:
aₙ = 50n
The sequence provides a simple mathematical model of the person's savings.
What Is a Mathematical Model?
A mathematical model uses mathematics to represent some aspect of a real situation.
Models can use:
- sequences
- equations
- graphs
- tables
- diagrams
- functions
A model usually simplifies reality.
For example, the savings sequence:
50, 100, 150, 200, ...
assumes that exactly $50 is saved every month.
Real life may be more complicated. Some months the person might save more or less.
The model is useful because it allows us to make predictions if the pattern continues.
Arithmetic Sequences in Everyday Life
An arithmetic sequence changes by the same amount during each step.
For example:
20, 25, 30, 35, 40, ...
The common difference is:
d = 5
Arithmetic sequences can model situations involving constant increases or decreases.
Examples include:
- saving the same amount each week
- adding the same number of seats to each row
- increasing a training distance by the same amount each week
- losing the same number of units from inventory each day
Example: Theatre Seating
Suppose the first row of a theatre contains 18 seats and each new row contains 3 more seats than the previous row.
The sequence is:
18, 21, 24, 27, 30, ...
The recursive rule is:
a₁ = 18
aₙ = aₙ₋₁ + 3
The explicit rule is:
aₙ = 18 + 3(n − 1)
which simplifies to:
aₙ = 3n + 15
To find the number of seats in row 25:
a₂₅ = 3(25) + 15
a₂₅ = 90
The 25th row contains 90 seats.
Population Growth
Sequences can be used to model population changes.
Suppose a bacteria population begins at 500 and doubles every hour.
The population sequence is:
500, 1000, 2000, 4000, 8000, ...
This is a geometric sequence because each term is obtained by multiplying the previous term by the same number.
The common ratio is:
r = 2
Recursive rule:
a₁ = 500
aₙ = 2aₙ₋₁
Explicit rule:
aₙ = 500(2)ⁿ⁻¹


Predicting a Population
Using:
aₙ = 500(2)ⁿ⁻¹
find the population at the sixth stage.
a₆ = 500(2)⁵
a₆ = 500(32)
a₆ = 16,000
If the model continues to apply, the population at the sixth stage will be 16,000 bacteria.
This demonstrates how sequences allow us to predict future outcomes.
Real Populations Have Limits
A simple geometric sequence can predict extremely rapid population growth.
But real populations cannot usually grow exponentially forever.
Eventually, factors such as:
- food availability
- space
- disease
- competition
- predators
- water
- environmental conditions
can slow growth.
So the sequence may be useful for short-term predictions but unrealistic over very long periods.
More advanced population models account for environmental limits and carrying capacity.
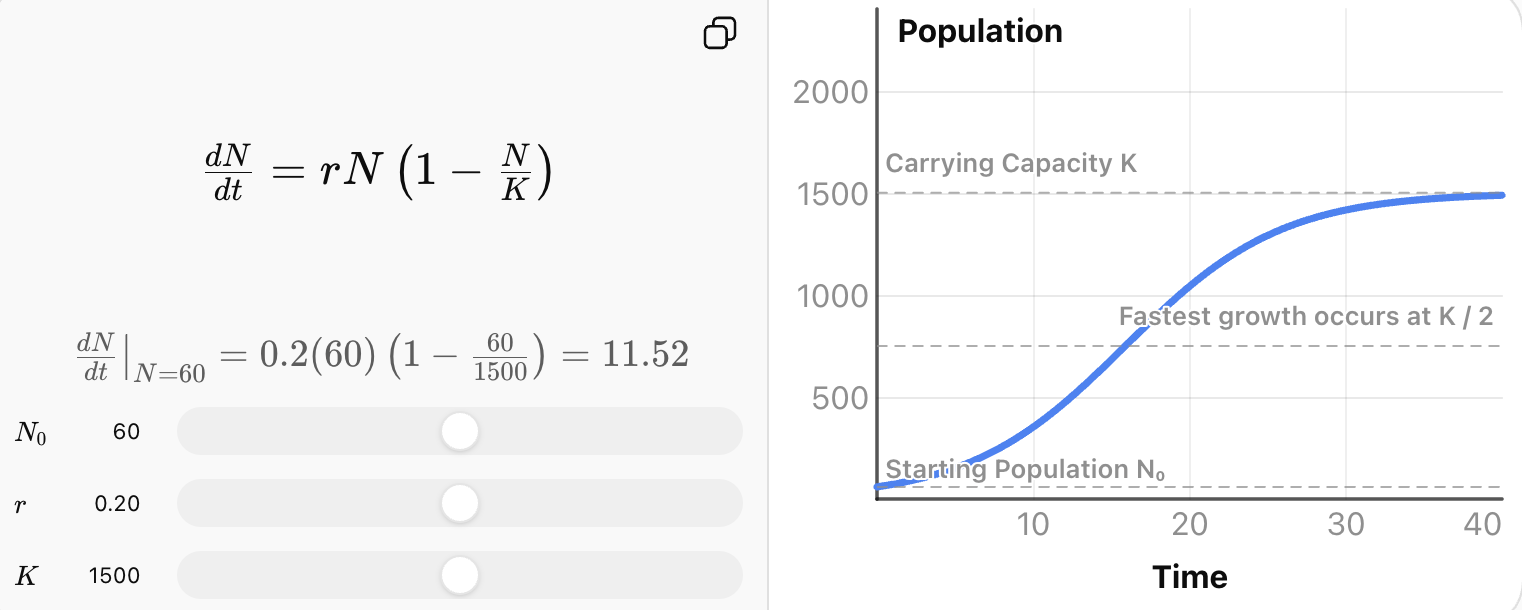
This highlights an important principle:
A mathematical pattern may be correct while its real-world application has limits.
Sequences in Finance
Finance provides many examples of sequences.
Suppose you deposit $100 into a savings account every month without earning interest.
Your deposits form an arithmetic pattern:
100, 200, 300, 400, 500, ...
The amount increases by:
$100 per month
However, if an existing balance grows by a percentage each year, the situation can form a geometric sequence.
Compound Growth
Suppose $1,000 is invested and increases by 5% each year.
Each year the balance is multiplied by:
1.05
The sequence begins approximately:
1000, 1050, 1102.50, 1157.63, 1215.51, ...
The recursive rule is:
a₁ = 1000
aₙ = 1.05aₙ₋₁
An explicit rule is:
aₙ = 1000(1.05)ⁿ⁻¹
This sequence can be used to predict future account balances.


Worked Example: Investment
Suppose an investment begins at $2,000 and increases by 4% each year.
The multiplier is:
1 + 0.04 = 1.04
The sequence can be modelled by:
aₙ = 2000(1.04)ⁿ⁻¹
Find the value at the tenth stage:
a₁₀ = 2000(1.04)⁹
a₁₀ ≈ 2846.62
The model predicts approximately $2,846.62.
Notice that the amount added each year is not constant. The percentage increase is constant.
Depreciation
Sequences can also model quantities that decrease.
Suppose a computer is worth $2,500 and retains 80% of its value each year.
The sequence begins:
2500, 2000, 1600, 1280, 1024, ...
Each term is multiplied by:
0.8
Recursive rule:
a₁ = 2500
aₙ = 0.8aₙ₋₁
Explicit rule:
aₙ = 2500(0.8)ⁿ⁻¹
This is a geometric sequence with:
r = 0.8
Because:
0 < r < 1
the sequence decreases.
Worked Example: Depreciation
Using:
aₙ = 2500(0.8)ⁿ⁻¹
find the value at the fifth stage.
a₅ = 2500(0.8)⁴
a₅ = 2500(0.4096)
a₅ = $1024
According to the model, the computer is worth $1,024.
Again, a real computer's resale value may not follow this exact pattern. The sequence is a model.
Fibonacci Sequence
One of the most famous sequences associated with patterns in nature is the Fibonacci sequence.
A common version begins:
1, 1, 2, 3, 5, 8, 13, 21, 34, ...
Each new term is the sum of the previous two terms.
So:
1 + 1 = 2
1 + 2 = 3
2 + 3 = 5
3 + 5 = 8
The recursive rule is:
a₁ = 1
a₂ = 1
aₙ = aₙ₋₁ + aₙ₋₂


Fibonacci Patterns in Nature
Numbers related to the Fibonacci sequence can appear in biological growth patterns.
Examples often discussed include:
- spiral arrangements in sunflower seed heads
- spiral patterns in pinecones
- arrangements of leaves around stems
- numbers of petals in some flowers
These patterns can arise because biological growth processes often involve efficient arrangements of new structures around existing ones.
However, nature does not follow the Fibonacci sequence perfectly in every case.
Not every flower has a Fibonacci number of petals, and not every spiral found in nature is a Fibonacci spiral.
The sequence is a useful mathematical description of some natural patterns, not a universal law of nature.
Patterns in Plant Growth
Plants often produce structures according to repeated developmental rules.
Leaves may emerge at regular positions along stems.
Branches may form repeated arrangements.
Seeds may appear in spiral patterns.
These patterns can sometimes be represented mathematically using sequences.

Animal Populations
Sequences can also model animal populations.
Suppose a protected population contains 120 animals and increases by approximately 15 animals each year.
A simple arithmetic model is:
120, 135, 150, 165, 180, ...
The explicit rule is:
aₙ = 120 + 15(n − 1)
This model assumes a constant increase of 15 animals per year.
If the population instead increases by 10% each year, a geometric model may be more appropriate:
aₙ = 120(1.10)ⁿ⁻¹
The choice of sequence depends on how the population changes.
Arithmetic or Geometric?
A useful question is:
Does the quantity change by a constant amount or a constant factor?
Constant Amount
Example:
100, 120, 140, 160, ...
Difference:
+20
This is arithmetic.
Constant Factor
Example:
100, 120, 144, 172.8, ...
Ratio:
×1.2
This is geometric.
This distinction is extremely important when choosing a model.
Patterns in Social Media
Suppose one person shares a message with 3 people, and each of those people shares it with 3 more.
The number of new people reached at each stage could be modelled as:
1, 3, 9, 27, 81, ...
The rule is:
multiply by 3
This illustrates why information can sometimes spread extremely rapidly through networks.
Real social networks are much more complicated because people may share with the same individuals, stop sharing, or have different numbers of contacts.
Again, the sequence is a simplified model.
Patterns in Construction
Suppose a staircase design uses:
- 4 blocks in the first level
- 7 blocks in the second
- 10 blocks in the third
- 13 blocks in the fourth
The sequence is:
4, 7, 10, 13, ...
The common difference is:
3
The explicit rule is:
aₙ = 3n + 1
For level 30:
a₃₀ = 3(30) + 1
a₃₀ = 91
A builder could use the sequence to predict the number of blocks needed for a particular level.
Patterns in Technology
Sequences are important in computing and technology.
They can describe:
- repeated calculations
- computer algorithms
- memory usage
- data growth
- network traffic
- digital image sizes
- storage requirements
For example, digital storage sizes often follow repeated powers of 2:
1, 2, 4, 8, 16, 32, 64, ...
The sequence doubles each time.
Predicting Future Outcomes
One of the main reasons for creating a sequence model is to make predictions.
Suppose electricity consumption follows:
120, 135, 150, 165, 180, ...
If the pattern continues, we can predict:
Term 6 = 195
Term 7 = 210
Term 8 = 225
But every prediction contains an assumption:
the existing pattern will continue.
This assumption should always be considered when interpreting the result.
Interpolation and Extrapolation
Suppose we have data for years 2022–2026.
Using the pattern to estimate a missing value for 2024 is an example of interpolation because we are estimating within the range of known data.
Using the pattern to predict 2035 is extrapolation because we are extending beyond the known data.
Extrapolation is generally more uncertain because the pattern may change.
Worked Example: Savings
Maya has $300 saved and adds $75 each month.
The sequence is:
300, 375, 450, 525, 600, ...
Common difference:
d = 75
Explicit rule:
aₙ = 300 + 75(n − 1)
Find the amount at the 12th stage:
a₁₂ = 300 + 75(11)
a₁₂ = 300 + 825
a₁₂ = $1125
If Maya continues following the plan, the model predicts $1,125.
Worked Example: Population
A population begins with 400 organisms and increases by 25% during each time period.
Multiplier:
1.25
Sequence:
400, 500, 625, 781.25, ...
Explicit model:
aₙ = 400(1.25)ⁿ⁻¹
At the sixth stage:
a₆ = 400(1.25)⁵
a₆ ≈ 1220.7
Depending on the context, we might predict approximately 1,221 organisms.
Worked Example: Declining Value
A machine is initially worth $10,000 and loses 10% of its value each year.
It retains:
90% = 0.90
of its value.
The sequence begins:
10000, 9000, 8100, 7290, ...
Explicit model:
aₙ = 10000(0.90)ⁿ⁻¹
This allows future values to be predicted.
Choosing a Suitable Model
When examining a real-world pattern, ask:
What quantity is changing?
Then determine:
Does it change by approximately the same amount?
If yes, consider an arithmetic sequence.
If not, ask:
Does it change by approximately the same factor or percentage?
If yes, consider a geometric sequence.
Then ask:
Is there enough evidence to assume the pattern will continue?
Mathematics can produce an answer even when the model itself is unrealistic. Good modelling requires us to evaluate both.
Model vs. Reality
Suppose a bacteria population doubles every hour.
Starting with 100 bacteria:
100, 200, 400, 800, 1600, ...
After many hours, the mathematical model predicts enormous populations.
But eventually:
- food becomes limited
- waste accumulates
- space becomes limited
- environmental conditions change
The original model stops being realistic.
This illustrates an important idea:
Mathematical predictions are only as reliable as the assumptions behind the model.
Real Data May Not Be Perfect
Real-world sequences do not always follow exact rules.
Suppose a city's population is:
52,000, 53,100, 54,350, 55,400, 56,700
The increases are not identical.
Real data often contains variation.
A mathematical model may therefore describe an overall trend rather than reproduce every value exactly.
This is normal in science, economics, engineering, and social research.
Creating a Sequence Model
Suppose a fitness program begins with a 2 km run and increases the distance by 0.5 km each week.
The sequence is:
2, 2.5, 3, 3.5, 4, ...
Recursive rule:
a₁ = 2
aₙ = aₙ₋₁ + 0.5
Explicit rule:
aₙ = 2 + 0.5(n − 1)
After 10 stages:
a₁₀ = 2 + 0.5(9)
a₁₀ = 6.5 km
The sequence turns a real situation into a mathematical model that can be used for prediction.
Common Mistakes
Assuming every real-world pattern is exact
Real data often contains variation.
Confusing constant increase with percentage increase
Adding $100 every year is arithmetic.
Increasing by 10% every year is geometric.
Assuming a pattern will continue forever
Environmental, economic, technological, or social conditions can change.
Ignoring the meaning of the terms
Always identify what n represents: days, years, rows, generations, payments, or something else.
Using the wrong starting point
If a₁ represents the initial value, then the exponent in a geometric sequence is usually n − 1.
Treating a model as reality
A mathematical model is a simplified representation. Its predictions depend on its assumptions.
Key Terms
Sequence — an ordered list of values following a pattern or rule.
Mathematical model — a mathematical representation of a real-world situation.
Arithmetic sequence — a sequence with a constant difference between consecutive terms.
Common difference — the amount repeatedly added or subtracted in an arithmetic sequence.
Geometric sequence — a sequence with a constant ratio between consecutive terms.
Common ratio — the factor by which consecutive terms of a geometric sequence are multiplied.
Recursive rule — a rule that generates a term from one or more previous terms.
Explicit rule — a formula that calculates a term directly from its position.
Prediction — an estimate of a future or unknown value based on a model.
Interpolation — estimating a value within the range of known data.
Extrapolation — predicting a value beyond the range of known data.
Fibonacci sequence — a sequence in which each new term is the sum of the previous two terms.
Growth model — a mathematical representation of a quantity increasing over time.
Depreciation — a decrease in the value of an asset over time.
Assumption — a condition accepted when constructing or using a mathematical model.
Key Takeaways
- Sequences occur throughout nature, society, finance, science, and technology.
- Arithmetic sequences model repeated constant changes.
- Geometric sequences model repeated multiplication or percentage changes.
- Population growth can sometimes be represented using sequences.
- Savings, investments, and depreciation provide common financial applications.
- Fibonacci numbers appear in some patterns of biological growth and arrangement.
- Recursive rules show how a real-world quantity changes from one stage to the next.
- Explicit rules allow distant values to be predicted directly.
- Sequences can help predict future outcomes when the underlying pattern continues.
- Real-world patterns are often approximate rather than exact.
- Extrapolating far beyond known data can produce unreliable predictions.
- A mathematical model should always be evaluated in terms of its assumptions and limitations.
Check Your Understanding
- Give three examples of situations in nature or society that could be represented using sequences.
- A student saves $40 every week. Write the first six terms representing the total amount saved.
- Write a recursive rule and an explicit rule for the sequence in Question 2.
- A bacteria population begins at 300 and doubles during each time interval. Write the first six terms.
- Write an explicit rule for the bacteria population in Question 4.
- A phone is initially worth $1,200 and retains 75% of its value each year. Write the first four terms of the value sequence.
- Is the phone-value sequence arithmetic or geometric? Explain.
- A theatre has 24 seats in its first row and 4 additional seats in each following row. How many seats are in the 30th row?
- An investment begins at $5,000 and grows by 6% each year. Write a sequence model for its value.
- Explain why a population-growth sequence might make reasonable predictions for the next few years but unrealistic predictions for the next 500 years.
- Explain the difference between interpolation and extrapolation.
- Find a numerical pattern from nature, finance, technology, or everyday life. Describe the sequence, identify its rule, and explain what the pattern could help you predict.