Ratios, Proportions, and Linear Relationships
3. Direct Variation
Learning outcomes
- I can explain the concept of direct variation.
- I can identify proportional relationships in tables and graphs.
- I can determine the constant of variation.
- I can write equations representing direct variation.
- I can apply direct variation to real-world situations.
Direct Variation
Introduction
Many quantities in everyday life change together in predictable ways. When one quantity increases, another may increase by the same factor. When one decreases, the other may decrease proportionally.
For example:
-
Buying twice as many identical notebooks costs twice as much.
-
Travelling for twice as long at a constant speed covers twice the distance.
-
Working three times as many hours at a fixed hourly wage earns three times as much money.
-
Doubling the volume of water doubles its mass when its density remains constant.
These situations are examples of direct variation, also called direct proportionality.
Direct variation helps us understand proportional relationships, create equations, interpret graphs, and make predictions.


What Is Direct Variation?
Direct variation is a relationship between two quantities in which one quantity is a constant multiple of the other.
If y varies directly as x, then:
y = kx
where:
-
x is the independent variable.
-
y is the dependent variable.
-
k is the constant of variation.
The constant k describes how much y changes for each unit of x.
Example
Suppose a notebook costs $4.
|
Number of notebooks (x) |
Total cost |
|---|---|
|
1 |
$4 |
|
2 |
$8 |
|
3 |
$12 |
|
4 |
$16 |
|
5 |
$20 |
The equation is:
y = 4x
Here, k = 4.
For every additional notebook purchased, the cost increases by $4.
Important Observation
In direct variation, multiplying x by a factor also multiplies y by the same factor.
If x doubles, y doubles.
If x triples, y triples.
If x is halved, y is halved.
This holds even when the constant of variation is negative, although the sign of y then depends on the sign of x.
The Constant of Variation
The constant of variation is the fixed ratio between y and x.
Starting with:
y = kx
Divide both sides by x, where x ≠ 0:
k = y/x
Worked Example
Suppose y varies directly as x.
When x = 6, y = 24.
Find k.
Step 1: Write the Formula
k = y/x
Step 2: Substitute
k = 24/6
k = 4
Step 3: Write the Equation
y = 4x
Interpretation
For every increase of 1 in x, y increases by 4.
The ratio y/x remains equal to 4 for every nonzero x.
Recognising Direct Variation in Tables
One way to identify direct variation is to calculate the ratio y/x for each pair of values.
Example: Direct Variation
|
x |
y |
y/x |
|---|---|---|
|
2 |
10 |
5 |
|
4 |
20 |
5 |
|
6 |
30 |
5 |
|
8 |
40 |
5 |
|
10 |
50 |
5 |
The ratio is always 5.
Therefore, the relationship is directly proportional.
The equation is:
y = 5x
Example: Not Direct Variation
|
x |
y |
y/x |
|---|---|---|
|
1 |
5 |
5 |
|
2 |
8 |
4 |
|
3 |
11 |
3.67 |
|
4 |
14 |
3.5 |
The ratios are not constant.
Therefore, the relationship is not direct variation.
These values follow:
y = 3x + 2
Although the relationship is linear, it is not directly proportional.
Important Observation
A constant difference in y does not automatically indicate direct variation. The ratio y/x must remain constant.
Recognising Direct Variation in Graphs
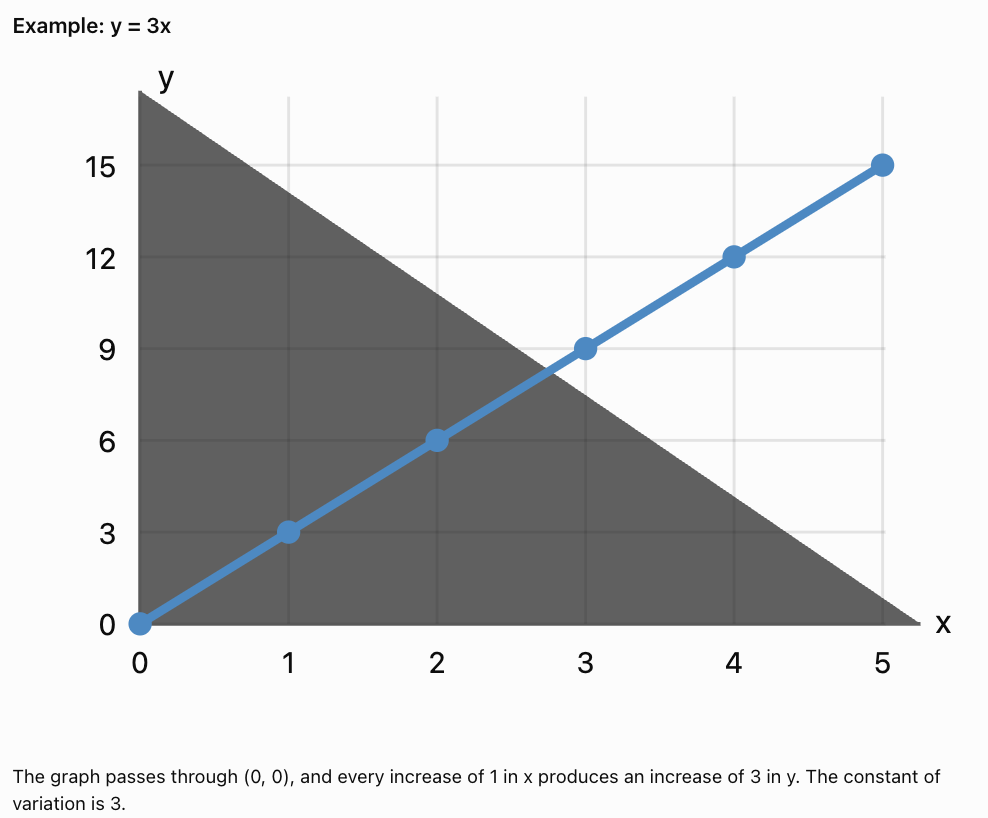
The graph of a direct variation relationship is a straight line passing through the origin.
The origin is:
(0, 0)
For a direct variation equation:
y = kx
the constant k is also the slope of the line.
Characteristics of Direct Variation Graphs
-
The graph is a straight line.
-
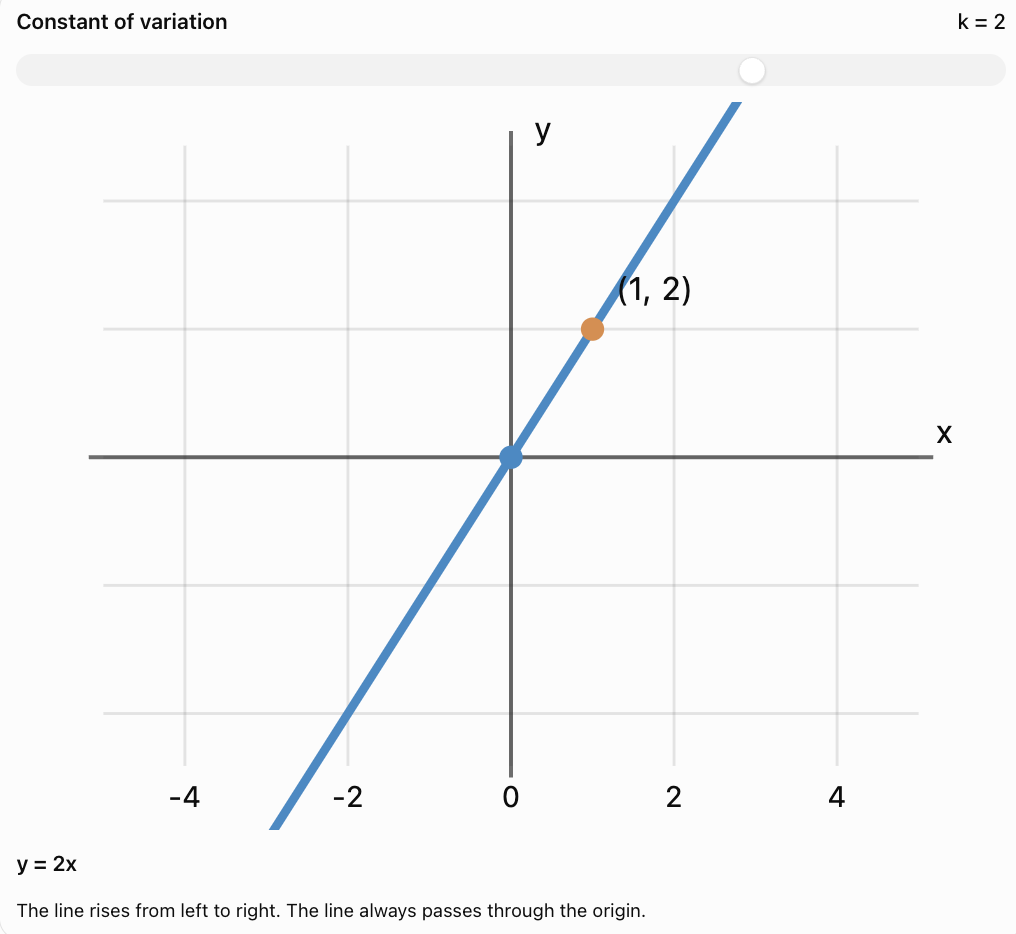
It passes through the origin.
-
Its slope is constant.
-
Its equation has the form y = kx.
-
If k is positive, the line rises from left to right.
-
If k is negative, the line falls from left to right.
Important Observation
A straight line that does not pass through the origin does not represent direct variation.
Exploring the Constant of Variation
Change k to investigate how the direct variation graph changes.
Questions to Consider
-
What happens when k increases?
-
What happens when k becomes negative?
-
What happens when k = 0?
-
Why does the line always pass through the origin?
Important Observation
When k = 0, y = 0 for all x. This is a degenerate direct-variation equation, sometimes excluded when a definition requires a nonzero constant.
Writing Direct Variation Equations
A direct variation equation can be constructed when one pair of corresponding values is known.
Worked Example
Suppose y varies directly as x.
When x = 8, y = 56.
Find the equation.
Step 1: Start with the General Equation
y = kx
Step 2: Substitute Known Values
56 = 8k
Step 3: Solve for k
k = 56/8
k = 7
Step 4: Write the Equation
y = 7x
Step 5: Verify
When x = 8:
y = 7(8) = 56
The equation agrees with the given information.
Using Direct Variation to Find Missing Values
Worked Example
Suppose y varies directly as x.
When x = 4, y = 18.
Find y when x = 10.
Step 1: Find k
k = y/x
k = 18/4
k = 4.5
Step 2: Write the Equation
y = 4.5x
Step 3: Substitute x = 10
y = 4.5(10)
y = 45
Final Answer
When x = 10, y = 45.
Alternative Method: Proportions
18/4 = y/10
Cross multiply:
4y = 180
y = 45
Both methods produce the same answer.
Direct Variation and Equivalent Ratios
Direct variation is closely related to equivalent ratios.
Suppose:
y = 3x
Some corresponding values are:
|
x |
y |
|---|---|
|
1 |
3 |
|
2 |
6 |
|
4 |
12 |
|
8 |
24 |
The ratios are:
3/1 = 6/2 = 12/4 = 24/8 = 3
Because the ratio remains constant, the relationship is proportional.
Important Observation
Equivalent ratios provide a useful way to solve direct variation problems without always writing the equation explicitly.
Direct Variation in Shopping
Shopping provides a familiar example of direct variation when each item has the same price.

Worked Example
A notebook costs $3.50.
Let:
n = number of notebooks
C = total cost in dollars
Step 1: Write the Equation
C = 3.5n
The constant of variation is 3.5.
Step 2: Calculate the Cost of 8 Notebooks
C = 3.5(8)
C = $28
Step 3: Determine How Many Notebooks Cost $42
42 = 3.5n
n = 42/3.5
n = 12
Interpretation
The total cost varies directly with the number of notebooks, assuming there are no fixed fees or discounts.
Direct Variation in Distance and Time
When speed is constant, distance varies directly with time.
d = vt
where:
-
d = distance
-
v = constant speed
-
t = time
The constant of variation is the speed v.

Worked Example
A cyclist travels at a constant speed of 18 km/h.
Step 1: Write the Equation
d = 18t
Step 2: Find the Distance After 3.5 Hours
d = 18(3.5)
d = 63 km
Step 3: Find the Time Needed to Travel 90 km
90 = 18t
t = 90/18
t = 5 hours
Interpretation
The cyclist travels 18 kilometres for every hour of travel.
Important Observation
The relationship is directly proportional only when the speed remains constant and distance is measured from zero at the starting time.
Direct Variation in Wages
When a worker earns a fixed hourly wage without additional bonuses or fees, earnings vary directly with hours worked.
Worked Example
A worker earns $16 per hour.
Let:
E = earnings in dollars
h = hours worked
Equation
E = 16h
Calculate Earnings for 7.5 Hours
E = 16(7.5)
E = $120
Determine Hours Required to Earn $200
200 = 16h
h = 200/16
h = 12.5 hours
Important Observation
A fixed starting payment or bonus would change the equation and make total earnings non-proportional to hours worked.
Direct Variation in Science
Direct variation appears in many scientific relationships when relevant conditions remain constant.
Mass and Volume
For a substance with constant density:
m = ρV
where:
-
m = mass
-
ρ = density
-
V = volume
The mass varies directly with volume.

Worked Example
A liquid has a density of 0.8 g/mL.
Find the mass of 250 mL of the liquid.
m = ρV
m = 0.8(250)
m = 200 g
Interpretation
Every additional millilitre adds 0.8 grams of mass.
The constant of variation is 0.8 g/mL.
Direct Variation in Geometry
Some geometric relationships involve direct variation.
Circumference and Diameter
For a circle:
C = πd
where:
-
C = circumference
-
d = diameter
-
π ≈ 3.14159
Circumference varies directly with diameter.
The constant of variation is π.

Worked Example
A circular wheel has diameter 70 cm.
C = πd
C = π(70)
C ≈ 219.9 cm
Important Observation
When the diameter doubles, the circumference doubles.
However, the area of a circle does not vary directly with its radius because A = πr².
Direct Variation with Negative Constants
The constant of variation can be negative.
Example
y = −3x
|
x |
y |
|---|---|
|
−2 |
6 |
|
−1 |
3 |
|
0 |
0 |
|
1 |
−3 |
|
2 |
−6 |
The ratio y/x equals −3 for all nonzero x.
The graph is a straight line through the origin with negative slope.
Important Observation
Direct variation does not always mean that both quantities increase together.
When k is negative, an increase in x produces a decrease in y.
Direct Variation Compared with Inverse Variation
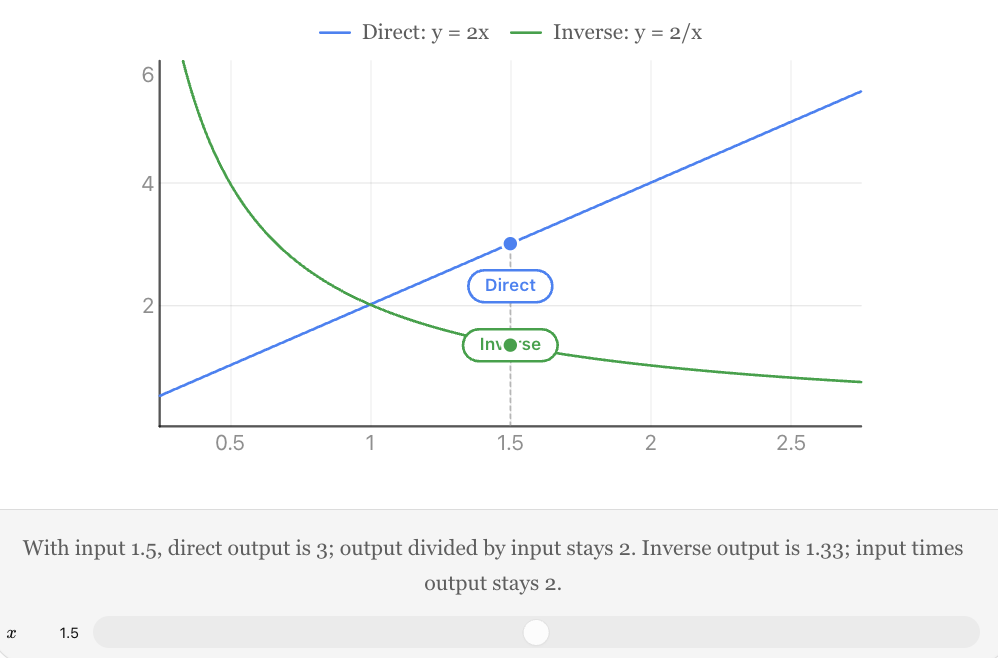
Direct variation and inverse variation describe different relationships.
Direct Variation
y = kx
The ratio y/x is constant.
Inverse Variation
y = k/x
The product xy is constant.
For positive x and k:
-
Direct variation: doubling x doubles y.
-
Inverse variation: doubling x halves y.
Comparison
Property
Direct variation
Inverse variation
Equation
y = kx
y = k/x
Constant relationship
y/x = k
xy = k
Typical graph
Straight line through origin
Hyperbola
If x doubles
y doubles
y halves
Example
Cost at fixed unit price
Time for fixed distance at varying speed
Important Observation
Direct and inverse variation should not be confused. The type of relationship determines the appropriate equation and method.
Distinguishing Direct Variation from Other Linear Relationships
Not all linear relationships represent direct variation.
Example A
y = 5x
This is direct variation.
The graph passes through the origin.
Example B
y = 5x + 10
This is not direct variation.
The graph crosses the y-axis at 10.
Real-World Interpretation
A gym charges $5 per visit with no membership fee:
C = 5v
This is direct variation.
Another gym charges a $10 membership fee plus $5 per visit:
C = 5v + 10
This is not direct variation.
Important Observation
A proportional relationship has no nonzero fixed starting amount.
Solving Multi-Step Direct Variation Problems
Worked Example
A machine produces 180 items in 6 minutes at a constant rate.
How many items will it produce in 15 minutes?
Step 1: Define Variables
Let:
P = number of items produced
t = time in minutes
Step 2: Write the General Equation
P = kt
Step 3: Find k
180 = 6k
k = 180/6
k = 30 items/min
Step 4: Write the Equation
P = 30t
Step 5: Calculate Production After 15 Minutes
P = 30(15)
P = 450 items
Step 6: Check Reasonableness
The machine produces 30 items per minute.
In 15 minutes, producing 450 items is consistent with this rate.
A General Method for Solving Direct Variation Problems
-
Identify the variables. Determine which quantities are being compared.
-
Check proportionality. Confirm that the ratio between corresponding quantities remains constant.
-
Write the equation. Begin with y = kx.
-
Find the constant. Use k = y/x with a known pair of nonzero x and corresponding y.
-
Construct the model. Substitute k into the equation.
-
Solve the problem. Calculate the unknown quantity.
-
Verify and interpret. Check the calculation, units, and reasonableness of the answer.
Common Mistakes
Assuming every increasing relationship is direct variation
A relationship may increase without having a constant ratio.
Confusing a constant difference with a constant ratio
Direct variation requires y/x to remain constant, not merely equal increases in y.
Forgetting that the graph must pass through the origin
A line with a nonzero y-intercept is not direct variation.
Calculating k incorrectly
Use k = y/x, not x/y, when the equation is y = kx.
Mixing up independent and dependent variables
Identify which quantity depends on the other.
Ignoring units
The constant of variation may have units, such as dollars per item or kilometres per hour.
Assuming k must be positive
Negative constants are possible.
Confusing direct and inverse variation
Direct variation has a constant ratio; inverse variation has a constant product.
Using a direct variation model when conditions change
Constant price, speed, density, or wage assumptions must remain valid.
Failing to verify
Substitute the known values into the equation to confirm the model.
Key Terms
-
Direct Variation: Relationship in which one quantity is a constant multiple of another.
-
Direct Proportionality: Another name for direct variation.
-
Proportional Relationship: Relationship represented by y = kx.
-
Constant of Variation: Fixed multiplier k connecting two directly proportional quantities.
-
Constant of Proportionality: Another name for the constant of variation.
-
Independent Variable: Input variable.
-
Dependent Variable: Output variable.
-
Ratio: Comparison of two quantities using division.
-
Unit Rate: Rate expressed per one unit of another quantity.
-
Equivalent Ratios: Ratios representing the same relationship.
-
Linear Relationship: Relationship represented by a straight-line graph.
-
Origin: Point (0, 0) on a coordinate plane.
-
Slope: Rate of change of a line.
-
Positive Slope: Line rises from left to right.
-
Negative Slope: Line falls from left to right.
-
Inverse Variation: Relationship represented by y = k/x.
-
Proportion: Equation showing that two ratios are equal.
-
Mathematical Model: Equation or representation describing a real-world relationship.
-
Verification: Checking whether a solution satisfies the original conditions.
Key Takeaways
-
Direct variation describes a relationship in which one quantity is a constant multiple of another.
-
The general equation is y = kx.
-
The constant of variation is k = y/x for x ≠ 0.
-
A direct variation graph is a straight line passing through the origin.
-
The constant of variation equals the slope of the graph.
-
Direct variation can be identified using tables, graphs, and equations.
-
Equivalent ratios are a useful way to recognise proportional relationships.
-
A constant difference does not necessarily indicate direct variation.
-
A linear relationship with a nonzero y-intercept is not direct variation.
-
Direct variation can be used to calculate unknown values.
-
Common applications include shopping, wages, distance, mass, and circumference.
-
Negative constants of variation are possible.
-
Direct variation and inverse variation describe different mathematical relationships.
-
Solutions should be checked using substitution, units, and real-world reasoning.
Check Your Understanding
Understanding Direct Variation
-
What is direct variation?
-
Write the general equation for direct variation.
-
What does k represent?
-
What point must every direct variation graph pass through?
-
Does y = 5x + 2 represent direct variation?
Finding the Constant of Variation
-
If y = 24 when x = 6, find k.
-
If y = 35 when x = 7, write the direct variation equation.
-
If y = −18 when x = 3, find k.
-
If y = 12 when x = 8, find k.
-
If y = 4.5x, identify the constant of variation.
Solving Direct Variation Problems
-
If y = 3x, find y when x = 12.
-
If y = 7x, find x when y = 56.
-
If y varies directly as x and y = 15 when x = 5, find y when x = 9.
-
If y varies directly as x and y = 40 when x = 8, find x when y = 65.
-
If y = −2x, find y when x = −6.
Real-World Applications
-
A notebook costs $4. Find the cost of 9 notebooks.
-
A cyclist travels at 20 km/h. Find the distance travelled in 3.5 hours.
-
A worker earns $18 per hour. Find the earnings for 6 hours.
-
A liquid has density 1.2 g/mL. Find the mass of 150 mL.
-
Explain why a taxi fare with a fixed starting fee is not directly proportional to distance.
Answer Key
Question
Answer
1
One quantity is a constant multiple of another
2
y = kx
3
Constant of variation
4
(0, 0)
5
No
6
4
7
y = 5x
8
−6
9
1.5
10
4.5
11
36
12
8
13
27
14
13
15
12
16
$36
17
70 km
18
$108
19
180 g
20
The fixed fee creates a nonzero y-intercept
Extended Challenge
-
Determine whether the table (2, 9), (4, 18), (6, 27), (8, 36) represents direct variation.
-
Find the constant of variation for the relationship in Question 1.
-
Write the equation of a direct variation relationship passing through (−4, 20).
-
If y varies directly as x and y = 18 when x = 2.5, find y when x = 7.
-
If y varies directly as x and y = −24 when x = 8, find x when y = 15.
-
A worker earns $157.50 for 9 hours. Determine the hourly rate and write the direct variation equation.
-
A vehicle travels 175 km in 2.5 hours at constant speed. Find the distance travelled in 6 hours.
-
A liquid has mass 450 g and volume 375 mL. Find the constant of variation and predict the mass of 600 mL.
-
Compare y = 6x and y = 6x + 12. Explain which relationship is directly proportional and why.
-
A circle has circumference 94.2 cm. Using π ≈ 3.14, determine its diameter and explain why circumference varies directly with diameter.
Final Investigation: Planning a School Supply Order
A school is purchasing supplies for students.
The cost of each item remains constant, and there are no additional fees or discounts.
The school needs to investigate proportional relationships and predict total costs.
Part A: Notebooks
A supplier sells 8 notebooks for $28.
-
Identify the independent variable.
-
Identify the dependent variable.
-
Calculate the cost per notebook.
-
Determine the constant of variation.
-
Write the direct variation equation.
-
Calculate the cost of 20 notebooks.
-
Determine how many notebooks can be purchased for $105.
-
Construct a table for 0, 5, 10, 15, and 20 notebooks.
-
Graph the relationship.
-
Explain why the graph passes through the origin.
Part B: Pencils
A supplier sells pencils for $0.75 each.
-
Write the direct variation equation.
-
Calculate the cost of 48 pencils.
-
Determine how many pencils can be purchased for $30.
-
Explain the meaning of the constant of variation.
-
Compare the slopes of the notebook and pencil cost graphs.
Part C: Evaluating Relationships
Consider these equations:
A: y = 4x
B: y = 4x + 5
C: y = −2x
-
Identify which equations represent direct variation.
-
Determine the constant of variation for each direct variation equation.
-
Explain why Equation B is not directly proportional.
-
Describe the direction of the graph of Equation C.
-
Write a conclusion explaining how direct variation can be used to plan purchases and predict costs.
Investigation Check
Notebooks
-
Unit price = $3.50
-
Constant of variation = 3.5
-
Equation: C = 3.5n
-
Cost of 20 notebooks = $70
-
Number of notebooks for $105 = 30
Pencils
-
Equation: C = 0.75p
-
Cost of 48 pencils = $36
-
Number of pencils for $30 = 40
Comparing Relationships
-
Equation A represents direct variation with k = 4.
-
Equation B is not direct variation because it has a nonzero y-intercept.
-
Equation C represents direct variation with k = −2.
-
Equation C has a negative slope.
-