Motion Graphs
4. Comparing Multiple Motions
Learning outcomes
- I can compare the motions of multiple objects using graphs.
- I can identify which object is moving faster from graphical information.
- I can compare accelerations using graph slopes.
- I can determine when two objects have the same position or velocity.
- I can use graphs to analyze interactions between moving objects.
Why compare motion graphs?
Displaying the motions of two or more objects on the same axes makes it easier to compare their behaviour.
We can investigate questions such as:
- Which object is moving faster?
- Which object is accelerating more rapidly?
- When does one object catch up with another?
- When do two objects have the same velocity?
- Is the distance between the objects increasing or decreasing?
The meaning of a graph depends on its axes. A higher line, a steeper slope and an intersection each mean different things on different types of motion graph.
Before interpreting a graph, identify the quantities and units shown.
Understanding the different graph types
| Graph type | Vertical coordinate tells us | Gradient tells us | Intersection tells us |
|---|---|---|---|
| Position–time | Position relative to an origin | Velocity | Same position at the same time |
| Cumulative distance–time | Total distance travelled | Speed | Same total distance travelled |
| Velocity–time | Velocity | Acceleration | Same velocity at the same time |
| Speed–time | Speed | Rate of change of speed | Same speed at the same time |
When comparing positions, the objects must use the same origin, positive direction and time reference.
A cumulative distance–time graph does not necessarily tell us where an object is. Two people could each travel 100 m along different routes and finish in different places.
For deciding whether objects meet, a position–time graph is usually the clearest choice.
Comparing speeds using position–time graphs
The gradient of a position–time graph gives velocity:
v = Δx / Δt
For a straight line, velocity is constant. For a curved graph, the gradient of a tangent gives velocity at a particular instant.
To compare speed, compare the magnitudes of the gradients.
- A steeper line represents greater speed.
- A horizontal line represents an object at rest.
- A positive gradient represents motion in the positive direction.
- A negative gradient represents motion in the negative direction.
An object with a steep negative gradient can be moving faster than one with a shallow positive gradient.
For example:
- Object A has velocity +3 m/s.
- Object B has velocity −5 m/s.
Object B is moving faster because its speed is 5 m/s, compared with A’s speed of 3 m/s.
The height of a position–time graph tells us position, not speed.
Worked example: catching up with another object
Two objects move along the same straight track:
- Object A starts at the origin and moves at 4 m/s.
- Object B starts 6 m ahead and moves in the same direction at 2 m/s.
Their position equations are:
xₐ = 4t
xᵦ = 6 + 2t
| Time (s) | Position of A (m) | Position of B (m) |
|---|---|---|
| 0 | 0 | 6 |
| 1 | 4 | 8 |
| 2 | 8 | 10 |
| 3 | 12 | 12 |
| 4 | 16 | 14 |
| 5 | 20 | 16 |
Object B begins ahead, but A’s position–time line is steeper. A is moving faster and closes the gap.
To find when they reach the same position, set their positions equal:
4t = 6 + 2t
2t = 6
t = 3 s
Substitute into either equation:
x = 4(3) = 12 m
They have the same position after 3 seconds, at 12 metres from the origin.
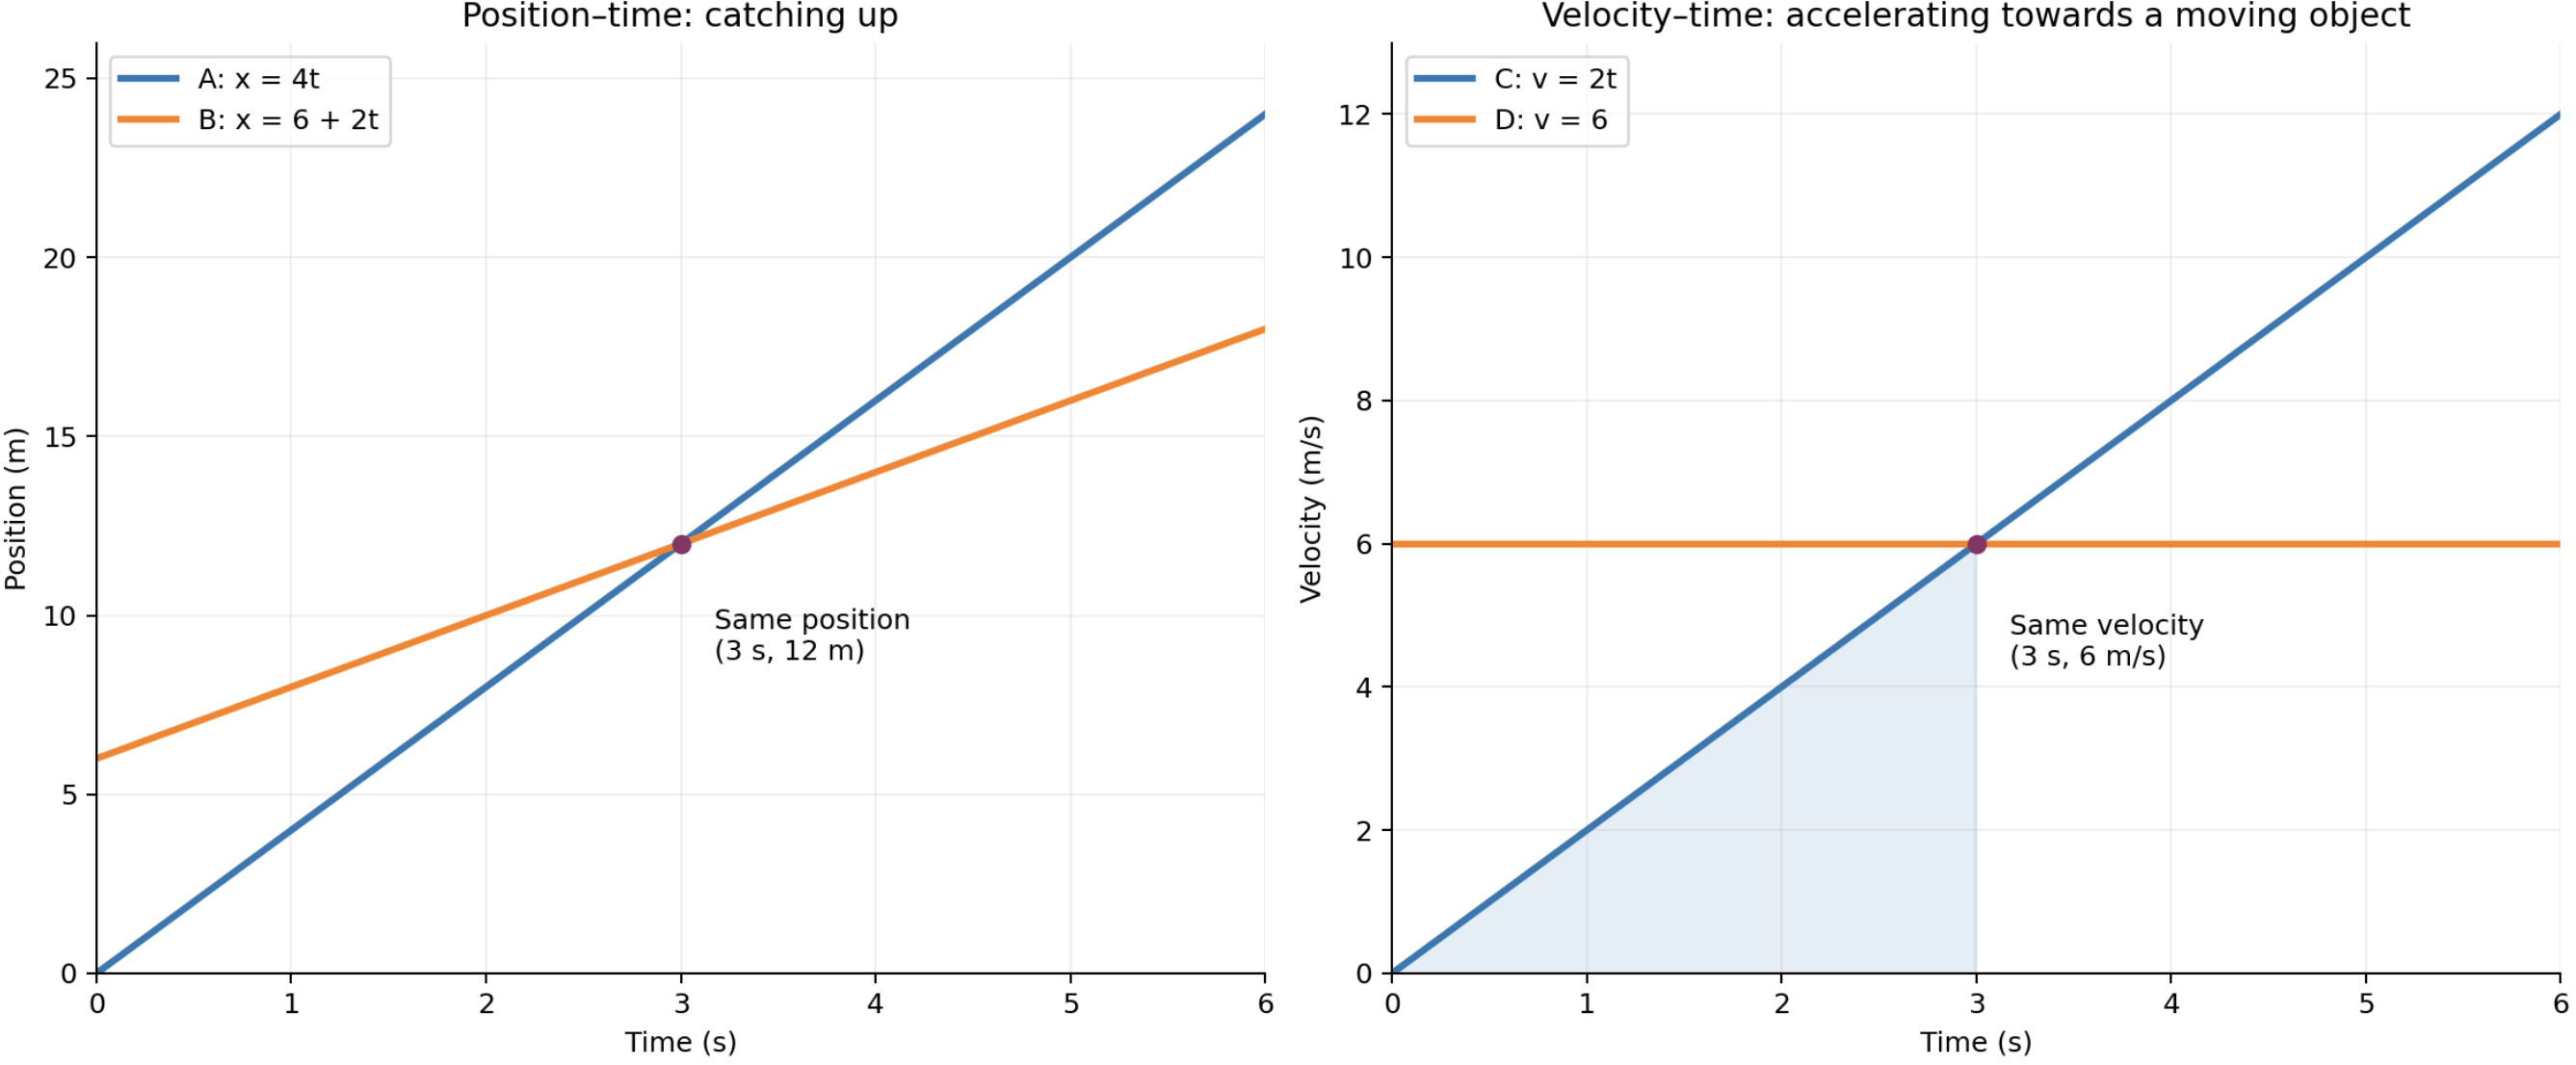
The left graph shows A and B reaching the same position. The right graph shows a separate example in which C and D reach the same velocity. These intersections represent different events.
Interpreting intersections on position–time graphs
When two position–time graphs intersect, the objects have the same position at the same time.
Depending on the situation, this may represent:
- One runner catching another.
- Two objects passing in opposite directions.
- A moving object reaching a stationary object.
An intersection does not mean their velocities are equal. Compare their slopes to determine their velocities.
In the example above, at t = 3 s:
- Both objects are at x = 12 m.
- A still moves at 4 m/s.
- B still moves at 2 m/s.
A catches and passes B.
The graph alone does not establish that a physical collision occurs. Objects may be in separate lanes, or the model may treat them as points moving along the same coordinate axis.
Comparing separation on position–time graphs
At a chosen time, the vertical gap between two position–time graphs gives their separation along the position axis:
Separation = |xᵦ − xₐ|
For A and B at t = 1 s:
Separation = |8 − 4| = 4 m
At t = 2 s:
Separation = |10 − 8| = 2 m
At t = 3 s:
Separation = 0 m
The gap decreases until A catches B.
Useful patterns include:
- Parallel straight lines: Same constant velocity and constant separation.
- Decreasing vertical gap: Objects are getting closer.
- Increasing vertical gap: Objects are getting farther apart.
- Intersecting lines: Objects have the same position at that instant.
Comparing velocities using velocity–time graphs
On a velocity–time graph, read velocity directly from the vertical axis.
At the same time:
- Equal vertical coordinates mean equal velocities.
- Values with opposite signs indicate opposite directions.
- The value with the larger magnitude represents greater speed.
For example, an object at −8 m/s is moving faster than one at +5 m/s.
Its graph lies lower, but its speed is greater.
On a velocity–time graph, compare vertical coordinates to compare velocities and compare slopes to compare accelerations.
Comparing accelerations using slopes
The gradient of a velocity–time graph gives acceleration:
a = Δv / Δt
For straight-line sections:
- A steeper upward slope means a greater positive acceleration.
- A horizontal line means zero acceleration.
- A downward slope means negative acceleration.
- A greater gradient magnitude means a greater acceleration magnitude.
Worked example
Over the same 4-second interval:
- Object P changes velocity from 2 m/s to 10 m/s.
- Object Q changes velocity from 8 m/s to 12 m/s.
For P:
aₚ = (10 − 2) / 4
aₚ = 2 m/s²
For Q:
aᵩ = (12 − 8) / 4
aᵩ = 1 m/s²
P has the greater acceleration, even though Q has the greater velocity throughout this interval.
Moving faster and accelerating faster are different ideas.
For curved velocity–time graphs, compare tangent gradients at the time of interest. A gradient calculated between two separated points gives average acceleration over that interval.
Same velocity does not mean same position
Consider the right-hand graph above:
- Object C starts from rest and accelerates uniformly at 2 m/s².
- Object D moves at a constant velocity of 6 m/s.
Their velocity equations are:
v꜀ = 2t
vᴅ = 6
They have equal velocities when:
2t = 6
t = 3 s
At that instant, both move at 6 m/s.
However, the intersection does not show that they are side by side. To compare their positions, we need their starting positions and their displacements.
Using areas to compare displacement
The signed area between a velocity–time graph and the time axis gives displacement:
- Area above the axis contributes positive displacement.
- Area below the axis contributes negative displacement.
To find position:
Final position = initial position + displacement
Suppose C and D start at the same position at t = 0.
During the first 3 seconds, C’s displacement is the triangular area under its graph:
Displacement of C = ½ × 3 × 6
Displacement of C = 9 m
D’s displacement is the rectangular area:
Displacement of D = 3 × 6
Displacement of D = 18 m
Therefore, at t = 3 s:
- They have the same velocity.
- D is 9 m ahead of C.
The area between their velocity graphs over this interval represents D’s extra displacement.
Determining when an accelerating object catches up
Continue the same example, with C and D starting together.
At time t, C’s velocity is 2t. Its displacement is the triangular area:
Displacement of C = ½ × t × 2t
Displacement of C = t²
D’s displacement is:
Displacement of D = 6t
Set their displacements equal:
t² = 6t
t(t − 6) = 0
The solutions are:
- t = 0 s: Their shared starting position.
- t = 6 s: C catches D again.
At t = 6 s:
Position of C = 6² = 36 m
Position of D = 6 × 6 = 36 m
Their velocities are then:
- C: 2 × 6 = 12 m/s
- D: 6 m/s
They have equal positions but different velocities.
From 0 to 3 seconds, D pulls farther ahead. After 3 seconds, C is faster and begins closing the gap. C catches D at 6 seconds.
Objects moving towards each other
Opposite directions can be represented using positive and negative velocities.
Worked example
Two cyclists begin 100 m apart on a straight path.
- Cyclist A starts at x = 0 and travels at +6 m/s.
- Cyclist B starts at x = 100 m and travels at −4 m/s.
Their position equations are:
xₐ = 6t
xᵦ = 100 − 4t
Set their positions equal:
6t = 100 − 4t
10t = 100
t = 10 s
Their meeting position is:
x = 6(10) = 60 m
On a position–time graph, A’s line slopes upwards and B’s line slopes downwards. The lines intersect at (10 s, 60 m).
Their separation decreases at 10 m/s because they move towards each other at 6 m/s and 4 m/s.
Relative velocity
Relative velocity describes how one object’s position changes compared with another object.
For motion along one axis:
Velocity of A relative to B = vₐ − vᵦ
For the earlier catching-up example:
vₐ − vᵦ = 4 − 2 = 2 m/s
A closes the initial 6 m gap at 2 m/s:
Time to catch up = 6 / 2 = 3 s
For the cyclists moving towards each other:
vₐ − vᵦ = 6 − (−4) = 10 m/s
Signs matter. Subtracting a negative velocity gives the combined closing rate in this situation.
Making reliable graphical comparisons
Before drawing a conclusion:
- Identify the graph type. Position, distance, velocity and speed are different quantities.
- Check scales and units. Visual steepness cannot be compared directly across graphs with different scales.
- Compare at the same time. Read vertically above the chosen time.
- Use the appropriate feature. Interpret heights, slopes, intersections and areas according to the axes.
- Check starting conditions. Equal displacements imply equal final positions only if starting positions are equal.
- State your conclusion with evidence. Include values, units and the graphical feature used.
For example:
“Object A is moving faster because its position–time gradient is 4 m/s, compared with 2 m/s for B.”
This is more precise than saying, “A’s graph is higher.”
Common misconceptions
- “The higher line always shows the faster object.” On a position–time graph, height shows position.
- “A steeper velocity–time graph means greater velocity.” It means greater acceleration magnitude.
- “Intersecting graphs always mean the objects meet.” Only a common position at a common time establishes this in a shared position model.
- “Equal velocity means equal acceleration.” Two velocity graphs can intersect with different slopes.
- “Equal areas mean equal positions.” Initial positions must also be considered.
- “Negative velocity means slowing down.” It indicates direction; compare velocity with acceleration to determine whether speed decreases.
- “A distance–time intersection means the same location.” Equal cumulative distances do not necessarily imply equal positions.
Did you know?
Two objects can have the same velocity at an instant when their separation is greatest.
In the C and D example, D’s lead grows until t = 3 s. At that moment, their velocities are equal. Afterward, C is faster, so the gap begins to shrink.
Key terms
- Position–time graph: A graph showing position relative to an origin as time changes.
- Velocity–time graph: A graph showing velocity as time changes.
- Gradient: Change in the vertical quantity divided by change in the horizontal quantity.
- Intersection: A point shared by two graphs.
- Separation: The distance between two objects at a particular time.
- Displacement: Change in position, including direction.
- Relative velocity: The velocity of one object measured relative to another.
- Closing speed: The rate at which the separation between approaching objects decreases.
- Tangent: A straight line matching a curve’s instantaneous slope at a point.
- Initial position: An object’s position at the chosen starting time.
Key takeaways
- Position–time gradients give velocity; their magnitudes give speed.
- Velocity–time gradients give acceleration.
- Position–time intersections show equal positions.
- Velocity–time intersections show equal velocities.
- Signed area under a velocity–time graph gives displacement.
- Use starting positions and displacements together to determine whether objects meet.
- Always check the axes, scales, directions and time reference before comparing motions.