Lab Reports
| Sitio: | Young Education |
| Curso: | Lab Reports and Science Fair |
| Libro: | Lab Reports |
| Impreso por: | ゲストユーザ |
| Fecha: | viernes, 25 de septiembre de 2026, 01:01 |
Descripción
© YE youngcutters.com/YE
1. Purpose and Importance of Lab Reports
Learning Outcomes
- Understand the role of lab reports in scientific communication
- Explain how well-written reports contribute to knowledge sharing
Why Lab Reports are Essential in Scientific Research
Lab reports are a cornerstone of scientific research as they provide a systematic and standardized way to document experimental processes and findings. By detailing every aspect of an experiment — from the hypothesis and methods to results and conclusions — lab reports ensure that research is transparent and reproducible. This transparency allows other scientists to replicate the experiment, verify its results, and build upon the findings to advance knowledge in the field. Furthermore, a well-written lab report communicates complex information in a clear and structured manner, making it accessible to a wider audience, including researchers, educators, and policymakers.
In addition to fostering collaboration and understanding, lab reports also play a critical role in maintaining the integrity of scientific work. They serve as a record of what was done and observed, reducing the likelihood of errors or misinterpretations when reviewing past experiments. Lab reports also provide a framework for analyzing uncertainties and errors, helping researchers critically assess the reliability and accuracy of their results. This rigorous documentation ensures that scientific conclusions are based on solid evidence, promoting trust and credibility within the scientific community.
Communicating Findings Effectively
Effectively communicating the findings of a lab report is crucial to ensuring that the experiment’s outcomes are understood and can be utilized by others. Clear and concise communication involves presenting data in an organized manner, typically through well-structured tables, graphs, and figures that make trends and patterns easy to identify. The Results section should focus on reporting findings objectively without interpretation, while the Discussion section provides context, analyzing the data, explaining its significance, and relating it to the initial hypothesis or research questions. Avoiding jargon or overly technical language ensures that the findings are accessible to a broader audience, including those who may not specialize in the same field.
Another key aspect of effective communication is emphasizing the relevance and implications of the results. Highlighting connections between the findings and real-world applications, existing theories, or future research opportunities can make the work more impactful. Addressing uncertainties and errors transparently, along with suggestions for improvement, enhances the credibility of the report. By integrating these elements, a well-communicated lab report not only informs but also engages its audience, encouraging further inquiry and collaboration within the scientific community.
Documenting experimental processes and results for reproducibility
Documenting experimental processes and results in lab reports is vital for ensuring reproducibility, a cornerstone of scientific research. A detailed and accurate record of the methodology allows other researchers to replicate the experiment under similar conditions, testing the validity of the findings. This involves describing every step of the experimental procedure, including the materials used, the equipment setup, and the specific techniques or protocols followed. Providing precise details about experimental conditions, such as temperature, pressure, or duration, ensures that others can faithfully reproduce the original setup, minimizing discrepancies that could arise from unintentional variations.
In addition to methodology, accurately recording and presenting results is equally critical for reproducibility. This includes raw data, processed results, and any relevant calculations or statistical analyses. Clear data organization, often through tables, graphs, and charts, helps other researchers understand the outcomes and compare them to their own results. Furthermore, including a discussion of uncertainties and errors provides insight into the reliability of the data, guiding others in interpreting the findings. By thoroughly documenting both processes and results, lab reports enable the scientific community to verify, validate, and build upon existing research, fostering a cycle of continuous discovery and innovation.
Activities:
- Discuss examples of real-world scenarios where lab reports are critical
- Reflect on the consequences of poor documentation
2. Structure and Components of a Lab Report
Learning Outcomes
- Identify the purpose of each lab report section
- Describe what to include in each section
- Title
- Purpose/Abstract
- Introduction
- Research Question
- Hypothesis
- Variables
- Groups
- Materials
- Safety Notes
- Procedure
- Results (Raw Data)
- Analysis (Manipulated Data)
- Conclusion
- Evaluation
- References
- Activities:
- Analyze a sample lab report to identify and critique its components
- Outline a mock lab report based on an example experiment
2.1. Title
Titles
A good title for a lab report is concise, descriptive, and specific, effectively summarizing the main focus of the experiment. It should provide enough information for the reader to understand the purpose or outcome of the study without being overly lengthy or vague. A well-crafted title typically includes key elements such as the variables studied, the experimental method or system used, and the broader scientific context or objective. For example, instead of a generic title like "Chemical Reaction Experiment," a more precise title like "Determining the Rate of Reaction Between Hydrochloric Acid and Magnesium at Varying Temperatures" gives a clear idea of the experiment’s scope. A good title not only grabs attention but also provides the reader with a quick insight into the lab report's content, making it easier to evaluate its relevance to their interests or research.Some examples of good Lab titles are:
- Investigating the Effect of Temperature on Enzyme Activity in Catalase Reactions
- Analyzing the Impact of Light Intensity on Photosynthetic Rate in Spinach Leaves
- Determining the Mechanical Efficiency of a Pulley System Under Variable Loads
- Measuring the Relationship Between Voltage and Current in an Electrical Circuit Using Ohm’s Law
- Quantifying Heat Loss in Insulated vs. Non-Insulated Containers
2.2. Purpose / Abstract
Purpose (Junior/High School):
The purpose is a brief statement that explains why the experiment is being conducted and what it aims to achieve. It outlines the main objective of the investigation, often linking it to a specific scientific concept or question being studied. Unlike a hypothesis, which predicts the outcome, the purpose focuses on the broader reasoning behind the experiment, such as understanding a phenomenon, testing a principle, or observing the effects of a variable. A well-written purpose sets a clear direction for the experiment and helps readers understand its significance in the context of the subject matter.
Examples:
- To investigate how temperature affects the rate of reaction between magnesium and hydrochloric acid.
- To investigate the relationship between the angle of incidence and the angle of reflection to verify the law of reflection.
- To determine the effect of different concentrations of salt solution on the mass of potato cells through osmosis.
- To measure the acceleration due to gravity by analyzing the motion of a freely falling object.
Objective or Abstract (University):
The Objective or Abstract provides a concise summary of the experiment, highlighting its purpose, methods, key results, and conclusions. It serves as a snapshot of the entire report, allowing readers to quickly understand the context and significance of the study. A strong abstract is typically brief, around 150-250 words, and avoids unnecessary details, focusing instead on the essential aspects of the work. It should answer key questions: What was the aim of the experiment? How was it conducted? What were the main findings? And what do those findings mean? By offering a clear and engaging overview, the abstract sets the tone for the rest of the report and helps the reader decide its relevance to their interests.
2.3. Introduction
Introduction
The introduction or background of a lab report provides the necessary context for understanding the experiment and its purpose. It begins with a brief overview of the scientific concepts, principles, or theories that are relevant to the experiment. This section often includes definitions of key terms, explanations of important processes, and a summary of previous research or knowledge that informs the study. By establishing a theoretical foundation, the introduction helps readers grasp why the experiment is being conducted and what it aims to address.
It connects the broader scientific context to the specific goals of the study, explaining how the experiment contributes to understanding the topic. A strong introduction strikes a balance between being informative and concise, avoiding excessive detail while providing enough information to set the stage for the methods and results that follow. This ensures that readers can follow the experiment’s rationale and appreciate its significance.
2.4. Research Question
Research Question
A good research question for an IB lab report should be specific, focused, and testable within the scope of the experiment. It should clearly identify the independent and dependent variables while being framed in a way that allows for measurable outcomes. The question should avoid vague or overly broad phrasing, ensuring it guides the investigation and aligns with the experiment’s objectives. Additionally, it should demonstrate relevance to the scientific concept or topic being studied, encouraging critical analysis and exploration of relationships between variables.
Examples:
- How does the concentration of hydrogen peroxide affect the rate of reaction catalyzed by catalase?
- Focuses on a measurable reaction rate as a dependent variable, influenced by hydrogen peroxide concentration.
- What is the effect of varying light intensity on the rate of photosynthesis in Elodea plants?
- Clearly links light intensity (independent variable) with the rate of photosynthesis (dependent variable).
- How does changing the angle of a ramp affect the time taken for a toy car to travel a fixed distance?
- Investigates the relationship between ramp angle (independent variable) and time (dependent variable), which is directly measurable.
2.5. Hypothesis
Hypothesis
A good hypothesis for a lab report is a testable prediction that clearly identifies the relationship between the independent and dependent variables. It should be specific, measurable, and grounded in scientific reasoning, using existing knowledge, theories, or prior observations to justify the expected outcome. A well-constructed hypothesis often follows an "if...then..." format, identifying the cause-and-effect relationship between the variables. Scientific reasoning ensures that the hypothesis is not just a guess but a logical expectation based on established principles. A strong hypothesis not only guides the experiment but also provides a basis for interpreting the results, whether they support or refute the prediction.
To strengthen a hypothesis, it should be backed by relevant scientific concepts or research. For instance, if the hypothesis predicts that temperature affects reaction rate, it can be supported by the collision theory, which explains how increased kinetic energy at higher temperatures leads to more frequent and effective particle collisions. By incorporating scientific reasoning, the hypothesis becomes a focused, credible foundation for the experiment.
Examples:
- If the concentration of hydrogen peroxide increases, then the rate of reaction with catalase will also increase because higher substrate concentrations increase the likelihood of enzyme-substrate collisions.
- Grounded in enzyme kinetics and collision theory.
- If the angle of a ramp increases, then the speed of a rolling toy car will increase because steeper inclines reduce the opposing component of gravitational force.
- Backed by principles of physics, specifically the relationship between force, incline, and motion.
- If the light intensity increases, then the rate of photosynthesis in Elodea will increase, up to a saturation point, because more photons are available to drive the light-dependent reactions of photosynthesis.
- Based on the photosynthesis process and the role of light as a limiting factor.
2.6. Variables
Variables
In a lab report, listing variables is essential for clarifying the experimental setup and ensuring reproducibility. Variables should be categorized as independent, dependent, or control variables, with each category clearly defined and described. This section provides a structured overview of how the experiment is designed to isolate and measure the relationship between the independent and dependent variables while minimizing the impact of extraneous factors.
Independent Variable:
- This is the variable that is intentionally changed or manipulated during the experiment. It is the cause being tested.
- When listing it, clearly state what is being varied and how (e.g., range, levels, or increments).
- Example: "The temperature of the water (measured in °C), adjusted to 20°C, 40°C, and 60°C."
Dependent Variable:
- This is the variable that is observed or measured to determine the effect of changes in the independent variable. It represents the outcome of the experiment.
- Specify what is being measured and the unit of measurement.
- Example: "The time taken for 5 g of salt to dissolve (measured in seconds)."
Control Variables:
- These are variables that are kept constant to ensure that they do not influence the dependent variable. This ensures that any changes observed are due to the manipulation of the independent variable alone.
- List each control variable with a brief explanation of how it will be maintained.
- Example: "The volume of water (100 mL), the type of salt used (table salt), and the method of stirring (constant speed with a magnetic stirrer)."
In the lab report, these variables are often presented in a table or bullet-point format for clarity, with each category labeled. This organization ensures that the experiment’s design is transparent and easy to understand.
2.7. Groups
Groups
In a lab report, describing control and experimental groups is essential to clarify the experimental design and establish the basis for comparison.
Control Groups
- A control group is the group in which no changes are made to the independent variable, providing a baseline for comparison against experimental groups where the independent variable is manipulated. The control group helps determine whether the observed effects are due to the independent variable or other external factors.
- When describing the control group in a lab report, specify what conditions are being kept consistent and why those conditions are considered the "normal" or baseline state. For instance, if testing the effect of fertilizer on plant growth, the control group might consist of plants grown without fertilizer under the same conditions as the experimental group.
Experimental Groups
- The experimental group(s) are the groups in which the independent variable is intentionally altered to study its effects. For each experimental group, describe the specific variations in the independent variable and ensure that all other conditions (control variables) are consistent with those in the control group.
- Example: If testing how light intensity affects plant growth, the experimental groups might include plants exposed to different light intensities (e.g., low, medium, and high), while all other factors (e.g., soil type, water amount) remain constant.
When Control Groups Are Necessary
- Control groups are necessary when the goal is to determine whether the independent variable directly influences the dependent variable.
- For example:
- Testing the effectiveness of a drug requires a control group receiving a placebo to establish whether the drug's effects are genuine or due to other factors.
- Experiments involving comparisons, such as evaluating the effect of a new fertilizer on plant growth, need a control group with no fertilizer to serve as a baseline.
When Control Groups Are Not Necessary
- In some experiments, a control group is not required because the investigation focuses solely on differences within experimental groups, rather than comparing them to a baseline.
- For example:
- If studying the relationship between the temperature of water and the rate at which it freezes, all conditions involve manipulating the independent variable (temperature), and there is no need for a control group.
- Experiments aimed at optimizing a process, such as finding the best temperature for enzymatic activity, may not require a control group, as the goal is to compare the outcomes across the experimental conditions.
By clearly describing both control and experimental groups in the lab report, the rationale for the experimental design becomes clear, ensuring that the data collected is meaningful and can be appropriately interpreted.
2.8. Materials
Materials
Listing materials in a lab report is a critical step to ensure reproducibility and clarity in the experimental process. A proper materials list should be specific, organized, and comprehensive, providing all the information necessary for someone else to replicate the experiment.
Key Guidelines for Listing Materials:
Be Specific and Detailed:
- Include exact names and specifications for each item, such as quantities, concentrations, dimensions, or grades (e.g., "100 mL of 0.1 M hydrochloric acid," "100 mm test tubes").
- If specialized equipment is used, specify the model, brand, or any distinguishing characteristics (e.g., "Thermometer, digital, ±0.1°C accuracy, Brand X").
Organize the List:
- Use bullet points or a numbered format for clarity. Group similar items together, such as chemicals, equipment, and safety gear, to make the list easy to read and follow.
- For example:
Chemicals:- 50 mL of 0.5 M sodium hydroxide solution
- 100 mL of distilled water
Equipment: - Beaker (250 mL)
- Magnetic stirrer
Include Quantities and Units:
- Always provide the exact amount or quantity needed for each material, with appropriate units (e.g., "10 grams of table salt," "3 petri dishes").
- Avoid vague terms like “some” or “a few.”
Account for Safety Gear and Miscellaneous Items:
- If the experiment requires safety equipment, include it in the list (e.g., "Lab coat, nitrile gloves, safety goggles").
- Mention any general items such as labels, markers, or cleaning supplies if they are part of the experimental setup.
Keep It Experiment-Specific:
- Tailor the list to the specific experiment being conducted. Avoid including unnecessary items that were not used in the procedure.
Example of a Proper Materials List:
Materials:
- 100 mL of 0.1 M hydrochloric acid
- 50 mL of distilled water
- Beaker (250 mL)
- Graduated cylinder (50 mL, ±1 mL precision)
- Thermometer (digital, ±0.1°C accuracy)
- Magnetic stirrer and stir bar
- Lab coat, nitrile gloves, and safety goggles
This approach ensures the materials list is precise and provides a clear, step-by-step inventory for the experiment.
2.9. Safety Notes
Safety Notes:
Including safety notes in a lab report is essential to highlight potential hazards and ensure safe laboratory practices. Safety notes should be concise, specific, and clearly identify any risks associated with the experiment, along with the precautions taken to mitigate them. They are usually included in a dedicated "Safety Precautions" section or as part of the "Materials and Methods" section where relevant.
How to Include Safety Notes:
Identify Potential Hazards:
- Clearly state the risks related to chemicals, equipment, or procedures. For example, mention if a substance is corrosive, flammable, toxic, or reactive.
State Precautions Taken:
- Describe the protective measures used to mitigate these risks, such as wearing specific personal protective equipment (PPE), working in a fume hood, or proper waste disposal.
Follow Regulatory Guidelines:
- Reference safety standards like Material Safety Data Sheets (MSDS) or institution-specific protocols for handling hazardous materials.
Include Emergency Measures:
- If applicable, outline what to do in case of accidents, such as spills, burns, or exposure to harmful substances.
Place Strategically:
- Include general safety notes at the beginning of the report or section-specific safety notes where the risks occur, such as before handling hazardous chemicals in the procedure.
Examples of Safety Notes:
Chemical Safety:
- "Hydrochloric acid (HCl) is corrosive. Gloves, safety goggles, and a lab coat were worn during handling, and the experiment was conducted under a fume hood to avoid inhalation of fumes."
Equipment Safety:
- "The hot plate was used to heat solutions. Care was taken to avoid burns by using heat-resistant gloves when handling hot glassware."
Waste Disposal:
- "All chemical waste was collected in labeled containers and disposed of following the laboratory’s hazardous waste disposal guidelines."
General Precautions:
- "Safety goggles were worn throughout the experiment to protect against potential splashes, and long hair was tied back to avoid entanglement with equipment."
Emergency Measures:
- "In case of accidental contact with sodium hydroxide, the affected area should be rinsed with running water for at least 15 minutes, and medical attention sought if irritation persists."
By including well-structured safety notes, the lab report not only demonstrates adherence to safe practices but also ensures that anyone replicating the experiment is aware of the necessary precautions.
2.10. Procedure
Procedure
The procedure section of a lab report provides a step-by-step account of how the experiment was conducted. It should be written in a clear, concise, and logical manner, ensuring that anyone reading it can replicate the experiment accurately. Begin by outlining the sequence of steps in the order they were performed, including enough detail to avoid ambiguity. Each step should be specific, mentioning quantities, units, equipment used, and how the independent variable was manipulated. For example, instead of writing "measure the solution," state "use a graduated cylinder to measure 50 mL of the 0.1 M hydrochloric acid."
In addition to the steps, include any relevant diagrams or labeled illustrations of the experimental setup to clarify complex procedures or arrangements. These visuals can be especially helpful when describing apparatus configurations or experimental layouts. If specialized techniques or instruments were used, briefly explain how they were operated. Avoid excessive details about standard lab techniques (e.g., “turn on the balance to weigh”) unless they are critical to the experiment.
Finally, ensure the procedure includes precautions or notes about maintaining consistency in control variables, as this ensures reliability. For example, if testing the effect of temperature on a reaction rate, state how temperature was controlled and monitored. Using numbered lists or bullet points is preferred for clarity, especially for sequential steps, while paragraphs may be used for explaining overarching processes or justifying specific methods. This combination ensures the procedure is both user-friendly and thorough.
Example Procedure:
Set up the apparatus:
- Place a 250 mL beaker on a magnetic stirrer.
- Add 100 mL of distilled water to the beaker.
- Insert a magnetic stir bar into the beaker and set the stirrer to medium speed.
Prepare the reactants:
- Measure 5.0 grams of sodium bicarbonate using an electronic balance.
- Measure 50 mL of 0.1 M hydrochloric acid (HCl) using a graduated cylinder.
Record the initial temperature:
- Use a digital thermometer to measure and record the initial temperature of the water in the beaker.
Add the reactants:
- Slowly add the sodium bicarbonate to the beaker while stirring.
- Immediately add the 50 mL of hydrochloric acid to the beaker.
Monitor and record the reaction:
- Observe the reaction for visible signs (e.g., bubbling or fizzing) and measure the temperature every 30 seconds for 5 minutes.
- Record the data in a table.
Dispose of the materials:
- After the reaction is complete, pour the solution into a designated waste container.
- Rinse the beaker and stir bar with distilled water.
Repeat for additional trials:
- Repeat steps 3–6 two more times to ensure consistent results.
This procedure is written in a clear, logical order and includes specific details (e.g., quantities, equipment, and timing) to ensure reproducibility.
2.11. Results
The most effective way to report observations in a lab report is to organize and present both qualitative and quantitative data clearly and systematically. This ensures the information is easy to understand and supports the analysis and conclusions.
1. Reporting Qualitative Observations
Qualitative observations are descriptive and include non-numerical information, such as changes in color, texture, smell, or physical state. These should be recorded in clear, concise sentences or in a table format for organization.
- How to present qualitative data:
- Use a dedicated section or subsection titled "Observations."
- Report observations in chronological order to reflect the experimental process.
- Be objective and avoid subjective interpretations (e.g., write "the solution turned blue" rather than "the solution looked pretty").
- Example:
- "Bubbling was observed immediately upon adding the acid to the solution."
- "The solid dissolved completely within 30 seconds."
2. Reporting Quantitative Observations
Quantitative observations involve numerical data that is measured and recorded. These should be presented in tables, charts, or graphs to make trends and patterns easy to identify.
- How to present quantitative data:
- Use a properly formatted table to list measurements, units, and any relevant uncertainties.
- Graphs or charts can visualize trends (e.g., line graphs for time-dependent data or bar charts for categorical data).
- Include the units for all measurements and indicate any measurement uncertainties.
- Example of a table:
| Time (s) | Temperature (°C) |
|---|---|
| 0 | 25 |
| 30 | 32 |
| 60 | 40 |
3. Combining Qualitative and Quantitative Observations
- Clearly separate qualitative and quantitative data into distinct subsections or use a table where qualitative notes accompany numerical values.
Example:
| Time (s) | Temperature (°C) | Observation |
|---|---|---|
| 0 | 25 | Solution was clear. |
| 30 | 32 | Bubbling began. |
| 60 | 40 | Bubbling slowed; slight yellowing of the solution. |
Tips for Effective Observation Reporting:
- Be consistent: Use the same format and units throughout the report.
- Be precise: Quantify qualitative data where possible (e.g., "bubbling occurred for 2 minutes" rather than "bubbling occurred for a while").
- Be unbiased: Record what you see, not what you expect or interpret.
By using these methods, observations are presented in a way that is both scientifically accurate and accessible for analysis and interpretation.
2.12. Analysis
An effective analysis section that uses only tables with calculated or manipulated data, graphs, and sample calculations should be well-structured and focused on clarity, ensuring that each visual element (table, graph, or calculation) contributes to interpreting the data and answering the research question. Here’s how to organize and present this type of analysis effectively:
1. Start with Tables of Manipulated or Calculated Data
- Present all manipulated or calculated data in organized tables.
- Include clear headers for each column (e.g., variables, units, or conditions), and ensure all calculations are consistent with the stated formulas.
- Include a brief caption for each table that explains its content and purpose.
Example of a Table:
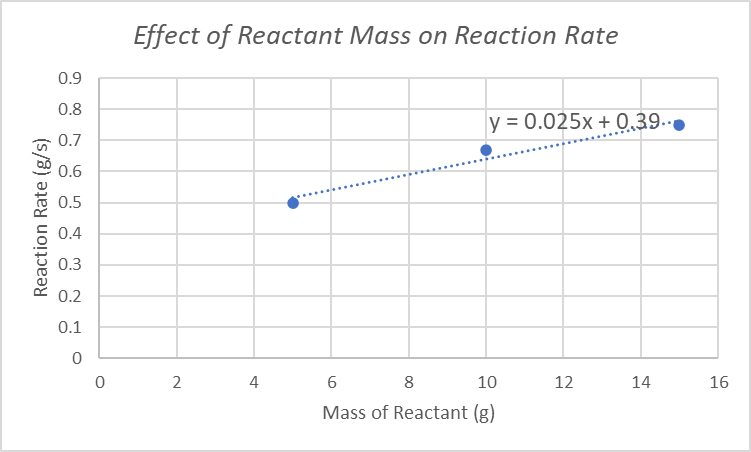
| Trial | Mass of Reactant (g) | Time (s) | Reaction Rate (g/s) |
|---|---|---|---|
| 1 | 5.0 | 10 | 0.50 |
| 2 | 10.0 | 15 | 0.67 |
| 3 | 15.0 | 20 | 0.75 |
2. Include Graphs for Data Visualization
- Use graphs to highlight trends or relationships in the data. The graph type (e.g., line, bar, or scatter plot) should be chosen based on the nature of the data.
- Label axes clearly with variables and units, and include a descriptive title. Add a legend if multiple datasets are presented.
- Ensure that graphs emphasize important patterns, such as direct relationships, plateaus, or anomalies.
Example of a Graph:
Figure 1. Reaction rate increases with mass of reactant, indicating a proportional relationship.
3. Provide Sample Calculations
- Include one or two sample calculations to demonstrate how key values in the tables or graphs were derived.
- Break the calculation into steps, showing all relevant equations and substitutions. Clearly annotate what each step represents and include units throughout.
- Write the calculation in a simple, easy-to-follow format and reference the corresponding table or graph.
Example of a Sample Calculation:
To calculate reaction rate in Trial 1:
"This calculation was repeated for all trials, and the results are presented in Table 1."
4. Use Captions to Explain Key Insights
- Provide concise captions for each table, graph, and calculation that explain its significance. Captions should summarize the trends or relationships shown and connect them to the hypothesis or research question.
5. Tie Visual Elements Together
- After presenting tables, graphs, and calculations, briefly summarize their implications in a concluding statement. This ties together the visual data and ensures the reader understands the overall significance.
Example of Summary:
"The data in Table 1 and Figure 1 indicate a proportional relationship between reactant mass and reaction rate, as supported by the sample calculations. This aligns with the hypothesis that increasing the amount of reactant enhances the reaction rate due to more frequent particle collisions."
Key Features of an Effective Analysis Section:
- Logical Flow: Present tables, graphs, and calculations in the order they were analyzed or calculated.
- Clear Explanations: Use captions and short summaries to interpret the data without excessive text.
- Consistency: Ensure that data presented in tables and graphs aligns with calculations and experimental results.
- Professional Formatting: Use proper labels, units, and annotations for all visual elements.
By focusing on concise and accurate representation of data through tables, graphs, and calculations, this analysis format ensures clarity and engagement while effectively supporting your conclusions.
2.13. Conclusion
How to Write a Comprehensive Conclusion for a Lab Report
A well-written conclusion summarizes the experiment and ties together the purpose, hypothesis, data analysis, and broader scientific implications. The following elements should be included:
1. Re-state the Purpose of the Experiment
Begin by briefly summarizing the experiment’s objective, clearly stating what you set out to investigate or achieve.
Example:
"The purpose of this experiment was to investigate how the concentration of a sugar solution affects the rate of osmosis in potato cells."
2. Re-state the Hypothesis
Next, re-state the hypothesis as it was presented in the introduction, but avoid discussing its correctness yet.
Example:
"The hypothesis was that increasing the concentration of the sugar solution would decrease the mass of the potato due to water leaving the cells via osmosis."
3. State Whether the Data Supported the Hypothesis
Clearly describe whether the data supported or contradicted the hypothesis, but avoid language such as “right,” “wrong,” or “proven.” Use neutral, scientific phrasing.
Example:
"The data supported the hypothesis, as the mass of the potato decreased with higher sugar concentrations."
4. Provide Scientific Reasoning
Explain the observed results using scientific principles. This should include references to relevant theories, laws, or mechanisms that align with your findings.
Example:
"This trend aligns with the principles of osmosis, where water moves from areas of low solute concentration to areas of high solute concentration. At higher sugar concentrations, more water exited the potato cells, resulting in a decrease in mass."
5. Use Numbers to Support the Conclusion
Incorporate numerical data from your results to back up your claims. Include averages, key trends, or specific measurements.
Example:
"For instance, in the 0.2 M sugar solution, the average mass of the potato decreased by 5.6%, whereas in the 0.8 M solution, the mass decreased by 23.4%. This demonstrates a clear relationship between sugar concentration and water loss."
6. Address Uncertainties
Discuss uncertainties that might have affected the data, referencing specific sources of error and how they could have influenced the results.
Example:
"Uncertainties in the measurement of potato mass (±0.01 g) and variation in the size of potato pieces could have contributed to slight inconsistencies in the data. Additionally, environmental factors, such as room temperature, may have affected the rate of osmosis."
7. Compare to Accepted Values
If possible, compare your experimental results to known or accepted values, and discuss any discrepancies.
Example:
"The expected osmotic pressure for a 0.8 M solution predicts a mass loss of approximately 25%, while the experiment yielded a loss of 23.4%. This 6.4% discrepancy may be attributed to measurement uncertainties or minor deviations in solution preparation."
8. Include Error Analysis
Quantify any differences between your results and accepted values using error analysis. Use calculations such as percent error to assess accuracy.
Example:
*"The percent error for the 0.8 M solution was calculated as follows:
This relatively small error suggests that the experiment was conducted with reasonable accuracy."*
9. Summarize Key Takeaways
Conclude by summarizing the overall findings and their significance in a broader scientific context, suggesting improvements for future experiments.
Example:
"In conclusion, the experiment demonstrated that higher sugar concentrations lead to greater water loss from potato cells due to osmosis, supporting the hypothesis. While the results closely matched theoretical predictions, minor discrepancies highlighted areas for improvement, such as ensuring uniform potato size and precise solution preparation. These findings contribute to a better understanding of osmotic processes in plant cells."
This structured approach ensures your conclusion is comprehensive, logical, and rooted in scientific reasoning, effectively communicating the results and their implications.
2.14. Evaluation
How to Write an Evaluation of an Experiment in a Lab Report
An evaluation in a lab report critically assesses the strengths, weaknesses, and overall reliability of the experiment. It connects these factors to the accuracy and precision of the data and suggests improvements and future research directions. Here's how to include the required elements effectively:
1. Discuss the Strengths
- Identify aspects of the experimental method, variables, or materials that contributed to the accuracy, precision, or validity of the results.
- Explain how these strengths enhanced the quality of the data collected.
Example:
"One strength of the method was the use of a digital balance with a precision of ±0.01 g, which ensured accurate mass measurements. Additionally, the use of consistent potato sizes minimized variability in the surface area, contributing to reliable data collection."
2. Address Weaknesses or Limitations
- Highlight any weaknesses in the procedure, materials, or control of variables that could have affected the data’s reliability or validity. Be specific about the source of error or limitation.
- Ensure that each limitation is tied back to its potential impact on the experiment’s outcomes.
Example:
"A limitation of the method was the manual timing of the reaction, which introduced human error and reduced the precision of time measurements. Additionally, variations in the ambient temperature were not controlled, which may have influenced the rate of osmosis."
3. Assess Validity and Reliability
- Validity: Evaluate whether the experiment measured what it intended to measure. Were the independent and dependent variables well-defined and controlled? Were the materials and methods suitable for the purpose?
- Reliability: Consider whether the results were consistent and repeatable. Were there significant variations between trials, or did the data align with theoretical expectations?
- Use examples or data trends to support your assessment.
Example:
"The validity of the experiment was strong, as the procedure directly measured the impact of sugar concentration on the mass of potato cells, aligning with the aim. However, slight inconsistencies in mass changes between trials (e.g., a standard deviation of ±0.5%) suggest that external factors may have impacted the reliability of the data."
4. Propose Improvements
- For each identified weakness or limitation, suggest a practical improvement that would enhance the accuracy, precision, or reliability of the experiment.
- Be specific about how these changes would address the issue.
Example:
"To reduce human error in timing, an automated stopwatch could be used to measure reaction times more precisely. Controlling ambient temperature with a thermostatically regulated environment would also eliminate external temperature variability, ensuring more consistent results."
5. Suggest Extensions to the Investigation
- Propose ways to expand the experiment to explore additional variables, address unanswered questions, or deepen understanding of the topic.
- Ensure these suggestions are logical extensions of the original research.
Example:
"To extend the investigation, future research could explore the effect of different types of solutes (e.g., salt vs. sugar) on osmosis in plant cells. Additionally, varying the temperature of the solutions could provide insight into the impact of thermal energy on osmotic rates."
6. Connect Everything to Accuracy and Precision
- Tie every evaluation point—strengths, weaknesses, and improvements—back to its effect on the data’s accuracy (closeness to true value) and precision (consistency across measurements).
- Reinforce how the proposed improvements or extensions would enhance these aspects.
Example:
"Addressing timing errors and temperature control would significantly improve the precision of the measurements, reducing variability across trials. Exploring additional solutes or environmental conditions could enhance the experiment’s scope, providing more comprehensive insights into the factors influencing osmosis."
Final Example Paragraph:
"The experiment demonstrated several strengths, including the use of precise measuring equipment and consistent sample sizes, which contributed to the accuracy of the data. However, limitations such as manual timing and uncontrolled ambient temperature introduced potential sources of error, impacting the precision of the results. Automating timing and regulating the environment would address these issues, ensuring more reliable data. Future investigations could expand the scope by examining the effects of different solutes or temperatures, providing deeper insights into osmotic processes. Overall, the experiment was valid and yielded meaningful results, but addressing these limitations would further enhance its reliability."
By structuring the evaluation this way, you create a clear, logical, and comprehensive assessment that is both critical and constructive.
2.15. References
Including references in a lab report is essential for crediting the sources of information used and ensuring scientific credibility. Proper referencing follows a specific style (e.g., APA, MLA, or Chicago), with citations included both in-text and in a dedicated References or Works Cited section at the end of the report.
1. In-Text Citations
- When to Cite:
- When referring to background information, theories, or formulas from textbooks, articles, or other research.
- When quoting or paraphrasing ideas, data, or findings from other works.
- How to Format:
- Follow the chosen citation style:
- APA Style: (Author, Year).
Example: "According to the law of osmosis, water moves from areas of low solute concentration to high solute concentration (Smith, 2020)." - MLA Style: (Author Page Number).
Example: "Osmosis is driven by a concentration gradient (Smith 45)." - Numbered Styles (e.g., IEEE): Use numbers to refer to sources in a list.
Example: "The principles of osmosis are well-documented [1]."
- APA Style: (Author, Year).
- Place citations directly after the referenced material.
- Follow the chosen citation style:
2. References Section (End of Report)
- Purpose:
- Provides complete details of all sources cited in the report so that readers can locate them.
- Formatting the References Section:
- Title the section References (APA, IEEE) or Works Cited (MLA).
- Use a consistent style and alphabetical or numerical order based on the chosen format.
- Include all necessary details: author(s), publication year, title, publisher/journal, volume, page numbers, and DOI/URL if applicable.
3. Examples of References by Style
APA Style
- Book:
Smith, J. (2020). Principles of Biology. New York: Academic Press. - Journal Article:
Johnson, M., & Lee, K. (2019). The effects of temperature on osmosis. Journal of Experimental Biology, 45(3), 245-250. https://doi.org/10.1016/j.jeb.2019.03.001 - Website:
National Science Foundation. (2021). Osmosis and its applications. Retrieved November 28, 2024, from https://www.nsf.gov/osmosis
MLA Style
- Book:
Smith, John. Principles of Biology. Academic Press, 2020. - Journal Article:
Johnson, Mark, and Kelly Lee. “The Effects of Temperature on Osmosis.” Journal of Experimental Biology, vol. 45, no. 3, 2019, pp. 245–50, https://doi.org/10.1016/j.jeb.2019.03.001. - Website:
National Science Foundation. “Osmosis and Its Applications.” NSF, 28 Nov. 2024, https://www.nsf.gov/osmosis.
IEEE Style
- [1] J. Smith, Principles of Biology. New York: Academic Press, 2020.
- [2] M. Johnson and K. Lee, "The effects of temperature on osmosis," Journal of Experimental Biology, vol. 45, no. 3, pp. 245-250, Mar. 2019.
- [3] National Science Foundation, "Osmosis and its applications," NSF, Nov. 28, 2024. [Online]. Available: https://www.nsf.gov/osmosis.
4. Common Tips
- Be Complete and Consistent: Use the same citation style throughout the report.
- Order the List: Alphabetize (APA, MLA) or number (IEEE) references in the final section.
- Proofread: Double-check that in-text citations match the sources listed in the References section.
Including proper citations shows respect for intellectual property, supports your claims, and strengthens the credibility of your lab report.
3. Writing Clear and Concise Objectives
Learning Outcomes
- Formulate clear objectives for a given experiment
- Distinguish between effective and ineffective objectives
- Defining specific, measurable, and relevant objectives
- Aligning objectives with the experiment’s purpose
- Avoiding ambiguity and redundancy
Activities:
- Rewrite unclear objectives to improve clarity
- Draft objectives for a hypothetical experiment
4. Best Practices for Writing Lab Report Sections
Learning Outcomes
- Write clear, concise, and well-structured sections for a lab report
- Identify and avoid common writing mistakes.
- Tips for writing each section effectively:
- Using concise and objective language
- Avoiding unnecessary jargon or filler
- Emphasizing clarity in Methods and Results
- Common pitfalls in lab report writing
Activities:
- Compare well-written and poorly written sections
- Rewrite a poorly written Results or Discussion section
5. Practical Application and Review
Learning Outcomes
- Write a complete lab report from start to finish
- Revise and improve a draft based on feedback
- Integrating all components into a cohesive lab report
- Peer review process and the importance of revisions
- Finalizing and formatting the lab report for submission
Activities:
- Draft a full lab report for a provided dataset or experiment
- Conduct a peer review to provide and receive constructive feedback
- Revise the lab report based on peer input