Introduction to Systems of Equations

Website: Young Education
Kurs: Systems of Equations
Buch: Introduction to Systems of Equations
Gedruckt von: Guest user
Datum: Montag, 9. November 2026, 16:35

1. What is a System of Equations?

Learning outcomes
  • I can define a system of equations.
  • I can explain what it means for two equations to form a system.
  • I can identify the variables in a system.
  • I can recognize systems with one or more variables.
  • I can distinguish between a single equation and a system of equations.
2. Solutions to Systems

Learning outcomes
  • I can define the solution of a system of equations.
  • I can explain why a solution satisfies both equations.
  • I can verify whether an ordered pair is a solution.
  • I can distinguish between solutions and non-solutions.
  • I can interpret solutions in context.

Solutions to Systems

A system of equations is a set of two or more equations involving the same variables. A solution to a system is a set of values that makes every equation in the system true at the same time.

For a system involving x and y, a solution is usually written as an ordered pair:

(x, y)

For example, consider:

x + y = 7

x − y = 1

The ordered pair:

(4, 3)

is a solution because it satisfies both equations.

https://images.openai.com/static-rsc-4/1ll5xCPi9aOBewnV-htANagVZYrfjMM0-WA1AdO-MnHLGOclxgD00jD91q2vR59DryL3Y6-KabAWzbqCk18sOEjgE0pGT0R1m-yB3JPkKFse71zP1bWCq3LjR5sS1BGSgYJtRrcy_uPIAPV_sbIfKme5PmqdN6xeSOwqT4dqG0lTQVOcMzudnthBP6veskKN?purpose=fullsize
https://images.openai.com/static-rsc-4/yFYoFhu1nknDxuIg935JZLCCwpgm0GWsX7pbj6MjTRznu6A-4-6AOs_8oXmYXrZGXBfQ2dl6Mh64S7Wt4bXKnz54UK_OXlOwdnenOX0haUZ0GqY67H4dRMuMuuPrlTizQBuMLveK0emHjrkVbsFuMg_8rztqkKO3tdbXLXaQw6W_Mxnsqaz6i2rP2SDIU27X?purpose=fullsize
https://images.openai.com/static-rsc-4/cZcgzFAG5RlRUrpaBuMpNnLb8Ay8ioABUX4fOWiIj0gW_5zRHZiju-mJH8BXc6vdhwJHuyuk9VCQpF4joPGrMQUjK0JalXTKHiOjtbxhvQHzdKkO_NiKSnhO3kXKAQuqWT2BwQ_7GDPyovSOYWVvHN_fAA8KMZ7tEpBGT-NMCKTgM1dqENVlHulG85CcICOX?purpose=fullsize
6

Learning Targets

  • I can define the solution of a system of equations.
  • I can explain why a solution satisfies both equations.
  • I can verify whether an ordered pair is a solution.
  • I can distinguish between solutions and non-solutions.
  • I can interpret solutions in context.

What Is a System of Equations?

A system of equations consists of equations that are considered together.

For example:

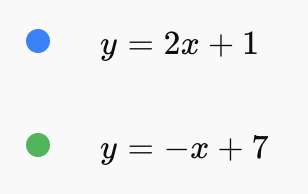
y = 2x + 1

y = −x + 7

Both equations contain the variables x and y.

We are interested in finding values of x and y that satisfy both equations simultaneously.

We can write the system as:

y = 2x + 1

y = −x + 7

The solution must work in the first equation and the second equation.


What Does It Mean to Satisfy an Equation?

A value satisfies an equation when substituting that value makes the equation true.

Consider:

y = 2x + 1

Is:

(2, 5)

a solution?

Substitute:

x = 2

and:

y = 5

Then:

5 = 2(2) + 1

5 = 4 + 1

5 = 5

The statement is true.

Therefore:

(2, 5) satisfies the equation.


A Solution Must Satisfy Both Equations

This is the most important idea when working with systems.

Suppose the system is:

x + y = 7

x − y = 1

Test:

(4, 3)

First equation:

4 + 3 = 7

7 = 7

True.

Second equation:

4 − 3 = 1

1 = 1

True.

Because the ordered pair satisfies both equations, it is a solution to the system.


Satisfying Only One Equation Is Not Enough

Consider the same system:

x + y = 7

x − y = 1

Now test:

(5, 2)

First equation:

5 + 2 = 7

True.

Second equation:

5 − 2 = 3

But the equation requires:

1

Therefore, the second equation is false.

So:

(5, 2)

is not a solution to the system.

Even though it satisfies one equation, a solution must satisfy both.

https://images.openai.com/static-rsc-4/uy_ql4qkWtc8z9e-DGezRrRAQ5oHb6YY64lcgeYd2gJxLaXZpAHraruAS9L8e2CbEXbwlWju5vFjPbLhz1D38cjo7Rot7NhhlPqW_G4krERdXRFUTdrf1S6L0lI9jtONnhWhpDPAOymb_yoezUvghTkAjXPZPVW2Nt9Hl5g-RHdZw5BA1u9AkduVubUk6HWt?purpose=fullsize
https://images.openai.com/static-rsc-4/bJBDniGcDssAT1XH0xYWAdruAUJ16EhfisMjTy43Ra3WmFvYz8SHVY2rhYo3Z9EYeA_3_5K3ZDnm2dxPAxGbG5tdqef_0geVDj3AId-2Vom8wkjQL7XVGTLMTArT4eFMEjOgB6SzcUkiDl-HBW64HOlCNNVYakvTPdMDrWBYJ-zyJY99zmPQAg456WRxEE6g?purpose=fullsize
https://images.openai.com/static-rsc-4/xqCj877U8nBOqj8-fJEWF6MLQV3ue_N_NbJSDg8Ewn4iho-wiAg0t-eEV4yEZF3XE0Un66n80owN5sXxu-amlW3whYff_TJ0fSrNo0C2OmwAe0hULq6xo4E7oTmhvIFprO9u7AX0bqQGNVgZrAXes0gwvW-HcP5NoVuql_lmlgT3K5Beg0aEbr0RLsiT3OAF?purpose=fullsize
5

Understanding Ordered Pairs

Solutions to systems with variables x and y are commonly written as ordered pairs:

(x, y)

The order matters.

For:

(3, 5)

the first coordinate tells us:

x = 3

and the second tells us:

y = 5

Therefore:

(3, 5)

and:

(5, 3)

are usually different points.

https://images.openai.com/static-rsc-4/VWie3wnNWw2URfyej1yoNsYtEiXY6bTa14eBqFvx9b3Xb2_iipWPJf6toIlK54bpjuuFAlM-GuKM9dkg6GKxxaeWrzLdpNRfCWk7VuYNwbIwBaItwLc38aW_1kpScgpZLZF-7DTUpac_3HXEBsFKqwMjGisSQmhmKsKw8I0KHey1rQWGK-1kHCBYzwpvQjBE?purpose=fullsize
https://images.openai.com/static-rsc-4/qm2HhdRzQGkuVWFkYiUcPcuEjlDRCN1tUKK4UN6vcpANFrYpsFyxO6wnDwgtE9feoh9pTn08UDbEgDmERTQEp1rSMeXa_ZD6Rl1rGbk_kXxgzNKked1MvBo_aQW59gBg53_3Erso6VxHmlrdE06OUoq__Q5usdPcY7ge91cf0ShrhjbjcQbkxESXI5brTKaq?purpose=fullsize
https://images.openai.com/static-rsc-4/mgWV_tJX9XCJoe2GGMDBImysA5nqz8L8nWCuGL1MXMby1BDjQmGaWR8jbAhxlIRF1zonQes00RcgTBSY5CaHpOyVvljxnD_JtjM2IdOLWPb3-0F1BZqWT2Bj-K1pGmvvzwDIoiKyDg0NWOgDcpvZ9DmK0jhP1gG1LPwbcXkOsDLKVq4U-Km6ICZoSWWLRca5?purpose=fullsize
6

Always check which value represents x and which represents y before substituting.


Verifying a Solution

To verify whether an ordered pair is a solution:

  • Identify the x-coordinate.
  • Identify the y-coordinate.
  • Substitute both values into the first equation.
  • Determine whether the equation is true.
  • Substitute the same values into the second equation.
  • Determine whether that equation is also true.

If both equations are true, the ordered pair is a solution.

If either equation is false, it is not a solution.


Worked Example — Verifying a Solution

Determine whether:

(3, 4)

is a solution to:

x + y = 7

2x + y = 10

Substitute into the first equation:

3 + 4 = 7

7 = 7

True.

Now test the second:

2(3) + 4 = 10

6 + 4 = 10

10 = 10

True.

Therefore:

(3, 4) is a solution to the system.


Worked Example — Identifying a Non-Solution

Determine whether:

(2, 5)

is a solution to:

x + y = 7

3x − y = 4

First equation:

2 + 5 = 7

True.

Second equation:

3(2) − 5 = 4

6 − 5 = 4

1 = 4

False.

Therefore:

(2, 5) is not a solution to the system.


Solutions on a Graph

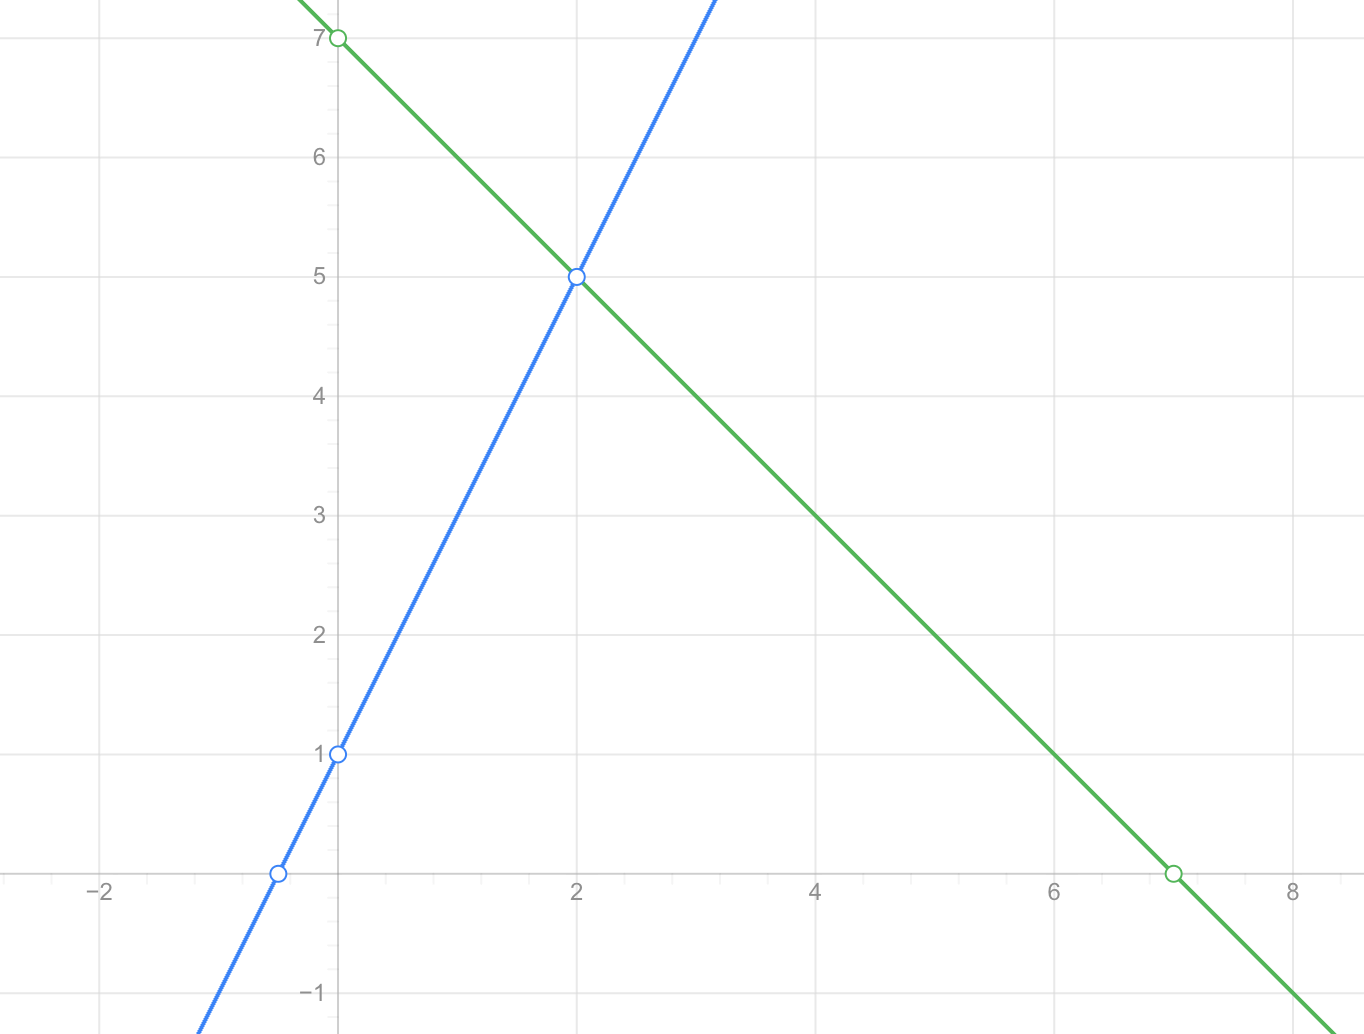
Each linear equation can be represented by a line on a coordinate plane.

Every point on a line satisfies that line's equation.

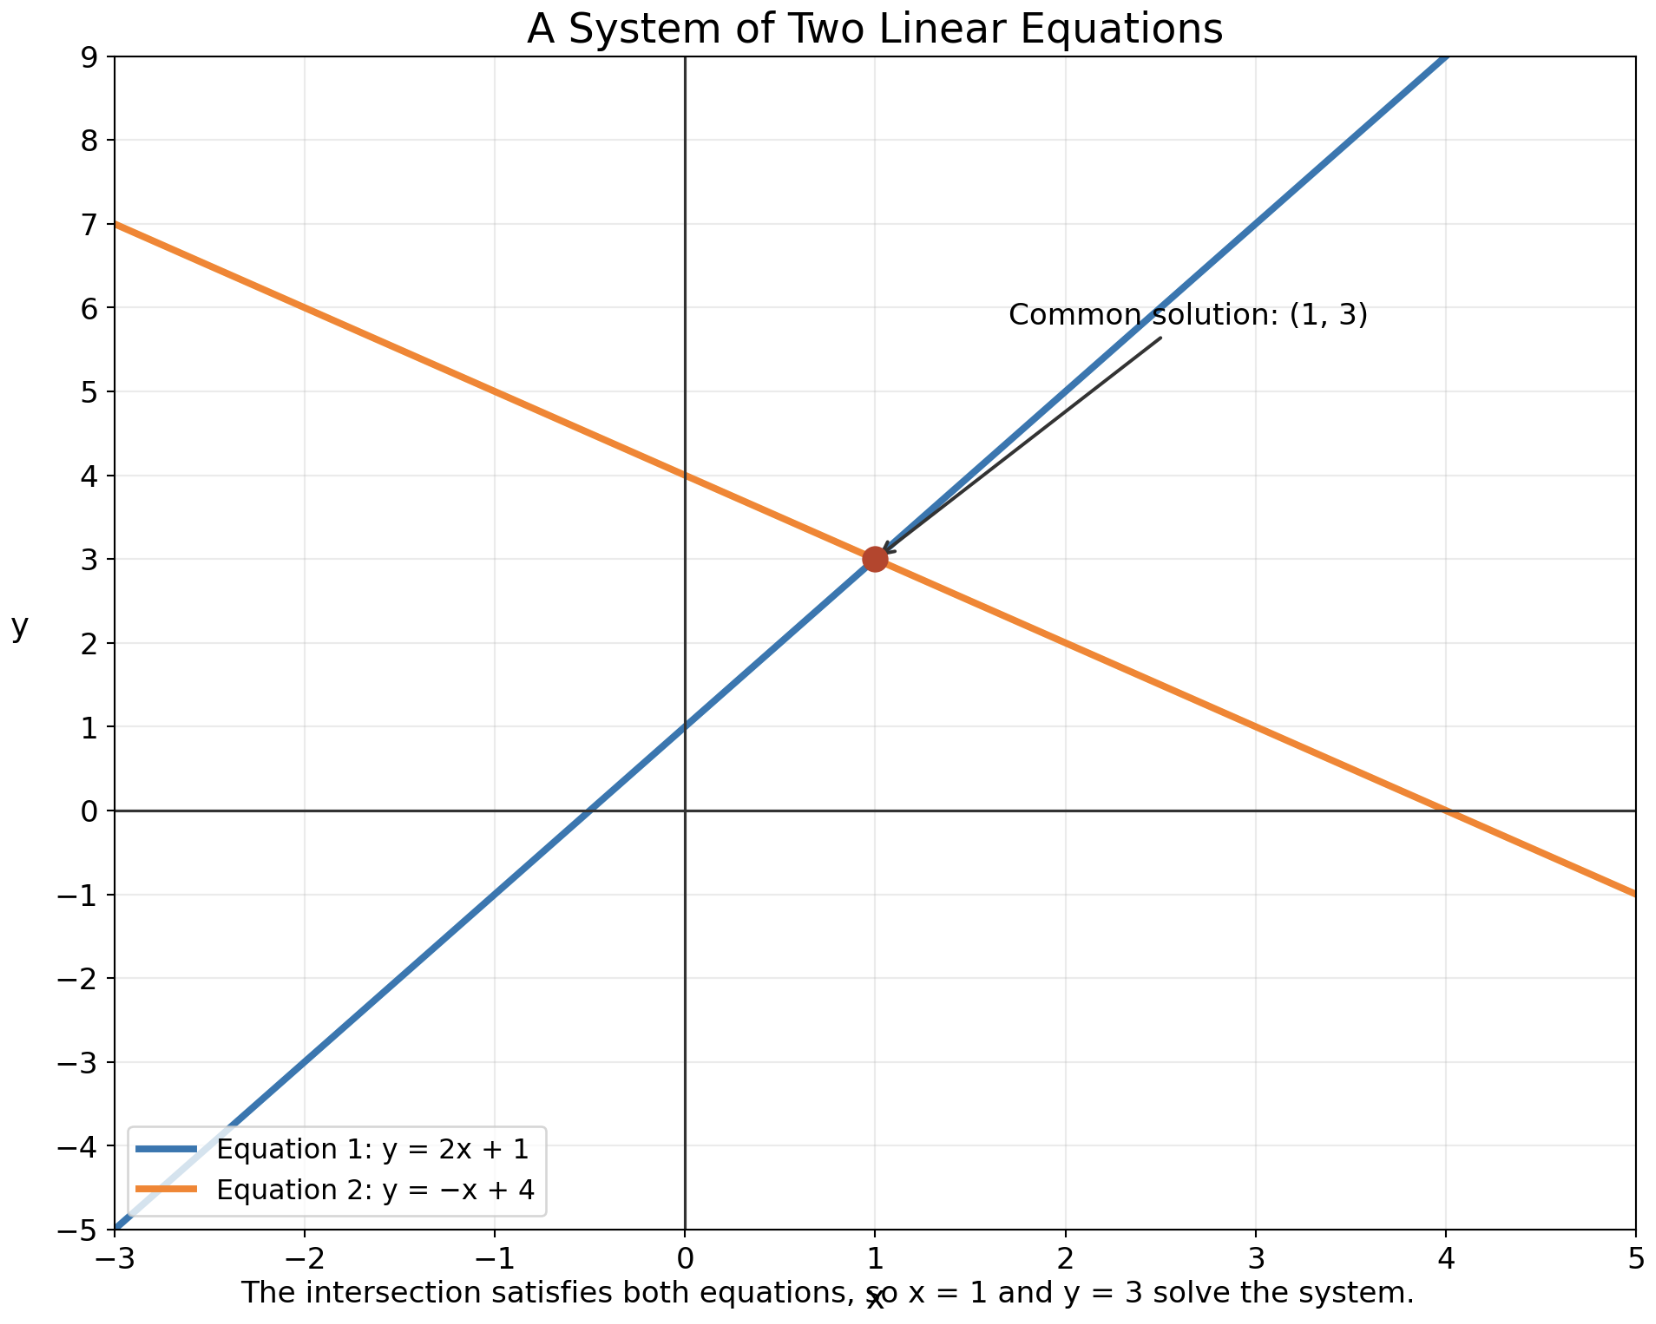
When two lines intersect, the intersection point lies on both lines.

Therefore, the intersection satisfies both equations.

That intersection point is the solution to the system.

For the system shown above:


y = 2x + 1

y = −x + 7

the two lines meet at:

(2, 5)

Therefore:

(2, 5)

is the solution.


Why the Intersection Is the Solution

Consider the first line:

y = 2x + 1

Every point on this line satisfies that equation.

Consider the second line:

y = −x + 7

Every point on this line satisfies the second equation.

At the intersection, the point belongs to both lines simultaneously.

Therefore, its coordinates satisfy both equations.

This connects the algebraic meaning of a solution with its graphical meaning.


Checking the Intersection Algebraically

For:

y = 2x + 1

and:

y = −x + 7

the graph suggests the solution:

(2, 5)

Check the first equation:

5 = 2(2) + 1

5 = 5

True.

Check the second equation:

5 = −2 + 7

5 = 5

True.

The graphical and algebraic results agree.


Solution or Non-Solution?

Consider:

y = x + 3

y = 2x + 1

Test:

(2, 5)

First equation:

5 = 2 + 3

True.

Second equation:

5 = 2(2) + 1

5 = 5

True.

Therefore:

(2, 5) is a solution.

Now test:

(3, 6)

First equation:

6 = 3 + 3

True.

Second equation:

6 = 2(3) + 1

6 = 7

False.

Therefore:

(3, 6) is not a solution.


A Table Can Help

Suppose we have:

y = x + 2

and:

y = 2x

We can calculate values for both equations.

For x = 0:

First equation gives:

y = 2

Second equation gives:

y = 0

Not the same.

For x = 1:

First equation gives:

y = 3

Second equation gives:

y = 2

Not the same.

For x = 2:

First equation gives:

y = 4

Second equation gives:

y = 4

The equations produce the same value.

Therefore:

(2, 4)

is the solution.

https://images.openai.com/static-rsc-4/cZcgzFAG5RlRUrpaBuMpNnLb8Ay8ioABUX4fOWiIj0gW_5zRHZiju-mJH8BXc6vdhwJHuyuk9VCQpF4joPGrMQUjK0JalXTKHiOjtbxhvQHzdKkO_NiKSnhO3kXKAQuqWT2BwQ_7GDPyovSOYWVvHN_fAA8KMZ7tEpBGT-NMCKTgM1dqENVlHulG85CcICOX?purpose=fullsize
https://images.openai.com/static-rsc-4/uy_ql4qkWtc8z9e-DGezRrRAQ5oHb6YY64lcgeYd2gJxLaXZpAHraruAS9L8e2CbEXbwlWju5vFjPbLhz1D38cjo7Rot7NhhlPqW_G4krERdXRFUTdrf1S6L0lI9jtONnhWhpDPAOymb_yoezUvghTkAjXPZPVW2Nt9Hl5g-RHdZw5BA1u9AkduVubUk6HWt?purpose=fullsize
https://images.openai.com/static-rsc-4/U-3xvyjrFaRecVlaqWB_WSUuyq7vGuOEl-of1o0dcvUgzv91BtTl58JXAnXjwo6UoW3c7mMiQz2UHmqktEUuTkbFO0TI-LOezqkIhU4SLPxjQJC2XqTN6oNmM45oI6b6uQ2ljzkcORKBX4Kfx3t7FepeHhiYSj0TalGUvzyJRTlrevVZ5xXMTiIh5fKJns8t?purpose=fullsize
5

Systems Can Represent Real Situations

Systems of equations are useful because many real-world problems involve two conditions that must be true at the same time.

Examples include:

  • Comparing phone plans
  • Comparing taxi fares
  • Finding when two objects meet
  • Comparing wages
  • Finding quantities and prices
  • Determining break-even points
  • Comparing savings plans
  • Finding dimensions
  • Analyzing supply and demand

The solution tells us where the two conditions occur simultaneously.


Worked Example — Comparing Taxi Companies

Suppose two taxi companies use different pricing systems.

Company A charges:

C = 3d + 5

Company B charges:

C = 2d + 10

where:

C = total cost

and:

d = distance in kilometres

The system is:

C = 3d + 5

C = 2d + 10

The solution tells us the distance at which the two companies charge the same amount.

Set the costs equal:

3d + 5 = 2d + 10

Subtract 2d:

d + 5 = 10

Subtract 5:

d = 5

Now calculate the cost:

C = 3(5) + 5

C = 20

Therefore, the solution is:

(5, 20)

In context, this means:

At a distance of 5 km, both taxi companies charge $20.

https://images.openai.com/static-rsc-4/UtvZ4J57AiktpPQjhQqg5vlecc_mVmJmW36b9FBx_xz6eSruyR_Uw__kPIGn8rYlEd76ZxCx2C0IDwpGGzJ4_1HV0skx2AONvuY04-LkD3v4Wx0WUCcxqkqpdf_MaMDDCF2r6ggUwe2tQk-Srpu5N6bUSUAIpGPbRTxz045308vZ6tyzuwb4eIX-s4fnZM7t?purpose=fullsize
https://images.openai.com/static-rsc-4/8AcmdQLo5OPAV-SFUKOP_j7rJDNWvtZOtNzJCrldNQvUBII351HNKFUMZ0kDLciQ_Mac4uNUxR2Nw9eemDgLK93WnAvybSJIyBY87-DnHrqAq37m0TOGD1Xd_PkO9jMkDy6eelN76gG4KN5ZJbrwOsmu2oEq830vXRUjkUv4wvAqTShfevQCDyGaky-Nplb_?purpose=fullsize
https://images.openai.com/static-rsc-4/O1fV2hcH9lULGWPFOpjAQBVsXCb-XedR5GaZfXrYup_2fVJwM9cGDPvltRrYoQoWfQqgro0naHzboznAiiiWTENzKGJ9pJdgneXlPRJwdQ-R9A3XS4infB_zG6exNllSUYPyWaEPp159Z4ipMOQc1Z-ct2UtJgqZSBqKe7RUoCAHxPLmNdrbx2Hwbi-F1j-p?purpose=fullsize

Interpreting a Solution in Context

Finding an ordered pair is not always the final step.

You should explain what each coordinate represents.

Suppose the solution to a problem is:

(8, 42)

That could mean many different things.

Perhaps:

8 hours and $42

or:

8 kilometres and 42 litres

or:

8 tickets and $42

The meaning depends on the variables in the original problem.

A complete answer should include the units and context.


Worked Example — Savings Plans

Two students are saving money.

Student A starts with $40 and saves $10 each week:

A = 10w + 40

Student B starts with $70 and saves $5 each week:

B = 5w + 70

The solution occurs when:

A = B

So:

10w + 40 = 5w + 70

Subtract 5w:

5w + 40 = 70

Subtract 40:

5w = 30

Therefore:

w = 6

Calculate the amount:

A = 10(6) + 40

A = 100

The solution is:

(6, 100)

In context:

After 6 weeks, both students will have $100.


Worked Example — Two Moving Objects

Imagine two cyclists travelling along the same route.

Cyclist A's distance is:

d = 12t

Cyclist B has a 20 km head start and travels at 8 km/h:

d = 8t + 20

The solution tells us when they are at the same location at the same time.

Set the equations equal:

12t = 8t + 20

Subtract 8t:

4t = 20

Therefore:

t = 5

Calculate the distance:

d = 12(5)

d = 60

The solution is:

(5, 60)

In context:

After 5 hours, both cyclists are 60 km from the starting point.

https://images.openai.com/static-rsc-4/0fk4TWgt5K3fegpqQK0WZgPfD1ChGYBpn3ccvutQAJDB4sONdVNIhfy_KyPFIRkhUZdURlnB8vp4WAHhgpi62Sq9m23g4TGSaqqG3zXxduvwEayT_2YLRjc804_KPF5bB2TzuePklp4fAZJ29ImXSB0tHrhAgf8TPRiHXV4R_S0MkAdetSjjtv6WQ1RK-USP?purpose=fullsize
https://images.openai.com/static-rsc-4/E2qe-ToPQ1sGPT53d7be_ZZEZ9dfsCMfgKwe3ozUrL_euYSUzdjvSDAKWlL7hrEqVyqi-G9KwR3rSUdQ0LVqmYZSf3VxSGWISSJ_haM9mV7vbvHKHB8_hH5SqUftlXjF-TJB_tvuwGSjQqBUSIa001Nuf497R9_2B3dr4o0AfsfiajPtMe4Y6DP91702IKnF?purpose=fullsize
https://images.openai.com/static-rsc-4/tSmkHYGqkIKxsWnbBWyu8FCASzsXkVxmJ_tn7_bze2QhopB_6vmSFGYlJzguACBKmVrEALjLU4vhCGbZN1dix17XKs7dTQVao-fHsJldX_QEuOc-75LI8-r5UTR8jLQJcY_zhdW461RRFtHSqsLfc4W84KYn0jYiI90SEVmvC74ExsvS-N_r5DotvRgzhfPE?purpose=fullsize
5

Not Every System Has One Solution

Two lines do not always intersect once.

A system of two linear equations can have:

  • One solution
  • No solution
  • Infinitely many solutions

These possibilities can be understood by looking at the graphs.

https://images.openai.com/static-rsc-4/G87IQoH7Yy0bcQ5XphrdDiYJEKXAqP70y0rW4pmWlCC-oGOhLjnvve671EgsXuVYVx7A6mZZ9iUUHvE8TiKOwgvkkRnJga-ZnVeVfcCgB6UxpcljwC74qU_tEcn9KwDHVzQHKql-uEPIusFsVJBh-b1iLDfnE5LZTpLdv0X8fXSKNpuBaAhmzQBfmX4aZ3YH?purpose=fullsize
https://images.openai.com/static-rsc-4/jaGPoI3duDO4LvVsPOlkIUp0WhthxaOx6D6cuWiRvkd76-RDKEASGmUoELfTjQLZC4eaEw9QtYy-Pp3_COvKMzJobAgG36l8BTg5bWgBM-2FkStvh87CndoR5sS2s1M581LYnpagG3EwjxhRFAdHIL1B2oyEaKSVXX7Bjdqlt-06h9EPgNoQFmXI4NIyfNGQ?purpose=fullsize
https://images.openai.com/static-rsc-4/QJW2VFUjOtEAYHhiCUQw8MVkKg29A-g5uUIpbb9_90Uc1xQj5gous5HdN5OAjHP3YN1iKJh0oDi1ApLWGPv60I98l6HLoue6XDzDLpd3FAP4cBHA4cF5XN-k2NVgmzfgR8tvvfhWfmRSIrPmy-aiEfBo5ZyFFWSWk--LKGCyhgpT3HoxnHozC2I2EXbgyycK?purpose=fullsize
5

One Solution

If two lines intersect at exactly one point, the system has one solution.

For example:

y = x + 1

y = −x + 5

The lines have different slopes and intersect once.

Their intersection represents the single ordered pair that satisfies both equations.


No Solution

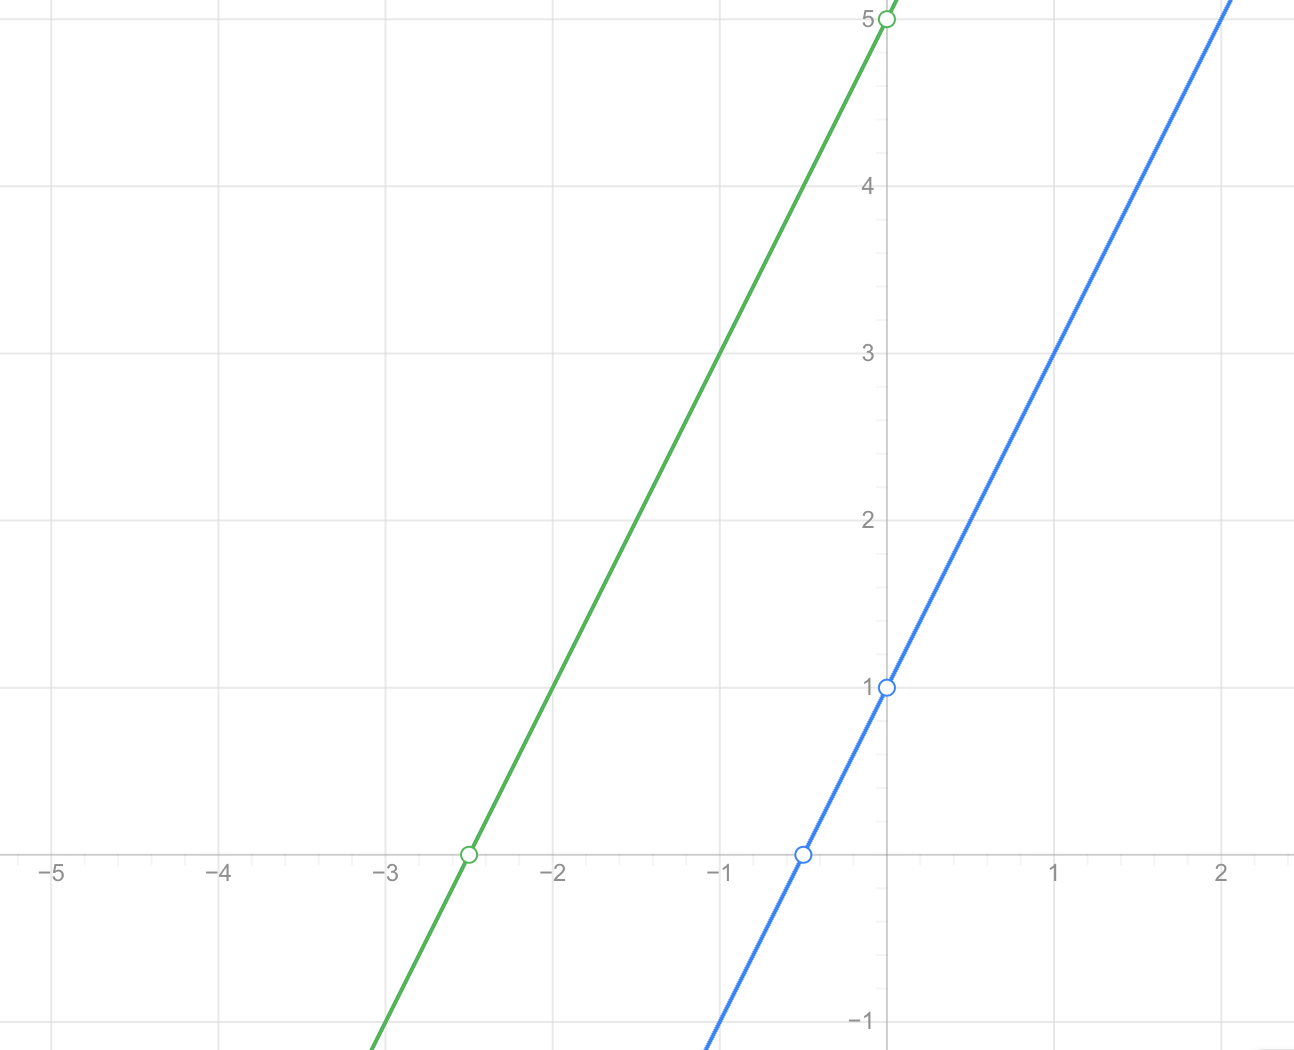
Consider:

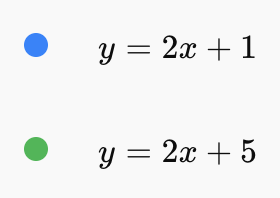
y = 2x + 1

y = 2x + 5

Both lines have the same slope but different y-intercepts.

They are parallel.

The lines never intersect.

Therefore, there is no ordered pair that lies on both lines.

The system has:

No solution


Infinitely Many Solutions

Consider:

y = 2x + 4

and:

2y = 4x + 8

Simplify the second equation by dividing everything by 2:

y = 2x + 4

The equations are actually the same.

Their graphs lie directly on top of each other.

Every point on one line is also on the other line.

Therefore, the system has:

Infinitely many solutions


Recognizing the Three Possibilities

Graphically:

Intersecting lines → one solution

Parallel lines → no solution

Same line → infinitely many solutions

This gives us another way to interpret what a "solution" to a system really means.


Verifying Solutions Efficiently

Suppose you are given the system:

2x + y = 11

x − y = 1

and asked whether:

(4, 3)

is a solution.

You do not need to solve the entire system.

Simply substitute the values.

First equation:

2(4) + 3 = 11

11 = 11

True.

Second equation:

4 − 3 = 1

1 = 1

True.

Therefore:

(4, 3) is a solution.

Verification can often be much quicker than solving.


Using a Solution to Check Your Work

Suppose you solve a system and obtain:

(3, 7)

Before accepting your answer, substitute:

x = 3

and:

y = 7

into both original equations.

If both equations become true statements, your answer is verified.

If either equation becomes false, there is an error somewhere in your solution.

This makes substitution a powerful checking strategy.


Common Mistakes

Mistake: Checking Only One Equation

An ordered pair may satisfy one equation but not the other.

A solution to a system must satisfy every equation in the system.

Mistake: Reversing the Coordinates

For:

(3, 7)

use:

x = 3

and:

y = 7

not the other way around.

Mistake: Substituting Only x

Both coordinates must be substituted correctly.

Mistake: Ignoring Negative Values

If the point is:

(−2, 5)

then x is −2, not 2.

Using brackets can help:

3(−2) + 5

Mistake: Assuming Every System Has One Solution

Some systems have:

No solution

or:

Infinitely many solutions

Mistake: Giving an Ordered Pair Without Context

If the solution to a real-world problem is:

(5, 20)

explain what 5 and 20 actually represent.


Key Terms

System of equations – two or more equations considered together.

Solution – values that satisfy every equation in a system simultaneously.

Ordered pair – two coordinates written as (x, y).

Satisfy – make an equation true when values are substituted.

Substitution – replacing variables with known values.

Intersection – the point where two graphs meet.

One solution – exactly one ordered pair satisfies both equations.

No solution – no ordered pair satisfies both equations.

Infinitely many solutions – every point on one equation's graph also satisfies the other equation.

Verify – check that a proposed solution satisfies the original equations.


Check Your Understanding

1. What does it mean for an ordered pair to be a solution to a system of equations?

2. Determine whether:

(3, 4)

is a solution to:

x + y = 7

2x + y = 10

3. Determine whether:

(2, 5)

is a solution to:

x + y = 7

x + 2y = 11

4. Why is satisfying only one equation not enough?

5. Determine whether:

(−1, 3)

satisfies:

y = 2x + 5

6. Determine whether:

(4, 2)

is a solution to:

x + y = 6

2x − y = 6

7. Two lines intersect at:

(5, 8)

What does this tell you about the corresponding system of equations?

8. What does it mean if the graphs of two equations never intersect?

9. What does it mean if two equations produce exactly the same line?

10. Explain why substitution can be used to verify a solution.

11. A system describing two savings plans has solution:

(10, 250)

If x represents weeks and y represents money saved, explain the meaning of the solution.

12. A system describing two vehicles has solution:

(3, 180)

If x represents time in hours and y represents distance in kilometres, interpret the solution.

13. Explain the relationship between the intersection of two graphs and the solution of a system.

14. A student checks a proposed solution in the first equation and finds that it works. The student immediately says the ordered pair is a solution to the system. Explain the error.


Key Takeaways

  • A system of equations contains two or more equations considered together.
  • A solution must satisfy all equations simultaneously.
  • For two variables, solutions are often written as ordered pairs (x, y).
  • The order of the coordinates matters.
  • An ordered pair can be verified by substituting its values into each equation.
  • Satisfying only one equation is not enough.
  • Graphically, a solution is a point that belongs to both graphs.
  • For two intersecting lines, the solution is their intersection point.
  • Parallel lines have no solution.
  • Identical lines have infinitely many solutions.
  • Substitution is an effective way to check a proposed solution.
  • In real-world systems, the coordinates of a solution represent actual quantities.
  • A complete interpretation should explain what each coordinate means and include appropriate units.
  • Systems of equations are useful whenever two conditions must be satisfied at the same time.

Did You Know?

Systems of equations are used in navigation, engineering, economics, computer graphics, and science. GPS technology, for example, uses several simultaneous mathematical relationships to determine location. The underlying idea is similar to solving a system: finding values that satisfy multiple conditions at the same time.


3. Graphing Linear Equations

Learning outcomes
  • I can graph linear equations in two variables.
  • I can identify the slope and intercept of a line.
  • I can graph equations from different forms.
  • I can determine whether a point lies on a graph.
  • I can compare graphs of different linear equations.

Graphing Linear Equations

A linear equation in two variables describes a relationship between two quantities whose graph forms a straight line.

For example:

y = 2x + 1

contains two variables, x and y. Every ordered pair that satisfies the equation corresponds to a point on its graph. When these points are plotted, they form a straight line.

Graphing linear equations allows us to see relationships visually, identify patterns, compare equations, and solve many real-world problems.

https://images.openai.com/static-rsc-4/LdbOEb7KSzTc_IAyzGYxQ-cWInDDagzD97dpoXJrsNn34Afx67jNE5cjxRQBcZaTUcJ92ydYoPlhylRReUOSUO816dYoMsUETdcHkPFavUAfY7_Yw4CV_gtfMTBGTOS7t3lMF8ZzmC_w9A2cSyPvQUdSqrwgTcS3CZ-pagGnc_ZGqc35L6T5Gp1lzsYhHZwg?purpose=fullsize
https://images.openai.com/static-rsc-4/WBqWqY8tlSoNyYZsDNMX0R_qQQDjHvHEnIiRwncrYIulb9J4rsRqjga3CJ70YyjHWD5I_JrXo_075WhpCZSvz6Zby_rXgx_BMvwTesG0p838LJfhSv7_EPm_0tSm92iBPtuIz6pDCBIZeT6NkUcB-mbz26dL0MPeIW_y5BKk5KgNoTLn0XiXOqZU4LPFzkk-?purpose=fullsize
https://images.openai.com/static-rsc-4/OsErlIAGlUhHRLqeVBPWm1U76WTWMmlb9I3fO_lLNIbtAa5WiQhpIgu_b-Qt6qzLMdYt5xzIvFLpfiPfI67fmKbV_cgIqcrVk2PPoVRyZqalyYnPZ3Y9SwDm0sBIA3ImQRpjQmDEZ5ci0QYgTA5dXxUezVRaDC_gsNqvFrje87QIR3MOM4GFX17RbwwUMH8i?purpose=fullsize
5

Learning Targets

  • I can graph linear equations in two variables.
  • I can identify the slope and intercept of a line.
  • I can graph equations from different forms.
  • I can determine whether a point lies on a graph.
  • I can compare graphs of different linear equations.

Linear Equations in Two Variables

A linear equation in two variables usually contains:

x

and:

y

Examples include:

y = 3x + 2

2x + y = 8

x − 2y = 6

y = −4x

Although these equations look different, each produces a straight-line graph.

The variables can represent many different quantities, such as:

  • Time and distance
  • Number of items and total cost
  • Hours worked and earnings
  • Temperature and time
  • Distance and taxi fare

Points on a Linear Graph

Every point on the graph of an equation represents an ordered pair:

(x, y)

that satisfies the equation.

Consider:

y = 2x + 1

If:

x = 0

then:

y = 2(0) + 1

y = 1

So:

(0, 1)

is on the graph.

If:

x = 2

then:

y = 2(2) + 1

y = 5

So:

(2, 5)

is also on the graph.

There are infinitely many points that satisfy the equation.


Understanding the Coordinate Plane

A coordinate plane contains two perpendicular axes.

The horizontal axis is the:

x-axis

The vertical axis is the:

y-axis

Their intersection is called the:

origin

with coordinates:

(0, 0)

https://images.openai.com/static-rsc-4/5iGWqaAdFhY5LE8eQjcEPkC9FY1qLrsBldVW8GPb9h3PaXP7bzNPQXtUQ2Y1rSf8vskddUbOVnEI04Winb8ruHbMvDE-Ky3aPCcxRX9IfQ9PK6t7yGJ-7wimTMTbTna1IFxsyAus7nWUEboR77PdfCHV7aZAElxs8BVt-HfK4S4UYmPdS_oDEEnDCp6VRdJV?purpose=fullsize
https://images.openai.com/static-rsc-4/poJKEafYuT6oa3SiROwS5IT191WshSAeDrKvqleZ1WSEKk_K57saV-s7yit8NIok7Hv3_WTuj9CaLjmQqOWMVqIkrUE9JrML8cw3mO_VxjLHVNBKM81kBWjie9AEyby8h_8Prf60TQVKoTEggtlJTAX8KChzORSyY2HrMx_5zCxpWw5vLqv3uuOUds5B3lIY?purpose=fullsize
https://images.openai.com/static-rsc-4/WXNKlmdAWrGVBWjL_I2J8SFX3tZsd8gCNC6aL8An3ExrLcj95gIlT9QHiLTfcSQUN7SmzFMdbafvVT7l_xo50W6FAQyeo9ba_9mjhLOdvsPVaDkzfdyBoWkIYeEYl342J8Ubb1NO1QNdHek2Io_-UFFuHF2u-uGgFbnmCQw4ihLW7Hk2gPsA3d2zbXYmu-Li?purpose=fullsize
5

An ordered pair is written:

(x, y)

Always move along the x-axis first and then vertically according to the y-coordinate.


Slope-Intercept Form

One of the most useful forms of a linear equation is:

y = mx + b

This is called slope-intercept form.

In this form:

m = slope

and:

b = y-intercept

For example:

y = 3x + 4

has:

Slope = 3

and:

y-intercept = 4

This form makes important information about the graph immediately visible.

https://images.openai.com/static-rsc-4/Dqk_KcXkE7R7ohrPhJencC79IVQRNx9o68bIS0oUI_bdEghMecTQSXEqDSTcl1ULjSJ6EuNCTgDViMsVRg8Ju80J9X6sxL-Ju201v1B7_aIgg5-SC2MOUUbRV6hjHqUM71pLFPzja4mPZ_9SpppmX_vOZ8eSPuKaJFXef1zRX-wDvJnuoNJIHkt-t4oPKqX6?purpose=fullsize
https://images.openai.com/static-rsc-4/8iv-cjUr_HQhURXOTBtWtyba4OJJrDUscimQy6ZhY2bMb5V6847TooxxD4Tm89yoISpCYMFaO3P_yO0AGhrhgszgLprSsMzJQh1XP3QZShct55UQ0yvfKwPksUcIUQl3v1KLBUTGF9yIPEV9CbCvMtz8M69lMaTD7g6pyKwNhUecMn6fxNMaO0cCl4pHRESa?purpose=fullsize
https://images.openai.com/static-rsc-4/DZYXhIfGKVptimK2r1VC3Y_XIekvMuJysvnLX69ZypJh0kWNQuF0YiUH8Lk26XMMo14gNdvEc72Z7Nxj1nr5WfOeU14681jLYCAjpyJywiENjFmC6vCL1ofaZC1QSU1d-jzTBF23RZsP2fO2k4MR2Xi7oym32zCefsFGtN439XBx78v2lVm8hu1wJw4-BV6M?purpose=fullsize
5

What Is Slope?

The slope describes the steepness and direction of a line.

It tells us how much y changes when x changes.

Slope can be calculated using:

Slope = change in y / change in x

or:

m = rise / run

The rise represents vertical change.

The run represents horizontal change.


Positive Slope

A line with a positive slope rises from left to right.

For example:

y = 2x + 1

has:

m = 2

This means that whenever x increases by 1, y increases by 2.

https://images.openai.com/static-rsc-4/hcO0My5dRjk5bveBSl5jArQKuS9aTw2NXe3pEHy2RYADZbT345kWb156ZA5a59G1_gce0YK4KLDTxkR5i7fTPozmYC5MEfjATM3z4RGa5hl_syl6jXLZJFD9_TjuSdAWRUVhZw8wZ9PQFuQtV3ZHgt4eZ-O95DJS099kLu7cK4_pQozOxEv2iwaX9Lqm5AeK?purpose=fullsize
https://images.openai.com/static-rsc-4/LdbOEb7KSzTc_IAyzGYxQ-cWInDDagzD97dpoXJrsNn34Afx67jNE5cjxRQBcZaTUcJ92ydYoPlhylRReUOSUO816dYoMsUETdcHkPFavUAfY7_Yw4CV_gtfMTBGTOS7t3lMF8ZzmC_w9A2cSyPvQUdSqrwgTcS3CZ-pagGnc_ZGqc35L6T5Gp1lzsYhHZwg?purpose=fullsize
https://images.openai.com/static-rsc-4/W9zex_hnIVXHosvLYtitm0_h-lQXnmrhEvGWtBGIHWJkh9jNIKoHaQagVGD0uKr3Dcp51OOkCZHuOEZrqzdbYlUx532jAgTab9L6pguJhvD_5TIyjySi_Uo32aThXeXfe5ReHzVlStRdtzU4vq0pRok-h3RwMTLjdH5xQ4akTkPrKpgsjh2FqhI_N-YmBxPJ?purpose=fullsize
6

We can think of the slope as:

2/1

So from one point, move:

1 unit right

and:

2 units up

to find another point.


Negative Slope

A line with a negative slope falls from left to right.

For example:

y = −2x + 5

has:

m = −2

This means that when x increases by 1, y decreases by 2.

https://images.openai.com/static-rsc-4/UNDisOEPHPrBulf-qgY-JoK8koLOO0wLEMGg6eA5qi0CivQnnjGwpurMU1kfFCSUAHFZxMlF-IQ346EoKYMHUsvtj8tQM6EVP-c9X9CABANYUulTaMEmkYwlek9mHMe9yI_AdieScKwqQLgYlMX2FdANy5evK1r4BN-E106MACrKLl_o4gRNHjx_xwUMvnZ7?purpose=fullsize
https://images.openai.com/static-rsc-4/6EKws3quPVtAowWP-JQ19VUvaNjoFPTOCZ65hyUlWH2PrV7Mc2Z44UeTcL7STvySFGJcOrBH5L8YX9Htzb065w0swW8Ozi0f4EYQYb7GruDQLWnBQDxXl8ihV6zRnofMQVlR4K_jSqQVzUMuAUEqkwDjM870gJU5XBS9rGefRaAsnYzbIB2hshN55phfKhqY?purpose=fullsize
https://images.openai.com/static-rsc-4/ObFRIxOy4eOdKnXKLw8RTTxdmJwlF5CF3ZxSdI0y0N56YpE9mapDv1mQLuVZ7Ze3gB9gtMJnpTc7YtYz4dkHQUubFIwTcqAjnEfP0sBWyYPUv5uHjC8sx9yLg5T4Nongyrd2tkhE_SBhycDBr47uLVH9C7O3XU5HAXk_G_L7BnjBNVYi7Bz557GVh2KJjcoW?purpose=fullsize
5

A negative slope represents a relationship where one quantity decreases as the other increases.


Zero Slope

A horizontal line has a slope of:

0

For example:

y = 4

Every point on this line has a y-coordinate of 4.

As x changes, y does not change.

Therefore:

change in y = 0

and the slope is zero.


Undefined Slope

A vertical line has an undefined slope.

For example:

x = 3

Every point has an x-coordinate of 3.

The line is vertical.

https://images.openai.com/static-rsc-4/87Rg7pHTJM1WLQ3cWEFo9FGg0-VESYqlN82_9JtjFPsozyqT1M9cBvbh4zyeobpaVkYZwnapgEg3lCaIzS5ra6c4cAVKMIGWlbiKm1qJLuJCqC0HTxdhDBf-IoNfVtj9i90B10iBVnRn8tFO3usxB5g72LSl9XRjY-PjjbnyqBhE6Mo5SUUPQRXyt-qqpJUw?purpose=fullsize
https://images.openai.com/static-rsc-4/BUSqVUqE0KQ4TPODpPhKxCBfzVXv0HKTyDIMontDqRJ0XaE5pOzI4pvlzgicc1_yE5SdmrChbkwnH6VdP-EB2G8eIOwcpNFd3NYYjkNZBfkHVjwjqHGpUUkjpB04OWvHG_SPiqtU9CI3qxhDLCqnESlfqs8w3bD5ISj8yjoRWdQYMEAQ74rUHXrdURpUyAuz?purpose=fullsize
https://images.openai.com/static-rsc-4/2OMQqDDKHCvfMQU2suLViVzIhzTPAaFkZbsI1mDFA85k9RDUshZ-oiTAWaxX5qJ6Lfz0_YkZXfet9vRvHqJ8n9t6geIki-r0VWca13gKWc2TtxaZuxbqpQcAUJOevtCU6IP7TyrbMFLfsFy41AJVG1WbfLsriXpfIq1Pg_Yy7F4_9yM82p0uH9bypiBmEqS2?purpose=fullsize
4

Because there is no horizontal change, the calculation for slope would require division by zero, which is undefined.


Understanding the Y-Intercept

The y-intercept is the point where a line crosses the y-axis.

At every point on the y-axis:

x = 0

Consider:

y = 3x + 5

Set:

x = 0

Then:

y = 3(0) + 5

y = 5

Therefore, the y-intercept is:

(0, 5)

In:

y = mx + b

the value of b gives the y-intercept directly.


Graphing from Slope-Intercept Form

Consider:

y = 2x + 1

We can identify:

m = 2

and:

b = 1

Start with the y-intercept:

(0, 1)

Then use the slope:

2 = 2/1

Move:

1 right

and:

2 up

This gives another point:

(1, 3)

Repeat the pattern and draw a straight line through the points.

https://images.openai.com/static-rsc-4/BMW8tgIDjwwSmEqKuoiGzgO7uXLu9q6vqwKRmglfhEQ1haJqMWlvymrNZdmC6HyPg-4DcF5aM5wn-WwNyF7jYCaONY7rv5KQOOLziR6k3KbM5z2c297RFhNzK2XL2B7cpzTK9NY4fRyPYNKMhNGtn9sK4yHYG4MOzF7hrKc_lBs_wN7Jmtpt-IYgJKRItt5N?purpose=fullsize
https://images.openai.com/static-rsc-4/Tc7E8LE6afUNKkxMCjeC9cZNnNzAxoT3ob_la1JunC6jIaTyG79CQIVwnxwGq5qWR23e48X_lAMBybSlYAL4wpcpsZfuDYZGFq4MXpIrPd3uireDUND2QvELixP0jp1JL-ltvLHX7hsFdziV1BrVuLUy5Ehesb4LXprqUUuRz6uFWOcwRc4QrB1z_4DUEGTE?purpose=fullsize
https://images.openai.com/static-rsc-4/yTOO2FP2oQH64K2A1DMimroaKEWJDglCEvgJAWz0zhBmZK37jszyBnwlf1beKBMrh34pYzX675HL54hhHydKulGPzQ6Cm6WkiPk5LyH0TP2A1QtvWNL5VWUokDfop0_TV9XjWE7B7mJIRk-lQjm0dfOt3xJoWJJjDq4TaZRUU0NfrUIAWi4JI2PImszgVqjC?purpose=fullsize
6

Worked Example — Positive Slope

Graph:

y = 3x − 2

Identify the slope:

m = 3

Identify the y-intercept:

b = −2

Start at:

(0, −2)

Write the slope as:

3/1

Move:

1 right

and:

3 up

This gives:

(1, 1)

Move again:

1 right

and:

3 up

This gives:

(2, 4)

Draw a straight line through the points.


Worked Example — Negative Slope

Graph:

y = −1/2 x + 3

The y-intercept is:

(0, 3)

The slope is:

−1/2

This means:

2 right

and:

1 down

Starting from:

(0, 3)

we obtain:

(2, 2)

and then:

(4, 1)

Plot the points and draw a straight line through them.


Graphing Using a Table of Values

Another method is to create a table.

Consider:

y = 2x − 1

Choose several x-values.

If:

x = −1

then:

y = 2(−1) − 1 = −3

If:

x = 0

then:

y = −1

If:

x = 1

then:

y = 1

If:

x = 2

then:

y = 3

The corresponding points are:

(−1, −3)

(0, −1)

(1, 1)

(2, 3)

Plot the points and connect them with a straight line.

https://images.openai.com/static-rsc-4/HXv9UPoT4y769fgBAX_B6kP-ovsNqWPv_HqNUmi5JL0A0lD4FOGb7rNWFIUENd9TNahOCd1qaTWfu1hKCxudfhhEf-BHG72ua4CIu82N7aCmiYJ-V1wtzXFekaBkumceodCy8cz32MQ-ncEPR4i9gkbUIBWUMizUQxpDcma-g64RMH0RflEkBihDczNDdxE2?purpose=fullsize
https://images.openai.com/static-rsc-4/ZbRgjGa0RH80QLOsJXTU5zcjIR-N7E9qs4LPwectoFtO22F28QNbHyRBkEg8in2zz5ol9bQEEJvjwacl33cSLlowNQ7jxXlUcHWemsbLc8UWwg5oXuVpYdd3NDArXDh2XDu84ELKqaPpu7mwfLv1KVviIaq8KJy6-Jc2YoVDkghapk5JhMfv7p_dg7H2-zj9?purpose=fullsize
https://images.openai.com/static-rsc-4/Pzg5i-TW68kv8H3LEBKMJWoXq0zbz94ZTE6D4clI_mma17GKD4rwWTmNBrnXV5oSaQhj5n7QLoLrSwV6oZpwAAMTu6aRzhjvJT2Wo39cz7Q2AWhb_YE8QIYHGFd4KacL-ll4JFGulSTj2Qjx3W8JWMZiARcKUtJaKyuGbw7zWLfCNjoC7MIBFqeaZglGzlwr?purpose=fullsize
6

Why Two Points Are Enough

A straight line is completely determined by two different points.

If you know two points that satisfy a linear equation, you can draw the line through them.

However, when working by hand, finding a third point can be useful as a check.

If the third point does not lie on the same straight line, there may be a calculation or plotting error.


Graphing from Standard Form

Linear equations may also be written in standard form:

Ax + By = C

For example:

2x + y = 6

One method is to rearrange the equation into slope-intercept form.

Start with:

2x + y = 6

Subtract 2x:

y = −2x + 6

Now we can identify:

Slope = −2

y-intercept = 6

The equation can now be graphed using slope and intercept.


Worked Example — Rearranging First

Graph:

3x + y = 6

Solve for y:

y = −3x + 6

Therefore:

m = −3

and:

b = 6

Start at:

(0, 6)

Then use:

−3 = −3/1

Move:

1 right

and:

3 down

This produces another point.

Continue the pattern and draw the line.


Graphing Using Intercepts

Another useful method is to find the x-intercept and y-intercept.

Consider:

2x + 3y = 6

To find the x-intercept, set:

y = 0

Then:

2x = 6

x = 3

So the x-intercept is:

(3, 0)

To find the y-intercept, set:

x = 0

Then:

3y = 6

y = 2

So the y-intercept is:

(0, 2)

Plot these two points and draw the line.

https://images.openai.com/static-rsc-4/QrghwpbLddXV5ktT0MDge8G_HKf5cfO47VZwIS0O2OcA2oDR1lB25kkZ6Luaks_ozt3QVrDVlEWmo_uLHdhjazI3BQddamWYz0Hf3AATeCzSTjokkIYRJRDo78b65Ba25_u7ZfV983kiMIKwYrsyV93WtQn-DkyuwsBLCVHkJLHW13I6ILcs3uegj9r9fbm8?purpose=fullsize
https://images.openai.com/static-rsc-4/Ejyp62kPZOZb-In8V1qoMs9X5-5JmcOt1F-Jqj1QppNcYwbAXTVuoqYlZa1vdf72PbUDxQXhmXI_0J8RGCYpunz4ge6o0gwRuw1JMYP001BWIv-0dzFRh8bleb2P2JPUMJLr9VPjqXaJCeODjtju_qvlLm_4hF40UCHY3OGmUup4Zj0xfzndqZ0QFCOEI73b?purpose=fullsize
https://images.openai.com/static-rsc-4/630ojoRF3mBlnHmw-VkObhyhmnBFp6JGjBKNCtAEjJ2IzBz4v3ra9OoYhVRCqIFNa6ZwnnyuRNlwFreN4HGlakaIkEc_xaaFYdNqhqz9Vg0TiKJeXG1_iN_of4NLRSc1cNWG8-uIq91eXPYyWBashaAqNh1KCPvyiml4NNWbpk7ats1UFC4p4Ft9pRQ0Dnlh?purpose=fullsize
5

The X-Intercept

The x-intercept is where a graph crosses the x-axis.

At every point on the x-axis:

y = 0

For example:

y = 2x − 6

Set:

y = 0

Then:

0 = 2x − 6

6 = 2x

x = 3

Therefore, the x-intercept is:

(3, 0)


Different Forms of Linear Equations

The same line can be represented in different forms.

For example:

y = 2x + 4

can be rearranged to:

2x − y = −4

These equations describe exactly the same line.

Another useful form is point-slope form:

y − y₁ = m(x − x₁)

This form is useful when you know:

  • The slope
  • One point on the line

Worked Example — Point-Slope Form

Suppose a line has:

Slope = 2

and passes through:

(3, 4)

Use:

y − y₁ = m(x − x₁)

Substitute:

y − 4 = 2(x − 3)

Expand:

y − 4 = 2x − 6

Add 4:

y = 2x − 2

Now the equation is in slope-intercept form and can be graphed easily.


Determining Whether a Point Lies on a Graph

A point lies on a graph if its coordinates satisfy the equation.

Consider:

y = 2x + 3

Does:

(2, 7)

lie on the line?

Substitute:

x = 2

and:

y = 7

Then:

7 = 2(2) + 3

7 = 4 + 3

7 = 7

True.

Therefore:

(2, 7) lies on the graph.


Worked Example — Point Not on a Line

Does:

(3, 5)

lie on:

y = 2x + 1

Substitute:

x = 3

The equation predicts:

y = 2(3) + 1

y = 7

But the point has:

y = 5

Therefore:

(3, 5) does not lie on the graph.

https://images.openai.com/static-rsc-4/SttOhfq5VbZSrPR_0MbISXNfWXjaqkJRP-6LRZ9Ad-ueAizBbsWH7fag8kHZxWq2N3fJ9Tny76rssH_xcsdizYXHmRO4yjmzpQbpCrwITGSbH6G8E6BtVIeinOtZxBTS5ebwFKPvrdTs2dfiE0yzkWCTV44GNKkxvmLKsFWMGD7AGDHLYa8amHmm3Cl9zc9O?purpose=fullsize
https://images.openai.com/static-rsc-4/XxmykjBJpQApB5aXye1FDNum4A7C2iVlvQpVHT3JB171Wx2BavareyOsWo_rKs3aES6kZRVreEybzbyh5cjnBxHJxeXBZaibtiDm4qaa4ET_lWuG_ZtSiOK2r2z8qUPF6X2AqV7eOM-wTbSZg5k-Nlj4qKIw6_H-hm2PHiYOnxOP6CPEtJ-U6biA88ArNTUs?purpose=fullsize
https://images.openai.com/static-rsc-4/Xvq8EWykOUqj0HDlXIBAPhwrvhFIUKWwQMw9pE-NX9Ibh5G9Gc_CQdJ-54LnhGn235Yt6taixyDHKdZDJZdxnIrznbP-3mq5x82mQFCOF6G8A0PLQzejtFghjvep7oFZd0YD9o3oEKJ9e9Y2AtztZeWewG3mk-AtTvZjDoGbpFlcW6OFq-AkvZLaJOqwSkJR?purpose=fullsize
4

Comparing Slopes

Consider:

y = 2x + 1

and:

y = 5x + 1

Both have the same y-intercept:

1

But their slopes are different.

The first line has:

m = 2

The second has:

m = 5

The line with slope 5 rises more rapidly.

Therefore, it is steeper.

Slope allows us to compare rates of change between linear relationships.


Comparing Y-Intercepts

Consider:

y = 3x + 2

and:

y = 3x − 4

Both have slope:

3

But their y-intercepts are different:

2

and:

−4

Because the slopes are equal, the lines have the same steepness and direction.

They are parallel.

https://images.openai.com/static-rsc-4/JYCItrntZ8rBWeRsiysvwln3jXQExWov_rrLbv2LopWgSoBNIXNb6WqzDx-T_ymRQhB9D-9K8oI7DPZoTgPXuTwNX6tCaLsIJoQGGqJiyU7oNMhIaQid3KrC6rt3EYXsmLpMNL4YBQuUGiwCwgM2xRF2ghOs6g65KeYdJNq3csTNFGrLH3JEfAAdxAEHI6df?purpose=fullsize
https://images.openai.com/static-rsc-4/tSh1cAlI56UNjTlmPgR30-Ur1WfzAu0Td0B_RoLUx8Ui5tmf3Ion8HFQhP_XWojW4GPSeMjovJ81dMjOg1sCTjv-lWA6hQsezZuLfNCQtlu9QblWwihWQjio_RWouu9nh3oyyioAVz3vxiP7mI_QjcxBD2hXI8p1YATUmDaoa0lL5CCqtIFIhFXAE8he23Li?purpose=fullsize
https://images.openai.com/static-rsc-4/0VD26jLo-G6TH2XXXNeiE2fcRW56ki3PQU-q35k5hcE_m5ebV4WGz6IUmCkOvlewN0kKYNxcC1tZlqAd6RMVllJDt_x8FteUTkGiuMS3tczPrdzfjYFtfzQfSdOjRhK32IRyLr8ya5r1dzVXbrzaqgfoZ-CUzMf7Vyx7dt0XTS4fR4dQAwBD4GISkru-tQQW?purpose=fullsize
5

Parallel Lines

Parallel non-vertical lines have the same slope but different y-intercepts.

For example:

y = 2x + 1

and:

y = 2x + 5

Both have:

m = 2

but different intercepts.

They never intersect.

This becomes especially important when studying systems of equations.


Intersecting Lines

Lines with different slopes generally intersect at one point.

For example:

y = 2x + 1

and:

y = −x + 7

have different slopes.

Their intersection is the point that satisfies both equations.

This connects graphing linear equations directly to solving systems.

https://images.openai.com/static-rsc-4/93si_H0XORIty7iyn3AXtjN3RuWaQN5wpfmco3GFIYzQHUT-k9VB7CLvnCh2QqzRALk_q_7lzlluJ2p19TiUMzUl0_KDQVNzu8_BrVOxQqP0JtGLn-htc5RROFMYK-iE8KyLrJR5orzbBil4tTpv298Gq51lOidZ9stxoJnjrQRtgSE4ibG4kLZcFe45M5X7?purpose=fullsize
https://images.openai.com/static-rsc-4/KQL5FI34MasoyblREAF7gYnEfu3rQ6DgrcSHXMgM7e5poIBUUFdZQLG29YDnfFNzdmQo4aGSsMgHCuub8_0vhCr9SIaorecyeSPdmuOwdzoOO9PgftZq3eEK_x_d6RngL1XXTpHUCLVCTjpZJh0sfq9HasCp1nNeczElaHWoXeyhPAZ-KWN2e_DzjRM1lig0?purpose=fullsize
https://images.openai.com/static-rsc-4/xqCj877U8nBOqj8-fJEWF6MLQV3ue_N_NbJSDg8Ewn4iho-wiAg0t-eEV4yEZF3XE0Un66n80owN5sXxu-amlW3whYff_TJ0fSrNo0C2OmwAe0hULq6xo4E7oTmhvIFprO9u7AX0bqQGNVgZrAXes0gwvW-HcP5NoVuql_lmlgT3K5Beg0aEbr0RLsiT3OAF?purpose=fullsize
6

Comparing Linear Equations Visually

Consider:

y = x + 1

y = 2x + 1

y = 3x + 1

All three lines have the same y-intercept:

(0, 1)

Their slopes are:

1, 2, and 3

As the positive slope becomes larger, the line becomes steeper.

Graphing several equations together makes this relationship easy to see.


Negative Slopes and Steepness

Compare:

y = −x + 4

and:

y = −4x + 4

Both have the same y-intercept.

Their slopes are:

−1

and:

−4

The second line decreases more rapidly.

The magnitude of the slope helps describe steepness.

A slope of −4 is steeper than a slope of −1.


Linear Graphs in Real Life

Linear graphs are useful whenever one quantity changes at a constant rate compared with another.

Examples include:

  • Constant-speed travel
  • Hourly wages
  • Simple savings plans
  • Fixed-price services
  • Temperature conversions
  • Rental costs
  • Phone plans
  • Fuel use under simplified conditions
https://images.openai.com/static-rsc-4/akPZdS47F8NUW_4uZXhKFc74S79d2epy_qFgckkmJuC4nVkuWVUHl7dnHH2CwDhrh3sF10rTf-q_k8OTj1sxV_OMB-nmodmLHht9uThvgAdh6qf3DU6g5FTXYF_UV93a4sEiJtGAeX2aVwD3ggiDgdt_zQRMRvHi9xAYTRPKm7tQ15qDeehs6vmoLsbLPGK1?purpose=fullsize
https://images.openai.com/static-rsc-4/-a373-t2I8Rh1t7hxiDvc89aXufSh08ow9bGbBAk8aFyg27AhO0b0kGVHdLRXh0Ajmy6TImthCijewlwCsj49eqLAhKVz8l1pQXvYB8_BQa1FuVaQ9qhU80Zrlrdu-Tv8rxT_P41n5HSLWUTYhUQJBkSp4agry2UB2vqrBlUb8Aw-lI5VF2Qmc9jWDaLkcqe?purpose=fullsize
https://images.openai.com/static-rsc-4/R7keAENcnlsDrUTacJi5Ufd88rYcMkbGq8L2NObtcFvpGKDTff29c_izk9jOMEH3w8nQeIBXkqtMYajZIyOLCNVPGirjnKPBQvOqaBhMDyzcrLwyb-XfUXmwGmrwu0HBU95XYt8A9mZm0IaqMjmi8nWP6VPvRGk1HYukAHzgHoLjmj9yrgMuM4ko-nOlXA9v?purpose=fullsize
7

Worked Example — Taxi Fare

A taxi charges:

$4 starting fee

plus:

$3 per kilometre

Let:

C = cost

and:

d = distance

The equation is:

C = 3d + 4

This has the same structure as:

y = mx + b

The slope:

3

means the cost increases by $3 for each additional kilometre.

The intercept:

4

represents the starting fee.

The graph provides a visual model of the taxi fare.


Worked Example — Earnings

Suppose a worker earns:

$18 per hour

The equation is:

E = 18h

where:

E = earnings

and:

h = hours worked

The slope is:

18

This represents an earning rate of:

$18 per hour

The intercept is:

0

because before any hours are worked, earnings are $0.


Worked Example — Savings

Suppose a student already has $50 and saves $20 each week.

The equation is:

S = 20w + 50

where:

S = savings

and:

w = weeks

The slope:

20

represents:

$20 saved per week

The intercept:

50

represents the initial amount.

This shows why slope and intercept can have important real-world meanings.


Graphs Can Tell a Story

A linear graph contains information about a relationship.

The slope tells us:

How quickly one quantity changes compared with another.

The y-intercept often tells us:

The starting value when x = 0.

For example, in:

C = 5h + 12

the slope may represent:

$5 per hour

while the intercept represents:

a $12 starting fee

Graphing therefore helps us interpret equations rather than simply calculate with them.


Choosing a Graphing Method

Different equations may be easier to graph using different methods.

For:

y = 3x + 2

using slope and y-intercept is convenient.

For:

2x + 3y = 12

finding the x- and y-intercepts may be convenient.

For an unfamiliar equation, creating a table of values is often reliable.

For an equation given with a known point and slope, point-slope form may be useful.

Choosing an efficient method makes graphing faster and reduces mistakes.


Checking a Graph

After drawing a graph, you can check it algebraically.

Choose a point that appears to lie on your line.

Substitute its coordinates into the original equation.

If the equation becomes true, the point was plotted correctly.

You can also check:

  • Is the y-intercept correct?
  • Does the line rise or fall in the correct direction?
  • Does its steepness match the slope?
  • Are the axes scaled consistently?
  • Is the line straight?

Common Mistakes

Mistake: Reversing x and y

For:

(3, 5)

move to:

x = 3

then:

y = 5

not the other way around.

Mistake: Confusing slope and intercept

In:

y = 4x + 7

the slope is:

4

and the y-intercept is:

7

Mistake: Forgetting the sign of the slope

In:

y = −3x + 2

the slope is:

−3

The line should fall from left to right.

Mistake: Reading a whole number slope incorrectly

A slope of:

3

can be written:

3/1

So move 1 horizontally and 3 vertically.

Mistake: Using inconsistent scales

If one square represents 1 unit on part of an axis, it should not suddenly represent 5 units elsewhere.

Mistake: Assuming a point lies on a line because it looks close

Substitute the coordinates into the equation to verify it exactly.

Mistake: Plotting only one point

One point does not determine a unique line.

Use at least two points.


Key Terms

Linear equation – an equation whose graph is a straight line.

Coordinate plane – a plane formed by perpendicular x- and y-axes.

Ordered pair – coordinates written as (x, y).

Slope – the rate at which y changes compared with x.

Rise – vertical change.

Run – horizontal change.

Y-intercept – where a graph crosses the y-axis.

X-intercept – where a graph crosses the x-axis.

Slope-intercept form – the form y = mx + b.

Standard form – a form commonly written as Ax + By = C.

Point-slope form – the form y − y₁ = m(x − x₁).

Parallel lines – lines in the same plane that never meet.


Check Your Understanding

1. Identify the slope and y-intercept of:

y = 4x + 3

2. Identify the slope and y-intercept of:

y = −2x + 5

3. Graph:

y = 2x + 1

using its slope and y-intercept.

4. Graph:

y = −x + 4

using a table of values.

5. Rewrite in slope-intercept form:

2x + y = 8

6. Find the x- and y-intercepts of:

2x + 3y = 12

7. Does:

(2, 7)

lie on:

y = 3x + 1

Explain.

8. Does:

(4, 5)

lie on:

y = 2x − 3

Explain.

9. Compare:

y = 2x + 3

and:

y = 5x + 3

What is the same? What is different?

10. Compare:

y = 4x + 1

and:

y = 4x − 6

What can you say about their graphs?

11. What does a negative slope tell you about the direction of a line?

12. What is the slope of a horizontal line?

13. Why is the slope of a vertical line undefined?

14. A taxi fare is modeled by:

C = 2.5d + 6

Explain the meaning of the slope and intercept.

15. Explain how you can determine whether a point lies exactly on a linear graph without relying only on the picture.


Key Takeaways

  • A linear equation in two variables produces a straight-line graph.
  • Every point on the graph represents an ordered pair that satisfies the equation.
  • y = mx + b is called slope-intercept form.
  • m represents the slope.
  • b represents the y-intercept.
  • Slope measures the rate of change of y compared with x.
  • Positive slopes rise from left to right.
  • Negative slopes fall from left to right.
  • Horizontal lines have zero slope.
  • Vertical lines have undefined slope.
  • A line can be graphed using slope and intercept, a table of values, or intercepts.
  • Equations in standard form can be rearranged into slope-intercept form.
  • A point lies on a graph only if its coordinates satisfy the equation.
  • Lines with the same slope and different intercepts are parallel.
  • Different slopes produce different rates of change and usually cause lines to intersect.
  • The slope and intercept often have meaningful interpretations in real-world situations.
  • Choosing an appropriate form and graphing method can make a problem much easier to solve.

Did You Know?

The idea of using coordinates to connect algebra and geometry is strongly associated with René Descartes. The Cartesian coordinate system made it possible to represent equations as geometric shapes. This connection is one of the foundations of modern mathematics, physics, engineering, computer graphics, and data analysis.


4. Solving Systems by Graphing

Learning outcomes
  • I can solve systems by graphing.
  • I can identify the point of intersection.
  • I can estimate solutions from graphs.
  • I can verify graphical solutions algebraically.
  • I can explain the advantages and limitations of graphing.

Solving Systems by Graphing

A system of linear equations contains two or more equations that involve the same variables. One way to solve a system is to graph both equations on the same coordinate plane and find where the lines intersect.

The point of intersection represents the solution because its coordinates satisfy both equations at the same time.

For example:

y = x + 1

y = −x + 5

The two lines intersect at:

(2, 3)

Therefore:

Solution = (2, 3)

https://images.openai.com/static-rsc-4/xqCj877U8nBOqj8-fJEWF6MLQV3ue_N_NbJSDg8Ewn4iho-wiAg0t-eEV4yEZF3XE0Un66n80owN5sXxu-amlW3whYff_TJ0fSrNo0C2OmwAe0hULq6xo4E7oTmhvIFprO9u7AX0bqQGNVgZrAXes0gwvW-HcP5NoVuql_lmlgT3K5Beg0aEbr0RLsiT3OAF?purpose=fullsize
https://images.openai.com/static-rsc-4/1ll5xCPi9aOBewnV-htANagVZYrfjMM0-WA1AdO-MnHLGOclxgD00jD91q2vR59DryL3Y6-KabAWzbqCk18sOEjgE0pGT0R1m-yB3JPkKFse71zP1bWCq3LjR5sS1BGSgYJtRrcy_uPIAPV_sbIfKme5PmqdN6xeSOwqT4dqG0lTQVOcMzudnthBP6veskKN?purpose=fullsize
https://images.openai.com/static-rsc-4/yFYoFhu1nknDxuIg935JZLCCwpgm0GWsX7pbj6MjTRznu6A-4-6AOs_8oXmYXrZGXBfQ2dl6Mh64S7Wt4bXKnz54UK_OXlOwdnenOX0haUZ0GqY67H4dRMuMuuPrlTizQBuMLveK0emHjrkVbsFuMg_8rztqkKO3tdbXLXaQw6W_Mxnsqaz6i2rP2SDIU27X?purpose=fullsize
6

Learning Targets

  • I can solve systems by graphing.
  • I can identify the point of intersection.
  • I can estimate solutions from graphs.
  • I can verify graphical solutions algebraically.
  • I can explain the advantages and limitations of graphing.

What Does It Mean to Solve a System?

To solve a system means to find values of the variables that make all of the equations true simultaneously.

Consider:

y = 2x + 1

y = −x + 7

We are looking for an ordered pair:

(x, y)

that satisfies both equations.

Graphically, this means finding a point that lies on both lines.

That point is where the lines intersect.


Why Does the Intersection Give the Solution?

Every point on the graph of:

y = 2x + 1

satisfies that equation.

Every point on the graph of:

y = −x + 7

satisfies the second equation.

At the intersection, the same point belongs to both lines.

Therefore, its coordinates satisfy both equations.

https://images.openai.com/static-rsc-4/MpEaycC2-SfJhN2WWaQrPoBRIZC6dLkfQX0NJphAqTDDwqU9y7YczDY1-MdPmrQm7aTHvSjP_j2GSrXybkUbqnZzGXc8h8NH5M8XNzxuntrMvE61l8-kYtSjr1d33wdLvmu6R3z1dGU7hX9QJDao95iB86LPDKRsLFV21SwEdL8SQxlHPgpTyw24ElWuj6Ai?purpose=fullsize
https://images.openai.com/static-rsc-4/uy_ql4qkWtc8z9e-DGezRrRAQ5oHb6YY64lcgeYd2gJxLaXZpAHraruAS9L8e2CbEXbwlWju5vFjPbLhz1D38cjo7Rot7NhhlPqW_G4krERdXRFUTdrf1S6L0lI9jtONnhWhpDPAOymb_yoezUvghTkAjXPZPVW2Nt9Hl5g-RHdZw5BA1u9AkduVubUk6HWt?purpose=fullsize
https://images.openai.com/static-rsc-4/1ll5xCPi9aOBewnV-htANagVZYrfjMM0-WA1AdO-MnHLGOclxgD00jD91q2vR59DryL3Y6-KabAWzbqCk18sOEjgE0pGT0R1m-yB3JPkKFse71zP1bWCq3LjR5sS1BGSgYJtRrcy_uPIAPV_sbIfKme5PmqdN6xeSOwqT4dqG0lTQVOcMzudnthBP6veskKN?purpose=fullsize
6

This gives us an important connection:

Algebraically: the solution satisfies both equations.

Graphically: the solution is the intersection of the graphs.


Steps for Solving a System by Graphing

A reliable method is:

  • Graph the first equation.
  • Graph the second equation on the same coordinate plane.
  • Locate the point where the lines intersect.
  • Read the coordinates of the intersection.
  • Write the solution as an ordered pair.
  • Substitute the coordinates into both equations to verify the answer.

If the intersection is:

(3, 5)

then:

x = 3

and:

y = 5


Graphing from Slope-Intercept Form

Equations written as:

y = mx + b

are particularly convenient for graphing.

Remember:

m = slope

b = y-intercept

Consider:

y = x + 1

The slope is:

1

and the y-intercept is:

1

Now consider:

y = −x + 5

The slope is:

−1

and the y-intercept is:

5

Graph both lines and locate their intersection.

https://images.openai.com/static-rsc-4/z6MFuOUfH6sYk0zBFnU5b55e9XQPnSCLZcn6NIHmYyEzcqyVIUq2ppe2qOPJZkkKB5Nmc05gGFtHIczuSfSTl8HVza6YdQN7QVBlqS1FG9AvDNOxAoJIKAacuk2BvPc56SKRcirMcI_6zOZkCdYhs8TeTqIZlc6tIJsLFmU-dUNc8_ZL3MDXyFboYc1mgjor?purpose=fullsize
https://images.openai.com/static-rsc-4/Hl0_Qwsoddqc1SKIlMruwmrSl8HugqFxRbOa2wWLmNOh8f8eB_Tm4jpK0TX_qJB2EuDfxYLL66WlTTO_-YVFjEnBH4gOZRb__pCL5WdyGXnJxYj_JXl_7aMrkCEDU-fL5BsrTgMkoJdb5EDExt2BPenBM8EiHbxrvvEmdPc2Kg2W07xIa3BJUAmpUcuOyeKG?purpose=fullsize
https://images.openai.com/static-rsc-4/2rr5yIUE1AuC1moUhSwvnPR0KpH9huU0pD5q3vM7BaycrWl96eRZZPL68kPgrRZtD7bLUYYxqBxLq-g5NaOD5qinWUMb19bT98VUFVG97e6Qu6e6z59ThXoOZ_rObFCvhcjgBSzEwVQ73X_4ngjvSD9pZsMMI6AWMl63FlfyFktNz35CQDL-aC0Gy3vO6sP3?purpose=fullsize

The lines intersect at:

(2, 3)

Therefore:

Solution = (2, 3)


Worked Example — Solving by Graphing

Solve:

y = 2x

y = −x + 6

For the first equation:

Slope = 2

y-intercept = 0

For the second equation:

Slope = −1

y-intercept = 6

Graph both lines.

Their intersection is:

(2, 4)

Therefore:

Solution = (2, 4)


Verifying the Graphical Solution

A graph suggests that the solution is:

(2, 4)

We can check this algebraically.

First equation:

y = 2x

Substitute:

x = 2

y = 4

Then:

4 = 2(2)

4 = 4

True.

Now check:

y = −x + 6

Substitute:

4 = −2 + 6

4 = 4

True.

Therefore:

(2, 4)

is confirmed as the solution.


Graphing Equations in Different Forms

Not every equation is initially written in slope-intercept form.

Consider:

x + y = 6

y = x

The second equation is already easy to graph.

For the first equation, rearrange:

x + y = 6

Subtract x:

y = −x + 6

Now the system is:

y = −x + 6

y = x

Both equations can be graphed using slope and y-intercept.

The lines intersect at:

(3, 3)

Therefore:

Solution = (3, 3)


Using a Table to Graph

You can also graph each equation using a table of values.

Consider:

y = x + 2

For x = 0:

y = 2

For x = 1:

y = 3

For x = 2:

y = 4

So we can plot:

(0, 2)

(1, 3)

(2, 4)

Now consider:

y = −x + 6

For x = 0:

y = 6

For x = 1:

y = 5

For x = 2:

y = 4

So we can plot:

(0, 6)

(1, 5)

(2, 4)

Both lines contain:

(2, 4)

Therefore:

Solution = (2, 4)

https://images.openai.com/static-rsc-4/cZcgzFAG5RlRUrpaBuMpNnLb8Ay8ioABUX4fOWiIj0gW_5zRHZiju-mJH8BXc6vdhwJHuyuk9VCQpF4joPGrMQUjK0JalXTKHiOjtbxhvQHzdKkO_NiKSnhO3kXKAQuqWT2BwQ_7GDPyovSOYWVvHN_fAA8KMZ7tEpBGT-NMCKTgM1dqENVlHulG85CcICOX?purpose=fullsize
https://images.openai.com/static-rsc-4/KIbkAmLLnDoKBUFTJaFtAL_Xn_9nmLDj_0hNzey11JNf5h-u2UpCHY27EY7_Bbxz3aBY_l5WVl5-2kbk8ScOqYJD3C0yadaoa-eda0I27p-c9MbSEPJ8G6CUpgY3raShYFbYUqcxc-OGlqvh-5hhSVH8tqClSGQdzoXskZRkVd4-hpaUcgdLWrLrdgjlfeOl?purpose=fullsize
https://images.openai.com/static-rsc-4/jmcxc9y6eW-65UBXfKKVrQ6qAPi6iLagk47EiCEQZwwELmsjYI9sUAMsstLhQ4iYmM9_WCw_KvrfEAuFvauD5Gl7nqbnfcNB5ul-hKiQejFPVRakg-fO-ngheMeHpgvhfwv2lMqQHMv25EiIv89gwtqleO9YAqPGLz82PzIExsRUB-5ivyUXR4JD-55MSJaH?purpose=fullsize
5

Reading the Point of Intersection

When reading an intersection from a graph, remember that coordinates are written:

(x, y)

Read the horizontal coordinate first.

Then read the vertical coordinate.

For example, if two lines meet at a point where:

x = 4

and:

y = 7

the solution is:

(4, 7)

not:

(7, 4)


Estimating Solutions from Graphs

Not every pair of lines intersects at convenient integer coordinates.

For example, a graph might show an intersection near:

(2.4, 3.7)

In this situation, graphing allows us to estimate the solution.

https://images.openai.com/static-rsc-4/FGNIIQ-tEV7-BG85cCd3TrHtqm4VUFl4HY58bmlQiWLJqrc7jR36Zpv2BtI-AgRYYVlz2NlDyN-GAegVQAfQfP5a4yGTayl9w8YuLcOEz6SsSbY20gmQiQrekEZxG0c-0ha2A9bGqDBHZCdw2c3VAZmbRjJ0kEzBjQas9hlscTNjl25QLL-tRlNy0TfBvAdx?purpose=fullsize
https://images.openai.com/static-rsc-4/mlhFBbryf_moeIzH_o93aENHg1VEOHFGgDngehsuqYvq8slM_CVJXLkCc13FC_0IrbP7_-BQc2mc6rg2yeFcabOw4QblQCmunIR8auLuvE07jvHhzLAW17WeHjmFQLBaXcHWCNwGtIhPmKH2hcCvgASTde7WPPU3kkNGK0OFKbRW2gINajBGsUsDxAQeKwl_?purpose=fullsize
https://images.openai.com/static-rsc-4/ra0eE8T2SbUJc-lFSDC-CGEzSQM5-cmcXpg7SNczf5ymSeWHJpy6-8jafQuFUR_5Rn33tMF4uaI0-1suIn1kCmJQTG8abcmvRpUr_RtOnDMLj6nfU2NtHak-poUaAZJbOevtxaKyXbmXmKhpFjs4ir3PAeQDOHBeeD7u8SO-ijc4HeT-Ip8VbgvkzQx33JLF?purpose=fullsize
4

The accuracy of the estimate depends on:

  • The scale of the graph
  • How accurately the lines are drawn
  • The thickness of the lines
  • The size of the graph
  • How carefully the coordinates are read

A graphical answer might therefore be written:

Solution ≈ (2.4, 3.7)

The symbol:

≈

means approximately equal to.


Worked Example — Estimating an Intersection

Suppose two lines appear to intersect at:

x ≈ 1.7

and:

y ≈ 4.3

Then we can estimate:

Solution ≈ (1.7, 4.3)

We should not claim:

(1.7, 4.3)

is exact unless we have verified it algebraically.

Graphing can provide a very good estimate, but visual measurements have limits.


Improving the Accuracy of an Estimate

Suppose the intersection appears somewhere between:

x = 2

and:

x = 3

A graph with each square representing 1 unit may not provide enough precision.

We could improve the graph by:

  • Using a larger graph
  • Using a smaller scale
  • Adding grid lines
  • Zooming in digitally
  • Checking the result algebraically
https://images.openai.com/static-rsc-4/93si_H0XORIty7iyn3AXtjN3RuWaQN5wpfmco3GFIYzQHUT-k9VB7CLvnCh2QqzRALk_q_7lzlluJ2p19TiUMzUl0_KDQVNzu8_BrVOxQqP0JtGLn-htc5RROFMYK-iE8KyLrJR5orzbBil4tTpv298Gq51lOidZ9stxoJnjrQRtgSE4ibG4kLZcFe45M5X7?purpose=fullsize
https://images.openai.com/static-rsc-4/uy_ql4qkWtc8z9e-DGezRrRAQ5oHb6YY64lcgeYd2gJxLaXZpAHraruAS9L8e2CbEXbwlWju5vFjPbLhz1D38cjo7Rot7NhhlPqW_G4krERdXRFUTdrf1S6L0lI9jtONnhWhpDPAOymb_yoezUvghTkAjXPZPVW2Nt9Hl5g-RHdZw5BA1u9AkduVubUk6HWt?purpose=fullsize
https://images.openai.com/static-rsc-4/AqO6S2SXZJo0iMOrXpd1Lp5haNkykA15Ye85PVLTZ6S1TCfsaHXOTh4CHOvuVG7H6ZCM1AlZgrX64P4WXXTo31-PkHfOWvm_3_zaW7mfmHRW0ni4wCHvFnCEScO64x2IAbEB7UX9BNrid7alRIofdpwFB5QffIn8xZsGr-ELqrf6KKlJBydvvw_TayWgkiyR?purpose=fullsize
5

A more detailed graph allows a more precise estimate.


One Solution

When two lines intersect exactly once, the system has:

One solution

For example:

y = x + 2

y = −2x + 8

The slopes are different, so the lines intersect.

Their intersection represents the one ordered pair that satisfies both equations.

https://images.openai.com/static-rsc-4/yFYoFhu1nknDxuIg935JZLCCwpgm0GWsX7pbj6MjTRznu6A-4-6AOs_8oXmYXrZGXBfQ2dl6Mh64S7Wt4bXKnz54UK_OXlOwdnenOX0haUZ0GqY67H4dRMuMuuPrlTizQBuMLveK0emHjrkVbsFuMg_8rztqkKO3tdbXLXaQw6W_Mxnsqaz6i2rP2SDIU27X?purpose=fullsize
https://images.openai.com/static-rsc-4/xqCj877U8nBOqj8-fJEWF6MLQV3ue_N_NbJSDg8Ewn4iho-wiAg0t-eEV4yEZF3XE0Un66n80owN5sXxu-amlW3whYff_TJ0fSrNo0C2OmwAe0hULq6xo4E7oTmhvIFprO9u7AX0bqQGNVgZrAXes0gwvW-HcP5NoVuql_lmlgT3K5Beg0aEbr0RLsiT3OAF?purpose=fullsize
https://images.openai.com/static-rsc-4/FgMbULcOEwRYo6g_PyxoeFQTmgSYRbVMivH7LTbm2vL7g0JA43XyomDT3j_W5G4n7cW8VgmP4m_gvm_-LpdOTL9Jt0UmFBOE8OAYZzXxQN8Xy4P5OhFRZqethw7q-J0u1-ceDJlDoSLcxak4X5iuyx-uZg9fVwWOEBeD-dUnoVVTNPJLRJtm-hWbxGVq4RTM?purpose=fullsize
5

No Solution

Consider:

y = 2x + 1

y = 2x + 5

Both equations have slope:

2

But their y-intercepts are different.

The lines are parallel.

https://images.openai.com/static-rsc-4/cN3L1g5NGDxAbwe_PvFiofGkLvhFNriTMSgwutc1fAVKqOLaM5FuSR3LqtT_jx_vxnCpVqC-Jsl93bAq96g5c295moJUbd6otPL6RXCvT_Lf1uZBUYHPv1lsRx3UBYBw5p9Wj333kEJLumLBTxmOHhANPlvkzbddGscCxj1e8VcP-jt_rj4GHJu6-4Fs8EfP?purpose=fullsize
https://images.openai.com/static-rsc-4/BxYa-ZvQ3HA5IEraXIUlBAT7JK1CzmnYHtWchOBdLRyZTjhoZvdQEGHzPxeW1z_vbLHrvdU4TfQFD_S3kt5mnf7NU9eNyzHWSheCx2IOMB0nmVO9WuXFNGcCE01SvDZGpzQLq08q3geUNBNYWbtIbLRmV6d1UMVtvQebUNbR6MZT6iXjW4FTPef3CgV3XQ8u?purpose=fullsize
https://images.openai.com/static-rsc-4/gKY8HRU63A-ENxWXqXD47PPgui5bRh6YlC2KgKsxQiNobUUas6yS9-0QBw20uFs5H2fGti8h4FbVALi-XWNRPYpyasYMoQLZPLeJ6rgY_OzaVdr-54QCJ-bAgR2FY76_mtKPKhsQM7XZPzinGjzGyxydAIu6sAaanHAQYdZJTmldHYCJzzMqg44aUmm71As1?purpose=fullsize
5

Because parallel lines never intersect, there is no point that satisfies both equations.

Therefore:

No solution


Infinitely Many Solutions

Consider:

y = 2x + 4

and:

2y = 4x + 8

Simplify the second equation:

2y = 4x + 8

Divide by 2:

y = 2x + 4

The equations describe exactly the same line.

When graphed, one line lies directly on top of the other.

https://images.openai.com/static-rsc-4/TVcKAmRvLW_w5u_oLh2Vjq4VJUPaXo8uQEdUMcYeDx5dXG7xxPNNWatWbARwSn-Mg6aEwjftCuC6_vPubmFc6L6Lg6bDmHerpghYGZi5g4LZy6BpAWwxqe3T-P4fVk9I4mQvHowNRU_PPz1rJ6xE_tOPBbjnWy0-sIW4GXwdq8nlOddqQrLDSgWMQvrVCpDZ?purpose=fullsize
https://images.openai.com/static-rsc-4/jaGPoI3duDO4LvVsPOlkIUp0WhthxaOx6D6cuWiRvkd76-RDKEASGmUoELfTjQLZC4eaEw9QtYy-Pp3_COvKMzJobAgG36l8BTg5bWgBM-2FkStvh87CndoR5sS2s1M581LYnpagG3EwjxhRFAdHIL1B2oyEaKSVXX7Bjdqlt-06h9EPgNoQFmXI4NIyfNGQ?purpose=fullsize
https://images.openai.com/static-rsc-4/3W4NWaSRiMFYH1HhIKpyJwd7vrYVe8LQICNpEq6vsWbTu19kPge8KJVU4rML7HatHn0amA7jKmSafPIRrcpn9mLwXZT-O12FhBJoQ3jx7SlRZWC57lnI7-06mIRU_61ZQW_n_hhN8suK78k2HhySnLsMiq-7k98DbJX2fiziU44F_6KL8ni6wy1cNXN4muKo?purpose=fullsize
5

Every point on the line satisfies both equations.

Therefore:

Infinitely many solutions


Recognizing the Three Possibilities

A system of two linear equations can have three possible graphical results.

Intersecting lines → One solution

Parallel lines → No solution

Same line → Infinitely many solutions

These three possibilities are important when solving systems by any method.


Using Slope to Predict What Will Happen

Sometimes you can predict the graphical result before drawing the lines.

Consider:

y = 3x + 1

y = 3x − 5

Both lines have slope:

3

but different y-intercepts.

Therefore, they are parallel.

The system has:

No solution

Now consider:

y = 3x + 1

y = −2x + 6

The slopes are different.

Therefore, the lines will intersect once.

The system has:

One solution


Verifying a Graphical Solution Algebraically

Suppose your graph suggests:

Solution = (3, 7)

for:

y = 2x + 1

y = x + 4

Check the first equation:

7 = 2(3) + 1

7 = 7

True.

Check the second:

7 = 3 + 4

7 = 7

True.

Therefore:

(3, 7)

is verified.


Why Verification Matters

Hand-drawn graphs are rarely perfect.

A line may be slightly misplaced.

An intersection may appear to occur at:

(3, 7)

when its exact location is actually:

(3.1, 7.2)

Algebraic verification helps determine whether a graphical solution is exact or only an estimate.

A strong approach is:

Graph → Estimate → Verify


Worked Example — Discovering an Incorrect Estimate

Suppose a graph appears to show:

(2, 5)

as the solution to:

y = 2x + 1

y = −x + 8

Check the first equation:

5 = 2(2) + 1

5 = 5

True.

Check the second:

5 = −2 + 8

5 = 6

False.

Therefore:

(2, 5)

is not the exact solution.

The graph has only provided an inaccurate estimate.


Graphing Systems in Real-World Problems

Graphing systems is particularly useful when comparing two changing quantities.

For example, suppose two companies charge:

Company A: C = 2x + 10

Company B: C = 4x + 2

where:

C = cost

and:

x = number of units

Graphing both equations shows when the costs are equal.

https://images.openai.com/static-rsc-4/M0_KDZfx41-5UqGaoNQVNrvO8369C78GoDvZcTwnd7D6gobvP7BRXfvSNwkx-u2vDHHMEE4PdASSDROx7XSrGCNuA7oS7MpS0eVQpSKsyZK0AID-imt-MnudZMrp2BCjOTvO1BntTb5SeyA7rL1VYSR-It8eu9_2E6tQjSqrf0MyFvEdribGVz8-tQ6d8ChG?purpose=fullsize
https://images.openai.com/static-rsc-4/UtvZ4J57AiktpPQjhQqg5vlecc_mVmJmW36b9FBx_xz6eSruyR_Uw__kPIGn8rYlEd76ZxCx2C0IDwpGGzJ4_1HV0skx2AONvuY04-LkD3v4Wx0WUCcxqkqpdf_MaMDDCF2r6ggUwe2tQk-Srpu5N6bUSUAIpGPbRTxz045308vZ6tyzuwb4eIX-s4fnZM7t?purpose=fullsize
https://images.openai.com/static-rsc-4/4WXz_i4GpLLRb95VbB203YON7iDz_J0jvEubAIUkIYqXM87GHYuGIMhcrlVeIAPthyYVf0BYgTs3xULL-f3oh-WB7pHDTYLthU0xkLc3zsRRp0hPhhjEzcwhaKAdTVSuy6bGcq-ycgDOfAkYiSZGO2aMSfEvVzeJwBxNgVIdHwV-ZsnmPDw38fECXVWCJYZd?purpose=fullsize
6

The intersection is called a break-even point in many financial situations.


Worked Example — Comparing Costs

Consider:

Company A: C = 2x + 10

Company B: C = 4x + 2

The graphs intersect at:

(4, 18)

Interpret the coordinates.

x = 4

means 4 units.

C = 18

means a cost of $18.

Therefore:

At 4 units, both companies charge $18.

The intersection has a meaningful real-world interpretation.


Worked Example — Two Moving Objects

Suppose two objects have distance equations:

Object A: d = 5t

Object B: d = 2t + 12

Graph both equations with:

time on the horizontal axis

and:

distance on the vertical axis

The intersection occurs when:

5t = 2t + 12

Graphically, this occurs at:

(4, 20)

Therefore:

After 4 units of time, both objects are at a distance of 20 units.

https://images.openai.com/static-rsc-4/ppkBaxGSAZV3_Dk4SfRV34ycMA-C3YFm1X7FCOmuC0SJzUmSrEFC11-epGMP-atl9igJT7Y6U-pC8_TtHukGxRGm9YGc0pH95wPF_Kjr2zwPj-Z1vVlm5VKbRtS9S0ebqsIiGqt_bZQXVFVli2jS7AySQcbQlqxht0FDYd8yGj8Ixif8x_CpVdKx5A85ITSf?purpose=fullsize
https://images.openai.com/static-rsc-4/rQbyDcbPwpK644d5fC8djDXLZ22XuaqGiHfs_-OA9JOqIiOVwI-kOjdIx3hwP9MbTea9y07IxXEmIxxUMzSRC6XCCp1V8wxsnnwY51-dw2T9FhMieqnyromcVnSmVoBv68o3ctHcGOMSRN5X9wPYTn1Qe0BjAcbsd94iTZbBXh_UzW8_q4a2Q8QEnckxM5TC?purpose=fullsize
https://images.openai.com/static-rsc-4/TomeF5lGulgNKxQqeP1UL_MgQa1R0bk9blyftsvvUAbb9-zVj8PTCdu7mKzfWzzovE2BdMiWhkco6wG5WVKLJDFggzfWdkC4gu20C63csdWf4an358fA3xVPL1KtyE6GnfCyMUiXHHBix57s77vGZMf73G0e8__8rHcx_EBW81aGauYuQGssZZnmpJGR13nt?purpose=fullsize
5

Advantages of Solving by Graphing

Graphing has several important advantages.

It provides a visual representation of the system.

You can immediately see whether the system has:

  • One solution
  • No solution
  • Infinitely many solutions

Graphing also helps us understand:

  • Slopes
  • Intercepts
  • Rates of change
  • Relationships between equations
  • Real-world meaning of intersections

Graphing is especially useful when an approximate answer is acceptable.


Limitations of Solving by Graphing

Graphing also has limitations.

The main problem is accuracy.

If an intersection occurs at:

(2.376, 5.821)

it may be difficult to read these values accurately from a hand-drawn graph.

The result depends on:

  • Graph size
  • Scale
  • Drawing accuracy
  • Line thickness
  • Reading accuracy

Graphing may therefore provide an estimate rather than an exact answer.


Graphing Versus Algebraic Methods

Graphing is often excellent for understanding what a system means.

However, algebraic methods such as substitution and elimination are usually better when exact answers are required.

For example, a graph might suggest:

x ≈ 2.3

while an algebraic method might reveal:

x = 7/3

Both describe approximately the same value, but the fraction is exact.

This is why different solving methods are useful for different purposes.


When Graphing Is Especially Useful

Graphing is a good choice when:

  • You want a visual interpretation.
  • The intersection occurs at simple coordinates.
  • An approximate answer is acceptable.
  • You want to compare two relationships.
  • You want to determine the number of solutions.
  • You want to understand a real-world relationship.

When Another Method May Be Better

Substitution or elimination may be preferable when:

  • An exact answer is required.
  • The intersection contains fractions or decimals.
  • The graph would require a very large scale.
  • The equations are difficult to graph accurately.
  • The lines intersect outside the visible graph.

Choosing an appropriate method is an important mathematical skill.


Using Technology

Graphing calculators and graphing software can plot systems much more accurately than hand-drawn graphs.

Technology can:

  • Plot both equations
  • Zoom in on intersections
  • Display coordinates
  • Compare several equations
  • Help investigate how changing coefficients affects graphs
https://images.openai.com/static-rsc-4/qgzL9sflyHOUMdwdiexPKjAhn5X5auwBvAMtOyGjkfVpZM8aHZkF1tn1afPusZLDNQyWw3pAu-TtmwhBfZ8KQnXHVQSqW-bE9TI1zyBKgK_ftm-wRrXENnaAAnxvO_uYVH-74TnOBw5Vz6za4tXE_ZnwDUNXtWvoATSWi6k217SNch90bR9JIV4eh9_Pua1P?purpose=fullsize
https://images.openai.com/static-rsc-4/lgoAFyFLFtwxixdW4fqwlMAO1nWLwIZJ4bm8btmxZl-ECK604la5Z5TXZ0iK-uhJ-MDmZR9f3D_XM90wvyI0vlBL8rQeVQIvBQIWA_5nfOGrYUda7-oHIMpwEO7FDMwv2yA_Bxzbkrqa-Ojj1XBGl-sadPIhISTAaonxg3MYDxRbi4pxFkE1-uxFl6AeeUKC?purpose=fullsize
https://images.openai.com/static-rsc-4/W54ymUvKtuKL0fs6nnPC3_8xFS67ILozuyj9se76AZVl0QxCHH-pbyz1g1gyxLUHnudTmQK8FaLhC3Y7Ms_aGmFTIe1Zdzk-His-swpPIjSSRGJw47nty3eE1Umk-nhaUJU9QDdcjfpMs4GJEBBkbugsV5dXiSwURqE4ghLbem5xIMr-28YOxgeLbqItaObN?purpose=fullsize
5

However, understanding what the intersection means remains essential.

Technology can locate a point, but you still need to interpret the mathematics.


Choosing an Appropriate Scale

The scale of a graph can strongly affect how easy the solution is to identify.

Suppose the intersection is:

(50, 120)

A graph extending only from −10 to 10 will not show it.

Similarly, if the solution is:

(0.25, 0.75)

a graph using very large intervals may make the intersection difficult to read.

Choose a scale that includes the important values and provides enough detail.


Common Mistakes

Mistake: Graphing the Equations on Separate Axes

Both equations must be plotted on the same coordinate plane.

Otherwise, their intersection cannot be identified.

Mistake: Reading Coordinates Backwards

If the intersection has:

x = 3

and:

y = 5

the solution is:

(3, 5)

not:

(5, 3)

Mistake: Assuming Every System Has One Solution

Parallel lines have:

No solution

Identical lines have:

Infinitely many solutions

Mistake: Treating an Estimate as Exact

If the intersection lies between grid lines, use:

≈

and report an appropriate estimate.

Mistake: Using an Inappropriate Scale

A poor scale can hide the intersection or make it difficult to read accurately.

Mistake: Not Verifying the Solution

Whenever possible, substitute the proposed coordinates into both original equations.

Mistake: Giving Coordinates Without Context

In a real-world problem, explain what each coordinate represents.


Key Terms

System of equations – two or more equations considered together.

Solution – values that satisfy all equations in a system.

Graphing – representing equations visually on a coordinate plane.

Intersection – the point where two graphs meet.

Ordered pair – coordinates written as (x, y).

Approximate solution – an estimated solution rather than an exact value.

Verify – check that a proposed solution satisfies the original equations.

Parallel lines – lines that have the same slope but do not intersect.

Coincident lines – lines that lie exactly on top of one another.

Break-even point – a point where two costs, revenues, or other quantities are equal.


Check Your Understanding

1. What does the intersection of two lines represent when solving a system?

2. Solve by graphing:

y = x + 2

y = −x + 6

3. Solve by graphing:

y = 2x

y = −x + 6

4. Graph:

y = 3x + 1

y = 3x − 4

How many solutions does the system have?

5. Graph:

y = 2x + 4

2y = 4x + 8

How many solutions does the system have?

6. A graph suggests that two lines intersect at:

(3, 7)

Explain how you could verify this solution algebraically.

7. A graph shows an intersection at approximately:

(2.6, 4.1)

How should you report the solution?

8. Why might a hand-drawn graph give an inaccurate solution?

9. Explain one advantage of solving systems by graphing.

10. Explain one limitation of solving systems by graphing.

11. Two lines have the same slope but different y-intercepts. What does this tell you about the system?

12. Two equations produce exactly the same line. How many solutions are there?

13. Company A charges according to:

C = 5x + 10

Company B charges according to:

C = 3x + 20

Explain what the intersection of the two graphs would mean.

14. Why might substitution or elimination be preferable when an intersection contains fractions?

15. Describe the complete process you would use to solve a system graphically and check your answer.


Key Takeaways

  • A system can be solved by graphing both equations on the same coordinate plane.
  • The solution is the point of intersection.
  • The intersection satisfies both equations simultaneously.
  • Coordinates are written as (x, y).
  • Systems with intersecting lines have one solution.
  • Parallel lines have no solution.
  • Identical lines have infinitely many solutions.
  • Graphs can be used to estimate solutions that do not occur at exact grid points.
  • Approximate graphical solutions should be reported using ≈ when appropriate.
  • Graphical solutions can be verified by substituting the coordinates into both equations.
  • Graphing provides a strong visual understanding of relationships between equations.
  • Graphing is useful for comparing slopes, intercepts, rates, and real-world relationships.
  • Graphing may be less accurate than algebraic methods.
  • The scale and accuracy of a graph affect the precision of the solution.
  • Algebraic methods are often preferable when an exact solution is required.
  • In real-world problems, the intersection should be interpreted using the meaning and units of the variables.

Did You Know?

Graphing systems is used far beyond mathematics classrooms. Businesses can graph cost and revenue to locate break-even points, scientists can compare mathematical models, and engineers can examine where different operating conditions become equal. In each case, the key idea is the same: an intersection identifies where two conditions are true at the same time.


5. Types of Solutions

Learning outcomes
  • I can identify systems with one solution.
  • I can recognize systems with no solution.
  • I can recognize systems with infinitely many solutions.
  • I can relate graphical representations to solution types.
  • I can explain why different systems have different numbers of solutions.

Types of Solutions

A system of two linear equations does not always have exactly one solution. Depending on how the two equations are related, a system can have:

  • One solution
  • No solution
  • Infinitely many solutions

When the equations are graphed, these three possibilities can be recognized by looking at the relationship between the two lines.

https://images.openai.com/static-rsc-4/G87IQoH7Yy0bcQ5XphrdDiYJEKXAqP70y0rW4pmWlCC-oGOhLjnvve671EgsXuVYVx7A6mZZ9iUUHvE8TiKOwgvkkRnJga-ZnVeVfcCgB6UxpcljwC74qU_tEcn9KwDHVzQHKql-uEPIusFsVJBh-b1iLDfnE5LZTpLdv0X8fXSKNpuBaAhmzQBfmX4aZ3YH?purpose=fullsize
https://images.openai.com/static-rsc-4/QTc08t6j1NbTb_HzonU9I5Bw9m7h-MHTEUVE0HaTpOoTRWZOrW8LIbNNMJ32krC3Fa-nVPhqZqC--_UlRZxyGzjG4RMNzLa7yzGgQ-reJA-gK26LZQtNGRzOIHT9ulkLZpzWjJ44Ga3Z-hWlRdsWQHXHTiMJMoJQ0B_hP2Pwh7KCCSApVOBqJffpNlaHr6Te?purpose=fullsize
https://images.openai.com/static-rsc-4/G3rTVu9Ct_ucEWD1xWQI4i5K0ygwhoCHZB9AM552Li1jTl_xwIJL9-MTNlMGMoz-U9sNGi8KnmB_isv4JM66m9o2PLYK1drFiC0zK5ttsmUyrih8eWuG1DfB47lUOdLbwcrwTtbcKIG8LWoN2CFs7HhvwmuFR5nDhYeA3rrE1TpUp7MqXAN5LV2iEkF3AS3Q?purpose=fullsize
5

Learning Targets

  • I can identify systems with one solution.
  • I can recognize systems with no solution.
  • I can recognize systems with infinitely many solutions.
  • I can relate graphical representations to solution types.
  • I can explain why different systems have different numbers of solutions.

What Is a Solution to a System?

A solution to a system of equations is a set of values that satisfies both equations at the same time.

For two linear equations involving x and y, a solution is usually written as an ordered pair:

(x, y)

Graphically, a solution is a point that lies on both lines.

This means the number of solutions depends on how the two lines are positioned relative to each other.


The Three Possibilities

For two linear equations, there are three possible graphical relationships.

The lines can:

  • Intersect once
  • Never intersect
  • Lie exactly on top of each other

These correspond to:

Intersecting lines → One solution

Parallel lines → No solution

Same line → Infinitely many solutions

https://images.openai.com/static-rsc-4/jjjrokpARlS9556r0MF8I6XKgYhZ3XQZzxdZng8g1RPzR30bCqf_jq3W3YMgqoPj7FChhHpES7cC3cZpOph3k6s12scrZp1cX5R9q1UbQXasCM0i04qt_sAtqvgjslyxLxF6tYeZ9geK_O4HBEt2QRH-4qR4ggqMzrN0OP8GsSADgDu9PVJl07NjBYJtIHod?purpose=fullsize
https://images.openai.com/static-rsc-4/3W4NWaSRiMFYH1HhIKpyJwd7vrYVe8LQICNpEq6vsWbTu19kPge8KJVU4rML7HatHn0amA7jKmSafPIRrcpn9mLwXZT-O12FhBJoQ3jx7SlRZWC57lnI7-06mIRU_61ZQW_n_hhN8suK78k2HhySnLsMiq-7k98DbJX2fiziU44F_6KL8ni6wy1cNXN4muKo?purpose=fullsize
https://images.openai.com/static-rsc-4/5wQTVyDS9t8sn9wmSlVtQGe2TwSQ-V4SqqGu-yUoBK5xoBRjc2npj1jYnjwW7DY0rYgiApPN_zYwp2e0IF29POpt_SPhLJpH_0lA3JsniR8LDpFVaPfNXFbXQuZuSbrhrrLLRDDxmZK6pUdOTiKjK_IKXlBVDH0IS3TGmOHexmt_gxDNW3ZfuvW3-mo11oI-?purpose=fullsize
5

One Solution

A system has one solution when the two lines intersect at exactly one point.

For example:

y = x + 1

y = −x + 5

The first line has slope:

1

The second line has slope:

−1

Because their slopes are different, the lines travel in different directions and intersect once.

Their intersection is:

(2, 3)

Therefore:

Solution = (2, 3)


Why Intersecting Lines Have One Solution

Every point on the first line satisfies the first equation.

Every point on the second line satisfies the second equation.

Only at their intersection does the same ordered pair satisfy both equations.

Therefore, the system has exactly one solution.

https://images.openai.com/static-rsc-4/xqCj877U8nBOqj8-fJEWF6MLQV3ue_N_NbJSDg8Ewn4iho-wiAg0t-eEV4yEZF3XE0Un66n80owN5sXxu-amlW3whYff_TJ0fSrNo0C2OmwAe0hULq6xo4E7oTmhvIFprO9u7AX0bqQGNVgZrAXes0gwvW-HcP5NoVuql_lmlgT3K5Beg0aEbr0RLsiT3OAF?purpose=fullsize
https://images.openai.com/static-rsc-4/uy_ql4qkWtc8z9e-DGezRrRAQ5oHb6YY64lcgeYd2gJxLaXZpAHraruAS9L8e2CbEXbwlWju5vFjPbLhz1D38cjo7Rot7NhhlPqW_G4krERdXRFUTdrf1S6L0lI9jtONnhWhpDPAOymb_yoezUvghTkAjXPZPVW2Nt9Hl5g-RHdZw5BA1u9AkduVubUk6HWt?purpose=fullsize
https://images.openai.com/static-rsc-4/3W4NWaSRiMFYH1HhIKpyJwd7vrYVe8LQICNpEq6vsWbTu19kPge8KJVU4rML7HatHn0amA7jKmSafPIRrcpn9mLwXZT-O12FhBJoQ3jx7SlRZWC57lnI7-06mIRU_61ZQW_n_hhN8suK78k2HhySnLsMiq-7k98DbJX2fiziU44F_6KL8ni6wy1cNXN4muKo?purpose=fullsize
5

Different Slopes Mean One Solution

Consider equations written in slope-intercept form:

y = m₁x + b₁

y = m₂x + b₂

If:

m₁ ≠ m₂

the lines have different slopes.

Two non-vertical lines with different slopes will eventually intersect at exactly one point.

Therefore:

Different slopes → One solution

For example:

y = 2x + 3

y = 5x − 6

The slopes are:

2

and:

5

Therefore, the system has one solution.

We can know the type of solution without even finding the actual intersection.


Worked Example — One Solution

Determine the number of solutions:

y = 3x + 2

y = −2x + 7

Compare the slopes:

m₁ = 3

m₂ = −2

The slopes are different.

Therefore, the lines intersect once.

The system has one solution.


No Solution

A system has no solution when there is no ordered pair that satisfies both equations.

Graphically, this occurs when the lines are parallel.

Consider:

y = 2x + 1

y = 2x + 5

Both lines have slope:

2

But their y-intercepts are different:

1

and:

5

https://images.openai.com/static-rsc-4/czkBJUr6bglAqhvm1VW7yOh6ysdyd6FzUjDjSbWRm6a4Ujonw57HIHyGngYvInqyAKY_Em69QxI_2SpAPDQekESzPiihvhtYMR_E7JieejR4s9HILnfPp70Rsgy7k7omhwKPtliCHVRggjUgazib_JUJqPn3dkt2KnQS-o_8fcfgOXj7dnhlHgJqZQ5f3toa?purpose=fullsize
https://images.openai.com/static-rsc-4/G87IQoH7Yy0bcQ5XphrdDiYJEKXAqP70y0rW4pmWlCC-oGOhLjnvve671EgsXuVYVx7A6mZZ9iUUHvE8TiKOwgvkkRnJga-ZnVeVfcCgB6UxpcljwC74qU_tEcn9KwDHVzQHKql-uEPIusFsVJBh-b1iLDfnE5LZTpLdv0X8fXSKNpuBaAhmzQBfmX4aZ3YH?purpose=fullsize
https://images.openai.com/static-rsc-4/gKY8HRU63A-ENxWXqXD47PPgui5bRh6YlC2KgKsxQiNobUUas6yS9-0QBw20uFs5H2fGti8h4FbVALi-XWNRPYpyasYMoQLZPLeJ6rgY_OzaVdr-54QCJ-bAgR2FY76_mtKPKhsQM7XZPzinGjzGyxydAIu6sAaanHAQYdZJTmldHYCJzzMqg44aUmm71As1?purpose=fullsize
4

The lines have the same steepness and direction but cross the y-axis at different locations.

They never meet.

Therefore:

No solution


Why Parallel Lines Have No Solution

For a point to be a solution, it must lie on both lines.

Parallel lines never intersect.

Therefore, there is no point that belongs to both graphs.

This means there is no ordered pair that satisfies both equations simultaneously.


Same Slope, Different Intercepts

Suppose:

y = mx + b₁

and:

y = mx + b₂

If:

b₁ ≠ b₂

then the lines have the same slope but different y-intercepts.

They are parallel.

Therefore:

Same slope + different intercepts → No solution


Worked Example — No Solution

Determine the number of solutions:

y = −3x + 4

y = −3x − 2

Compare the slopes:

−3 and −3

They are the same.

Compare the y-intercepts:

4 and −2

They are different.

Therefore, the lines are parallel.

The system has no solution.


Infinitely Many Solutions

A system has infinitely many solutions when both equations represent exactly the same line.

Consider:

y = 2x + 4

and:

2y = 4x + 8

At first, the equations look different.

Simplify the second equation by dividing every term by 2:

y = 2x + 4

Now we can see that the equations are identical.

https://images.openai.com/static-rsc-4/QTc08t6j1NbTb_HzonU9I5Bw9m7h-MHTEUVE0HaTpOoTRWZOrW8LIbNNMJ32krC3Fa-nVPhqZqC--_UlRZxyGzjG4RMNzLa7yzGgQ-reJA-gK26LZQtNGRzOIHT9ulkLZpzWjJ44Ga3Z-hWlRdsWQHXHTiMJMoJQ0B_hP2Pwh7KCCSApVOBqJffpNlaHr6Te?purpose=fullsize
https://images.openai.com/static-rsc-4/G3rTVu9Ct_ucEWD1xWQI4i5K0ygwhoCHZB9AM552Li1jTl_xwIJL9-MTNlMGMoz-U9sNGi8KnmB_isv4JM66m9o2PLYK1drFiC0zK5ttsmUyrih8eWuG1DfB47lUOdLbwcrwTtbcKIG8LWoN2CFs7HhvwmuFR5nDhYeA3rrE1TpUp7MqXAN5LV2iEkF3AS3Q?purpose=fullsize
https://images.openai.com/static-rsc-4/ZxZtOGDPgPAFDyUW95xlw7l86fCe6u7-WlbWezpcn628A9d0VIVabPDcUrdOpJKx5DAF5ZGS-gyON0PCD3Yb8qHH8wByur_7Tuh-puW2MScBgH4Sx4Da_SugBGlzUCgWP-ZXqRJEmIsOZthq_TEJJxTrBOaCu3V1P-DoVauN-KWxG5dOHt-WgxtCmEF5IuQo?purpose=fullsize
4

Every point on the first line also lies on the second line.

Therefore:

Infinitely many solutions


Why the Same Line Has Infinitely Many Solutions

A line contains infinitely many points.

If two equations describe the same line, every point on that line satisfies both equations.

For example:

(0, 4)

(1, 6)

(2, 8)

and infinitely many other points all satisfy:

y = 2x + 4

If both equations represent this same line, all of these points are solutions to the system.


Same Slope and Same Intercept

If two equations simplify to:

y = mx + b

with the same m and the same b, they describe the same line.

Therefore:

Same slope + same intercept → Infinitely many solutions

However, the equations may need to be simplified before this becomes obvious.


Worked Example — Infinitely Many Solutions

Determine the number of solutions:

y = 3x + 6

2y = 6x + 12

Simplify the second equation:

2y = 6x + 12

Divide everything by 2:

y = 3x + 6

Both equations are now identical.

Therefore:

The system has infinitely many solutions.


Equations Can Look Different but Represent the Same Line

Consider:

x + y = 5

and:

2x + 2y = 10

Divide the second equation by 2:

x + y = 5

The equations are equivalent.

Therefore, they represent the same line.

The system has:

Infinitely many solutions

This is why it is important to simplify equations before comparing them.


Comparing Systems Using Slope-Intercept Form

Writing equations in:

y = mx + b

form makes solution types easier to recognize.

For example:

2x + y = 7

Rearrange:

y = −2x + 7

Now compare with:

y = −2x + 3

Both slopes are:

−2

but the intercepts are different.

Therefore:

No solution


Worked Example — Rearranging Before Comparing

Determine the type of solution:

3x + y = 8

y = −3x + 2

Rearrange the first equation:

y = −3x + 8

Now compare:

y = −3x + 8

y = −3x + 2

The slopes are equal.

The intercepts are different.

Therefore:

No solution


Worked Example — Hidden Equivalent Equations

Determine the type of solution:

2x + 4y = 12

x + 2y = 6

Multiply the second equation by 2:

2x + 4y = 12

This is exactly the first equation.

Therefore, both equations represent the same line.

The system has infinitely many solutions.


A Quick Comparison

For equations in slope-intercept form:

y = m₁x + b₁

and:

y = m₂x + b₂

remember:

m₁ ≠ m₂ → One solution

m₁ = m₂ but b₁ ≠ b₂ → No solution

m₁ = m₂ and b₁ = b₂ → Infinitely many solutions

https://images.openai.com/static-rsc-4/G3rTVu9Ct_ucEWD1xWQI4i5K0ygwhoCHZB9AM552Li1jTl_xwIJL9-MTNlMGMoz-U9sNGi8KnmB_isv4JM66m9o2PLYK1drFiC0zK5ttsmUyrih8eWuG1DfB47lUOdLbwcrwTtbcKIG8LWoN2CFs7HhvwmuFR5nDhYeA3rrE1TpUp7MqXAN5LV2iEkF3AS3Q?purpose=fullsize
https://images.openai.com/static-rsc-4/9QytqZcJAhKiEw4Tz4TpogNPFNC9jLy6jHpJBGsFPUSMhG4_ykYOLyGBORYpEa6O2sD3Yun0PmS3y7dG7p1CnbtkBkLoQE3y7SQ8V5HZ-he_X7yAry-6vb6UPUJicAazzUn7ftOVj-jZRZl_h6purAQzSG-DPWhRMAsmRYOWj1mkG4WDryD2vi62581nyjSu?purpose=fullsize
https://images.openai.com/static-rsc-4/kolf-iC6_v9D4sjf45wmqMiXeVPr2RudTUQ1SsrQ39zL9cJEk1ymyQDCaeEWIgcryJCfbLXeeNBWMTpGKRdosWIb2CrBBRov5ggBzj0BGBcVW0y8JaMmlmF_KlwjuR2-0Z8F2eqfazjQYeo1HZB--K9K_Hx-x_ssRtUd8gn_1JLZyNJ2oeb1M9v3zXhNsL8f?purpose=fullsize
6

This provides a fast algebraic way to classify many systems without graphing them.


Recognizing Solution Types from a Graph

If you are given a graph rather than equations, look at the relationship between the lines.

If the lines cross:

One solution

If the lines remain parallel:

No solution

If only one line appears because both graphs overlap completely:

Infinitely many solutions

Graphing gives us a visual way to classify systems.


Recognizing Solution Types from Equations

When given equations:

  • Simplify the equations if necessary.
  • Rewrite them in slope-intercept form when useful.
  • Compare their slopes.
  • Compare their intercepts.

Ask:

Are the slopes different?

If yes:

One solution

If the slopes are the same, ask:

Are the intercepts different?

If yes:

No solution

If both slope and intercept are the same:

Infinitely many solutions


Recognizing Solution Types Without Graphing

Consider:

y = 4x − 7

y = 4x + 3

You do not need to graph these equations.

The slopes are the same:

4

The intercepts are different:

−7 and 3

Therefore:

No solution

Recognizing these patterns can save considerable time.


What Happens When We Solve Algebraically?

The three types of solutions also appear when we use algebra.

Sometimes solving produces a value such as:

x = 3

This indicates that there is a specific solution.

But sometimes the variables disappear.

The statement that remains can tell us whether there are no solutions or infinitely many solutions.


When Algebra Produces a False Statement

Consider:

y = 2x + 1

y = 2x + 5

Since both equal y:

2x + 1 = 2x + 5

Subtract 2x from both sides:

1 = 5

This is impossible.

There are no values of x that make this true.

Therefore:

No solution

https://images.openai.com/static-rsc-4/tz3YKioWqpCl1VhgeXkH4DoRROdpFFU-2dIbssqR-MQHf9CCRJ2BoLU0JU2slkDBk-iVHaYJQsRk7fVeSG5jJ0V7fGmNkUr91lWNbLCJlM8MoeBu2PQn3HB_k9qlQmzumDDtY_S3fiI23XGT6wNNIoeXTsgJ7qmdc4OQhlOQ2UPiYtUmcjQ4SvcJgDmVczv3?purpose=fullsize
https://images.openai.com/static-rsc-4/eufjUWaTiYwcxtDAOyOpulG5dq6P95f9RrYjRD1uZYECDWukSr3VhTyWtT_ufMRSshR7L89KgG34Co3EeaOPXF3XQ_eDJ0dmdkVmRgVRbf5HVr0IMz-VPMkVeOPPXItBB52FegfE3ib8iKXpGdFCbAHWk-w730hcm6DhrvJ8BY2x86hGHv2_0EqO_WcnEGXG?purpose=fullsize
https://images.openai.com/static-rsc-4/G3rTVu9Ct_ucEWD1xWQI4i5K0ygwhoCHZB9AM552Li1jTl_xwIJL9-MTNlMGMoz-U9sNGi8KnmB_isv4JM66m9o2PLYK1drFiC0zK5ttsmUyrih8eWuG1DfB47lUOdLbwcrwTtbcKIG8LWoN2CFs7HhvwmuFR5nDhYeA3rrE1TpUp7MqXAN5LV2iEkF3AS3Q?purpose=fullsize
6

When Algebra Produces a True Statement

Consider:

y = 2x + 4

2y = 4x + 8

Simplify the second equation:

y = 2x + 4

If we compare the equations algebraically, everything cancels and we may obtain:

0 = 0

This statement is always true.

The equations represent the same relationship.

Therefore:

Infinitely many solutions


Contradictions and Identities

When solving systems, two special algebraic results can appear.

A contradiction is a statement that can never be true.

For example:

3 = 8

This indicates:

No solution

An identity is a statement that is always true.

For example:

0 = 0

This indicates:

Infinitely many solutions

These results connect algebraic solving directly to the graphical relationships between lines.


Why Different Systems Have Different Numbers of Solutions

The number of solutions depends on whether the equations describe different or identical relationships.

If the lines have different slopes, they eventually meet:

One solution

If they have the same slope but begin at different positions, they remain separated:

No solution

If they describe exactly the same relationship, they overlap completely:

Infinitely many solutions

https://images.openai.com/static-rsc-4/jaGPoI3duDO4LvVsPOlkIUp0WhthxaOx6D6cuWiRvkd76-RDKEASGmUoELfTjQLZC4eaEw9QtYy-Pp3_COvKMzJobAgG36l8BTg5bWgBM-2FkStvh87CndoR5sS2s1M581LYnpagG3EwjxhRFAdHIL1B2oyEaKSVXX7Bjdqlt-06h9EPgNoQFmXI4NIyfNGQ?purpose=fullsize
https://images.openai.com/static-rsc-4/k_NhYdXfFIhkoeI9wnRt0_qr_kW7qw5K7ZApabM1rq74RC6pZlOP6acE_bSNJ-lBhkyS7YWUrOUZCuWrEpaPPAaWFWvYFwwgomEEuFUyZfMcOGbICcCMgndkYiwHId3BSUnT0uBq4VRvHbPSpAhz5tpow3d9Vi0BUhaU5CcnzWoQaly353oLIMkQCkcAB7WX?purpose=fullsize
https://images.openai.com/static-rsc-4/3W4NWaSRiMFYH1HhIKpyJwd7vrYVe8LQICNpEq6vsWbTu19kPge8KJVU4rML7HatHn0amA7jKmSafPIRrcpn9mLwXZT-O12FhBJoQ3jx7SlRZWC57lnI7-06mIRU_61ZQW_n_hhN8suK78k2HhySnLsMiq-7k98DbJX2fiziU44F_6KL8ni6wy1cNXN4muKo?purpose=fullsize
5

Real-World Meaning of One Solution

Suppose two companies have pricing equations:

Company A: C = 3x + 10

Company B: C = 5x + 2

The slopes are different.

Their graphs intersect once.

The intersection represents the quantity at which both companies charge the same price.

Before or after that point, one company may cost more than the other.


Real-World Meaning of No Solution

Suppose:

Company A: C = 4x + 5

Company B: C = 4x + 10

Both companies increase their price at exactly the same rate:

$4 per unit

But Company B always starts $5 higher.

Their graphs are parallel.

There is no quantity at which the two companies charge the same price.

Therefore, the system has no solution.


Real-World Meaning of Infinitely Many Solutions

Suppose:

Company A: C = 3x + 6

and Company B's pricing rule simplifies to:

C = 3x + 6

The companies are charging exactly the same amount for every possible quantity.

Their graphs are identical.

Therefore, there are:

Infinitely many solutions

https://images.openai.com/static-rsc-4/XwiR4NdNxfGMmmVPOIRM6Aj38ogqaOrzAVW5-FPwFwJVRuY_I_KPwAld69vZqC-vtltvIqDG9KAAW9JwnYRHfcA7hTWhwNACPNwTfmQvNHBTd_fBYhSzFI76qE_L5txynKtcAcKS0ZlvFFigJIGlfPsTk2Mr9XwUJtwydgVlreYbUNBu7Q2RKmqqX0Ku2JLV?purpose=fullsize
https://images.openai.com/static-rsc-4/vC6RDfa05bvQFx97coUONWKP7ozkL385yHc4b03IX0iQD3wb55fiI4DOhUZrtVWqaHBTvslijKMb-I21hakcGFDn7IIVxqr9ZBiw6RsBaa0QNz_Ex2dFZBdGzX_3WaaYGKX5n3IqJQ8YLtNaht4G0yvvHPA2JhfGh2J7E7Fjeu5O4IrrlmC2Tl61D0M7CPCi?purpose=fullsize
https://images.openai.com/static-rsc-4/UtvZ4J57AiktpPQjhQqg5vlecc_mVmJmW36b9FBx_xz6eSruyR_Uw__kPIGn8rYlEd76ZxCx2C0IDwpGGzJ4_1HV0skx2AONvuY04-LkD3v4Wx0WUCcxqkqpdf_MaMDDCF2r6ggUwe2tQk-Srpu5N6bUSUAIpGPbRTxz045308vZ6tyzuwb4eIX-s4fnZM7t?purpose=fullsize
6

Classifying Without Finding the Actual Solution

Sometimes a question asks only:

How many solutions does this system have?

You do not necessarily need to solve the entire system.

For example:

y = 7x + 4

y = −2x + 9

The slopes are different.

Therefore:

One solution

We do not need to calculate where the intersection occurs unless the problem specifically asks for the solution.


Worked Example — Classify the System

Consider:

y = 5x − 2

y = 5x + 8

Slope of first line:

5

Slope of second line:

5

The intercepts are:

−2

and:

8

Same slope, different intercepts.

Therefore:

No solution


Worked Example — Another Classification

Consider:

4x + 2y = 10

2x + y = 5

Multiply the second equation by 2:

4x + 2y = 10

This matches the first equation exactly.

Therefore:

Infinitely many solutions


Worked Example — One Solution in Standard Form

Consider:

2x + y = 7

x − y = 2

Rewrite the first equation:

y = −2x + 7

Rewrite the second:

−y = 2 − x

so:

y = x − 2

The slopes are:

−2

and:

1

Because the slopes are different:

One solution


Connecting Graphical and Algebraic Evidence

The graphical and algebraic approaches tell the same story.

Different slopes

Graphically: the lines intersect.

Algebraically: solving produces one ordered pair.

Result:

One solution

Same slope, different intercepts

Graphically: the lines are parallel.

Algebraically: solving produces a contradiction such as 0 = 4.

Result:

No solution

Equivalent equations

Graphically: the lines overlap.

Algebraically: solving produces an identity such as 0 = 0.

Result:

Infinitely many solutions


Common Mistakes

Mistake: Assuming Every System Has One Solution

Systems can have one, zero, or infinitely many solutions.

Always examine the relationship between the equations.

Mistake: Looking Only at the Y-Intercept

Different intercepts do not automatically mean no solution.

For example:

y = 2x + 1

and:

y = 3x + 5

have different intercepts but also different slopes.

They will intersect.

Therefore, they have one solution.

Mistake: Looking Only at the Slope

If the slopes are equal, you must also compare the intercepts.

Same slope + different intercepts:

No solution

Same slope + same intercept:

Infinitely many solutions

Mistake: Comparing Equations Before Simplifying

For example:

2y = 4x + 6

should first be simplified to:

y = 2x + 3

before comparing it with another equation.

Mistake: Thinking Overlapping Lines Have One Solution

If the lines overlap completely, every point on the line satisfies both equations.

There are:

Infinitely many solutions

Mistake: Confusing a Contradiction with an Identity

0 = 5

is impossible and indicates:

No solution

0 = 0

is always true and indicates:

Infinitely many solutions


Key Terms

System of equations – two or more equations considered together.

Solution – values that satisfy all equations simultaneously.

One solution – exactly one ordered pair satisfies the system.

No solution – no ordered pair satisfies the system.

Infinitely many solutions – infinitely many ordered pairs satisfy the system.

Intersecting lines – lines that meet at a point.

Parallel lines – lines with the same slope that never meet.

Coincident lines – lines that lie exactly on top of each other.

Slope – the rate of change of a line.

Y-intercept – the point where a line crosses the y-axis.

Contradiction – a mathematical statement that cannot be true.

Identity – a mathematical statement that is always true.


Check Your Understanding

1. How many solutions does a system have when two lines intersect once?

2. How many solutions does a system have when two lines are parallel?

3. How many solutions does a system have when two equations represent the same line?

4. Classify:

y = 2x + 3

y = −x + 6

5. Classify:

y = 4x + 1

y = 4x − 7

6. Classify:

y = 3x + 5

2y = 6x + 10

7. Explain why two lines with different slopes must have one solution.

8. Explain why parallel lines have no solution.

9. Explain why identical lines have infinitely many solutions.

10. Classify:

2x + y = 8

y = −2x + 3

11. Classify:

3x + 6y = 12

x + 2y = 4

12. What does a result such as:

0 = 7

tell you about a system?

13. What does a result such as:

0 = 0

tell you about a system?

14. A student says that two equations with different y-intercepts can never have a solution. Explain why this is incorrect.

15. Describe how slope and y-intercept can be used to determine the number of solutions without graphing the system.


Key Takeaways

  • A system of two linear equations can have one solution, no solution, or infinitely many solutions.
  • Intersecting lines have one solution.
  • Parallel lines have no solution.
  • Identical or coincident lines have infinitely many solutions.
  • Lines with different slopes have one solution.
  • Lines with the same slope but different intercepts have no solution.
  • Lines with the same slope and the same intercept represent the same line and have infinitely many solutions.
  • Equations may need to be simplified before their relationship becomes obvious.
  • A contradiction such as 0 = 5 indicates no solution.
  • An identity such as 0 = 0 indicates infinitely many solutions.
  • Graphical and algebraic methods describe the same relationships.
  • You can often determine the number of solutions without finding the actual solution.
  • Understanding solution types helps explain how two linear relationships compare.

Did You Know?

The three possible solution types are really descriptions of the geometry of straight lines. Two distinct lines in a plane either intersect once or are parallel, while two equations can also describe the exact same line. This simple geometric idea explains why a system of two linear equations can have one, zero, or infinitely many solutions—but never exactly two or three solutions.