Introduction to Functions

Website: Young Education
Kurs: Functions and Graphs
Buch: Introduction to Functions
Gedruckt von: Guest user
Datum: Freitag, 25. September 2026, 01:05

1. Relations and Functions

Learning outcomes
  • I can distinguish between relations and functions.
  • I can identify inputs and outputs in a relation.
  • I can determine whether a relation is a function.
  • I can represent functions using mapping diagrams.
  • I can explain why each input in a function has only one output.

Introduction

Mathematics is full of relationships between quantities. For example, the number of hours worked determines a person's wages, the radius of a circle determines its area, and the time travelled at a constant speed determines the distance covered. These relationships can be described using relations and functions.

A relation simply connects inputs and outputs, while a function is a special type of relation in which every input is matched with exactly one output. Understanding the difference between relations and functions is fundamental to algebra and prepares you for graphing, modelling real-world situations, and studying more advanced mathematics.


What Is a Relation?

A relation is any set of ordered pairs that shows a relationship between two variables.

An ordered pair is written as: (x, y)

where:

  • x is the input (independent variable).
  • y is the output (dependent variable).

Example: {(1,3),(2,5),(3,7)}

This relation connects each input with an output.


https://images.openai.com/static-rsc-4/mgWV_tJX9XCJoe2GGMDBImysA5nqz8L8nWCuGL1MXMby1BDjQmGaWR8jbAhxlIRF1zonQes00RcgTBSY5CaHpOyVvljxnD_JtjM2IdOLWPb3-0F1BZqWT2Bj-K1pGmvvzwDIoiKyDg0NWOgDcpvZ9DmK0jhP1gG1LPwbcXkOsDLKVq4U-Km6ICZoSWWLRca5?purpose=fullsize
 
https://images.openai.com/static-rsc-4/q9HW6mUoDIlHpOC2opFD7yyt9XhWLwlzzvoHof5SWXRiziRCwP6YNX3hhCjcm6zETndd_BETserLl2c18h7GazCHqIoIjDCA9iK4FYNNg1GtDYABUlBPCZjHdFKRyYDZbwhiHDcwFX6Ob4nt05x5aGh454mTcHVP0qDcstrCieJ5gBXNh6c29zJ5ucXOGlmY?purpose=fullsize
 
https://images.openai.com/static-rsc-4/vfxlDw56yiqvLEGoTa0-DBF-9I1yT7Zy6713JGyXJWcc2jhDf-4d85z4JqPrGG72bgje4JtAvsCeui3riOeK6Zqjd7HYfHBx4MZgFIlVWN7-QQaULX75G170aeEq_Cr3PNFJ41FL3Ss3-kMAEwOZ3oVVq8VujeTtISEqx9sM5VFBJ8HczAirkFcr7QX1x_PJ?purpose=fullsize
5

Figure 1. A relation is a set of ordered pairs connecting inputs and outputs.


Inputs and Outputs

Every relation has:

Input

The value placed into the relation.

Usually represented by:

  • x

Examples:

  • Time
  • Distance travelled
  • Number of items

Output

The value produced by the relation.

Usually represented by:

  • y

Examples:

  • Cost
  • Area
  • Temperature

The input determines the output.


Domain and Range

The domain is the set of all input values.

The range is the set of all output values.

Example:

Relation: {(1,4),(2,6),(3,8)}

Domain: {1,2,3}

Range: {4,6,8}

The domain contains all x-values, while the range contains all y-values.


What Is a Function?

A function is a special type of relation.

In a function:

Every input has exactly one output.

Each input may produce:

  • One output ✔

It may not produce:

  • Two or more different outputs ✘

https://images.openai.com/static-rsc-4/zU8w-8orNQ8rG4dYYs5wCqvVsAYQlTbhcl7M8kdLtp8UbJ52TQsgxgvyct1uRUGwAVmCe8Wud_YLRhf5BZ0I9_KBpqgxlW7VSONfk8N_KolcGNCFGIMtWKKqc4BzpYnjjX1tOYq2CcbjRXl6gl03clg1ehemRx9UmZTvl_nbJKAPql6daBUAofd_nsiZCkn5?purpose=fullsize
 
https://images.openai.com/static-rsc-4/l1gV9y3QG-NoxBsTh5nO2Ph_dHiLauS4TD9dxqP-DnCQ7ll8dPIHZFBJifGRKV9w5IC0R_AUH54SraqA8nu9VV2Q1-_ZMqMaCBSgqzUemnLe6O1RFUVwixkL88XnHiWzH1BkjOmqdNKvii0I5GyVH0clhy_o0DP0wfJZb3cLS95V04A4CFwhjl1Zr1h2uqIH?purpose=fullsize
 
https://images.openai.com/static-rsc-4/yGqIY12nip1HR24dyq595WNlDRe5l3UHoT3ADFxjAlN75Hhkq30L5iV3rlEfXu70_mDGiqgBAg3Dt9GcfRccCOfuMliNK_IwJFOsTK4BHCMW9kVReJ5uD2NoghKCwWYo1I82Pd6bO6XVy7u0d7GFp5sEIslV5eRn5hrfpCWPwWMK1d39w2vMsKMv5Bn2CQwL?purpose=fullsize
5

Figure 2. In a function, each input points to exactly one output.


Is It a Function?

Example 1

{(1,4),(2,6),(3,8)}

Each input appears once.

✔ Function.


Example 2

{(1,4),(1,7),(2,5)}

Input 1 has two different outputs.

✘ Not a function.


Mapping Diagrams

A mapping diagram shows how inputs connect to outputs.

Example:

Domain

1

2

3

↓

Range

4

6

8

Each arrow represents one ordered pair.

If every input has exactly one arrow leaving it, the relation is a function.


https://images.openai.com/static-rsc-4/3ocEIFRc5OWZiekhPpL2L1JtpCnTdV66BgV8V1bYvuhHaYnas_sW83o3WTOsTnqR3NzlBGWWXbiToR_uIKKsOZCoNNXhrEEHZ8k_vM-AiXSyc1GO2kvFyiJVuYGwwMX-9dAJn6s9x6png9PTj3B4kZF1jzQpPn9xvKnxK8qn0z1N1CCGF-1fgBM48XRzs50C?purpose=fullsize
 
https://images.openai.com/static-rsc-4/5eGqqvnt6Yf8TSte8CaAtBcPCyts8i1ln4QGu6EnqlCNOzWg7oNPER9wK9i3pZY6-YtU1osbAXz5aICCU53BeNZNWclSUgoTBhLKRfGrLUh5k17UzEb2I37bhdje5htff8YHLfF4qnPbgvJ6VHV4hOe5EUuej2y67y3W6ognp3G-B4MeQZZD6JlPbb9-7gLd?purpose=fullsize
 
https://images.openai.com/static-rsc-4/zwSz32E4D2pMc_MPKL32WXUQEa1aBIXr6tXEoo6OdYKt1vmEjeZlM9pBpKPy5fvDNQ5Xankx-p2p1UMIz2T6gkrzFohxi_ozTTA-RQEHDNij4LKwduB2yDY8uMoKLgBWiNIctxRLw8QODt87-Zd-80ky8TVDhGlPm3RtMMxZn_8bESjHiRKSzXxiCM2HmtFz?purpose=fullsize
5

Figure 3. Mapping diagrams make it easy to determine whether a relation is a function.


One Output, Many Inputs

Different inputs can have the same output.

Example:

{(1,5),(2,5),(3,5)}

This is a function because:

  • Input 1 → Output 5
  • Input 2 → Output 5
  • Input 3 → Output 5

Each input still has only one output.


Not Allowed in a Function

An input cannot have two outputs.

Example:

{(2,4),(2,7)}

Input 2 produces:

  • 4
  • 7

Since one input has multiple outputs:

✘ Not a function.


Representing Functions

Functions can be represented in several ways.

Ordered Pairs

(1,3), (2,5), (3,7)

Tables

 Input (x)   Output Ja 
1 3
2 5
3 7

Mapping Diagrams

Arrows connect each input to its output.


Graphs

Functions can also be shown on a coordinate plane.

Later, you will learn how to recognise functions using the vertical line test.


https://images.openai.com/static-rsc-4/WHiA8JtfoCNpJhtV-RbJkPB0uVUtb3Nohpo8PHRHa85RTjtrOlo6HVuj0UuMqZ9SdGF3bOv5VZVuGESwGRRD3qIkzZ4_XbYeddOEOF15L6CXlEfBsyBLff-I0lnhRI-ZghYsmFEKve8MmlbraSbsSLdgMX9xlkqvn4urXA_Dc2-nMFoL97wgWBpVNzy56VC-?purpose=fullsize
 
https://images.openai.com/static-rsc-4/tXbjWPtK-EfhWqPp9mHYPEXY7fanue7bwnXGfITgWrKyYuwO5B_Oaq9JwOD_HhB8c69VAu0sRKpbTytrZrvs24A_q9VYOpWlyen16QyEDfiGBfWqucA24VlBKUekDAg9clVkyqsT3OCbcrwHO7COc7gg6HwWFE83l3QIVp0Lkgoq_ScPJPsbctyh2vqcAnc3?purpose=fullsize
 
https://images.openai.com/static-rsc-4/5oJwUIJ_BguW3l0w3wdqBxcNN_QS9ciI2Y9vDeapzL97b4jymgFFhPRZANXCw_DWaJZhytfWDeTPN6LIXf4-Xb4c98gWFVy9RvP_skz26XPqUS3UiPt82t5XbcVJt6PliPrRsrMSBCjnQzsF9dobsQnYK44LFYp0zKQZLe7QNJur_5BafqDgaNAZJm_kJsEo?purpose=fullsize
6

Figure 4. Functions can be represented using tables, mapping diagrams, ordered pairs, and graphs.


Real-World Examples

Student ID Number

Each student ID belongs to exactly one student.

✔ Function.


Person → Birthday

Each person has one birthday.

✔ Function.


Person → Favourite Food

Each person may have several favourite foods.

✘ Not necessarily a function.


Country → Capital City

Each country has one official capital city (for this level of study).

✔ Function.

Functions are useful because they describe predictable relationships.


Why Functions Matter

Functions are used throughout mathematics and science.

They help describe:

  • Motion.
  • Population growth.
  • Temperature changes.
  • Business profits.
  • Scientific experiments.

Understanding functions allows us to model real-world situations using mathematics.


https://images.openai.com/static-rsc-4/xBqawa2zVNZuv23qomalH5crXIPKqTXQhny2qhj-4v84LUuiOl9OdsvL3awm75u-yeeLG2t_9mgCPD_VPklRlxp2Rl8a--mbrmlTkc7TTLCXxPgT9fMUWwKvvpbqFqYhdYia5kRtl1Y4XZ--QAoXo0Vu5RhjaMEIOS7zOoJzRa2kUaWQhqzyDLSoLdyvKWs3?purpose=fullsize
 
https://images.openai.com/static-rsc-4/wSbBii9wWfd_LziK17UpdhxYsegTZDNDR19EYrBxW-GOxRvvJr8BPKly0QLVHAo4YTvvpcJbeSjqSIYRxzDrt3UCs4szFUYwUNktH4moNMuEtvu4ozFzB52Qfb6OOm1jDwNkEBYPhyfh1ERYacSVL42p53MjTGCiaA3ZuidlqzPwRmkmuwl4RHBYgCLyXR_i?purpose=fullsize
 
https://images.openai.com/static-rsc-4/prO3RfVmwnIgJpK-GFDmvZmoToW4uuzU0K69-Gm-2whBbJsq0GJqASDo0HBugrfIn6TnjZQDTayfpX8IVFxkwmQHtuuHRFbHssqfQEvwtYQR_JSP0ZIsDwOdBYltLORYpCQ2_b4Wq099W2ghIy9DRblcz_LCHDYka5CnnnAPxm3gCZaoEgZLg7VVsZRMiIkS?purpose=fullsize
5

Figure 5. Functions model many real-world relationships by assigning one output to each input.


Worked Example

Question

Determine whether the following relation is a function.

{(2,5), (4,8), (6,11), (2,9)}


Solution

The input 2 is paired with:

  • 5
  • 9

Since one input has two different outputs, the relation is not a function.


Real-World Connection

An online shopping website uses functions whenever it calculates the total cost of an order. If you purchase a specific number of identical items at a fixed price, each number of items (the input) corresponds to exactly one total cost (the output). This predictable relationship allows computers to calculate prices quickly and accurately.


Did You Know?

Functions are used extensively in computer programming. Every time you use a calculator app, search engine, or navigation system, mathematical functions help transform inputs into outputs. For example, entering a destination into a GPS produces one calculated route based on the information available, demonstrating how functions are used in everyday technology.


Key Terms

Domain – The set of all input values in a relation or function.

Function – A relation in which every input has exactly one output.

Input – The independent value that is entered into a relation or function, usually represented by x.

Mapping diagram – A diagram that uses arrows to show how inputs are matched with outputs.

Ordered pair – A pair of numbers written in the form (x,y) representing an input and its corresponding output.

Output – The dependent value produced by a relation or function, usually represented by y.

Range – The set of all output values in a relation or function.

Relation – A set of ordered pairs showing a relationship between two variables.


Key Takeaways

  • A relation is any set of ordered pairs connecting inputs and outputs.
  • A function is a relation in which every input has exactly one output.
  • The domain contains all input values, while the range contains all output values.
  • Mapping diagrams are useful for determining whether a relation is a function.
  • Multiple inputs may share the same output, but a single input cannot have multiple outputs in a function.
  • Functions are used to model predictable relationships in mathematics, science, technology, and everyday life.


2. Domain and Range

Learning outcomes
  • I can define the domain and range of a function.
  • I can determine the domain from tables, graphs, and equations.
  • I can determine the range from tables, graphs, and equations.
  • I can identify restrictions on the domain of a function.
  • I can explain the meaning of domain and range in context.

https://images.openai.com/static-rsc-4/RE6E_GG_SrA8Xqo6xAdqeu6nip5ErP1LzTZXhW4KRsJ5iCpDaAfujqpAD9TO1WTqjXCFBSaozpWORA8Xv2YZxuQGuxkW3txtbGUiCiSrQyjRRTNbcoYz-E_NQBSXeq3NoEoMzhprXpOctBKIwQnWlxu5kK28-GLxCf-pnQeE6OEh9FrazGOltq6Yev4ex9cv?purpose=fullsize
 
https://images.openai.com/static-rsc-4/Zmgp9AOxVZbEnH2t-XqOQzA2Tv1QWfENGOGGzzAjxHso5qxG8rpfwz1YNkCdIj50mGvHKfym2VnRuZslLYsYHQkq1lQQ0e2XVvoezPFR6K1tPAYob67xGZo06kAYYzJlkH5NWbXaxmjQgDnXmFucbExfmpZN2uzkSoI_K-uJdYqMxOGwWWr0VfpQP2LN7RfP?purpose=fullsize
 
https://images.openai.com/static-rsc-4/eMgCthf-1qJlntW5XStkZU0EddCAVXA6hksRReTVDZMMiqC299lrCqE9XWe6X5nmD9HE4koEtgYmxzz_Ag6wPFe-Lb9-D1e-1cZITBiDvhlhVBzxoxVaJTpvVf31t2lFZDVTedfV7Kb-ElMAlqfYdnx5U3B9tTCRFcrytU6zmp567gC78kXJ3YSUJn-kJRbz?purpose=fullsize
 
5

What Are Domain and Range?

A function describes a relationship between:

inputs and outputs.

We usually represent the input using:

x

and the output using:

y or f(x).

For example:

y = 2x + 1

We can choose an input value for x and use the function to calculate an output.

If:

x = 3

then:

y = 2(3) + 1

y = 7

So:

Input = 3

Output = 7

Domain and range describe the possible:

inputs and outputs of a function.


Domain

The domain of a function is:

the set of all possible input values.

In most functions, the input is represented by:

x.

A useful way to remember this is:

Domain → Inputs → x-values

If a function can accept x-values of:

1, 2, 3, and 4

then its domain is:

Domain = {1, 2, 3, 4}


Range

The range of a function is:

the set of all possible output values.

Outputs are usually represented by:

y or f(x).

Remember:

Range → Outputs → y-values

If the outputs of a function are:

3, 5, 7, and 9

then:

Range = {3, 5, 7, 9}


Input → Function → Output

We can think of a function as a:

function machine.

An input enters the machine.

The function performs an operation.

An output is produced.

For:

f(x) = 3x + 2

we could have:

Input: 4

↓

Multiply by 3

↓

Add 2

↓

Output: 14

The input belongs to the:

domain.

The output belongs to the:

range.

https://images.openai.com/static-rsc-4/TchFi7MNSXGxfOD3sboYUkca0bVpN0Bf4i0NzVDdvcQjhy83adOoNzPw6kirpS4l6ouksVKm_6z9fY3ayp8hILBJI2_SrX40CHemO42RQ22st57YVrm1qIFCPdHWP-YK717IPURHQ9RvmQCjOggU9-Hu2wInkLjTMPsIjFxgeyb7aUFAUeLUbVuCZUt21yXx?purpose=fullsize
 
https://images.openai.com/static-rsc-4/Zmgp9AOxVZbEnH2t-XqOQzA2Tv1QWfENGOGGzzAjxHso5qxG8rpfwz1YNkCdIj50mGvHKfym2VnRuZslLYsYHQkq1lQQ0e2XVvoezPFR6K1tPAYob67xGZo06kAYYzJlkH5NWbXaxmjQgDnXmFucbExfmpZN2uzkSoI_K-uJdYqMxOGwWWr0VfpQP2LN7RfP?purpose=fullsize
 
https://images.openai.com/static-rsc-4/ZzwKZUAWs_Q2hVsjjY9edhxHk8VoaJxIYylwmYUV1Kn-xH_7KeK20t_UFnoAFkxKBSvDVMtLRrz9IhhydTfD1mByP-O9r3pYG836HYbia8W1A36Xj_H9fZ6u1xozpIb9zXlG9nB7zuRTrL1kpnEttR11ltrFDEwJYkuTcid3cyjMwdL-zdy1yhZkpiOeaqX6?purpose=fullsize
 
5

Domain and Range from a Table

Consider:

x y
-2 1
-1 3
0 5
1 7
2 9

The domain consists of the:

x-values.

Therefore:

Domain = {-2, -1, 0, 1, 2}

The range consists of the:

y-values.

Therefore:

Range = {1, 3, 5, 7, 9}


A Simple Rule

When reading a table:

Domain → look at the x-column

Range → look at the y-column

This works because x represents the:

input

and y represents the:

output.


Repeated Values in the Range

Consider:

x y
-2 4
-1 1
0 0
1 1
2 4

The domain is:

Domain = {-2, -1, 0, 1, 2}

The outputs are:

4, 1, 0, 1, 4

But when writing the range as a set, we do not need to repeat values.

Therefore:

Range = {0, 1, 4}

Notice:

Different inputs can produce the same output.


Domain and Range from Ordered Pairs

A relation might be written as:

(-3, 2), (-1, 4), (0, 5), (2, 4), (5, 8)

The first number in each ordered pair is:

x.

Therefore:

Domain = {-3, -1, 0, 2, 5}

The second number is:

y.

Therefore:

Range = {2, 4, 5, 8}

The value 4 appears twice as an output, but we only list it:

once.


Domain and Range from a Mapping Diagram

A mapping diagram can show inputs and outputs visually.

For example:

Domain

1
2
3
4

↓

Range

3
5
7
9

The values on the input side form the:

domain.

The values that actually receive arrows on the output side form the:

range.

https://images.openai.com/static-rsc-4/-bj4IeTX1YtgO_j1e3GzeS-MQT4zdmNhjCWAvZFzoq0YYjGEzN8BpoqXAeOrD5DD46eyGucUvXRwLUl3UW1iu5OmxZkDg-akl9SyDOTXHw8JQBdahieY_pVEPuIhaIcf33K6UCDwDwyWP06NM6WTUN_kydQLwtrXNGLAVe3Mk3q8Et8XwE0uZc6Azm5chZDb?purpose=fullsize
 
https://images.openai.com/static-rsc-4/Al-TelxaNd24sggUUrSBbgxrWWBNWBpW3jJHvWZRC8jGzVrvEoHDe-k1Sz3dI8sMHffh2jTKvmqNg5Aqm1aRHoSces4M18_jIKvbXWPXwh0Tf3-Zuyw3YTfknRvs144P4MOn_8wMBo4KD2ujrgoAPj6a2xPfj-4ozlNtetXU1H2912vJnXAxxbxCHOCXfjTD?purpose=fullsize
 
https://images.openai.com/static-rsc-4/ZzwKZUAWs_Q2hVsjjY9edhxHk8VoaJxIYylwmYUV1Kn-xH_7KeK20t_UFnoAFkxKBSvDVMtLRrz9IhhydTfD1mByP-O9r3pYG836HYbia8W1A36Xj_H9fZ6u1xozpIb9zXlG9nB7zuRTrL1kpnEttR11ltrFDEwJYkuTcid3cyjMwdL-zdy1yhZkpiOeaqX6?purpose=fullsize
 
5

Domain and Range from a Graph

A graph gives us a visual way to determine:

domain and range.

To determine the domain, ask:

How far does the graph extend horizontally?

To determine the range, ask:

How far does the graph extend vertically?

A useful memory aid is:

Domain → left to right

Range → bottom to top


Reading Domain Horizontally

Imagine shining a light on the graph from:

above.

The shadow the graph creates on the x-axis represents its:

domain.

Every x-value touched by that horizontal spread belongs to the:

domain.


Reading Range Vertically

Now imagine shining a light from the:

side.

The shadow the graph creates on the y-axis represents its:

range.

Every y-value covered by the vertical spread belongs to the:

range.

https://images.openai.com/static-rsc-4/0rGrr8IxJlIs3zKx_rokDfcf-SaDv8Uvwalf0gps7WgVYOdDroXCLmkCtdj1RpYz3lZRgU7le_exQ5GcdHA0z7TBDzbiUU_2_lEweyE5PVaWJsNye4SgSocSGf1WWaNOaGepC0a6pyEDHjXmuw1k6Pu_tAdmB__Ac1I88JvWDPt4xyBqANTuVC_MkDkXWuWN?purpose=fullsize
 
https://images.openai.com/static-rsc-4/iW7fNXUi420C85yPpYcBkhXG7pvKcDaGkyPeC80fn4iCpOqUlhMDEDyTujx7uGrByaSuZNap40_T9AN0J6M2iiiZ4OE1oR-lmln2WqLeQVfxc_n115FQbiz0il7WCwycqy1ckEvlmeyD3OvJ-G1g_7DINPagTd8U3IGK18aXm3yK2yPvbvx1MQzaza4Pnkap?purpose=fullsize
 
https://images.openai.com/static-rsc-4/j4l-wJNWbUzvyZzqi3tC71dC6ots5TekMdTVzyUTGENLjEOsADjm_C2s1tt4N5C8enAzsWO62hke-3DVFXociZ4VWs0LdS02MGFHEEQ_uwjMI2x65cYjyIyGe0wiFDDSsSSrGDg-gRqfEvhncjObvLN972X9PeDxlLTfUgXaRcO9d6878ou4liGq_P7iqVtg?purpose=fullsize
 
5

Example: A Finite Set of Points

Suppose a graph contains the points:

(-3, 2), (-1, 5), (2, 1), (4, 5)

Read the x-coordinates:

-3, -1, 2, 4

Therefore:

Domain = {-3, -1, 2, 4}

Read the y-coordinates:

2, 5, 1, 5

Therefore:

Range = {1, 2, 5}


Example: A Line Segment

Suppose a line segment begins at:

(-2, 1)

and ends at:

(4, 7).

If both endpoints are included, then the x-values extend from:

-2 to 4.

Therefore:

Domain: -2 ≤ x ≤ 4

The y-values extend from:

1 to 7.

Therefore:

Range: 1 ≤ y ≤ 7


Closed Points

A closed point means that the endpoint is:

included.

For example:

x ≥ 2

includes:

x = 2.

We use:

≥

rather than:

>.

Similarly:

x ≤ 5

includes:

x = 5.


Open Points

An open point means the endpoint is:

not included.

For example:

x > 2

does not include:

x = 2.

Similarly:

x < 5

does not include:

x = 5.

https://images.openai.com/static-rsc-4/JD3QWPK65klBKYHix3abv38J5E1mVNMrBp6cwq3q2XnKV1v8H3-53fZO7VJiTfVRLYemnRC96giSv-MI6dWCkQG-L9oSwcercFbD4LBl2OhlMVofS1RAAJWhr1D6F-pgGT9ZIRXM7VIC3EyQhwyUJnDDlPaW8UfvaaxySbV_vbfFWrQQ70oxMjaBbrmTr3cj?purpose=fullsize
 
https://images.openai.com/static-rsc-4/Siw7tSW5ZrG-9LhE7itTZriDy3JcIDbqtpRMiqfeb2VwZYfvsOidMDQmAcw5B9efdpT16LnBNQ2V17a9DFYnCNw_XtlMjF_M0lVfo8C2rqFNRgM67kZWLVbSTKOx8xPltSzY619lIzEzqXS9OwkSn7lWy3-dyCYvijnSCIjZNpkklTLkC8XrrmebfXVtYJvW?purpose=fullsize
 
https://images.openai.com/static-rsc-4/tMDygX8xvyk7hn9_83_sBRonO48dxIcnNUnQDlHgLFN0lZOxNsfH86JIMEcwDrhTmpi2mVbuNFx22qUdCM1y5MzSgVigH5hAqxKg-BvDtbwBkXWe-yqwh6R8rwlg-BnGNnen4oYDVnF8SltLEI4HtY_X3f47CGHfcfAWJPXvhIddEznjsz3S_AMiaBvhr0P-?purpose=fullsize
 
5

Inequality Notation

Domain and range are often expressed using:

inequalities.

Examples:

x ≥ 0

means x can be:

0 or any larger value.

x < 5

means x can be:

any value less than 5, but not 5 itself.

-3 ≤ x ≤ 7

means x can be any value from:

-3 through 7, including both endpoints.


Interval Notation

Another way to express domain and range is:

interval notation.

For example:

-3 ≤ x ≤ 7

can be written:

[-3, 7]

Square brackets mean:

endpoint included.

For:

-3 < x < 7

we write:

(-3, 7)

Parentheses mean:

endpoint not included.


Mixed Endpoints

Suppose:

-3 ≤ x < 7

Then:

-3 is included

but:

7 is not included.

Interval notation:

[-3, 7)

The bracket matches the:

included endpoint.

The parenthesis matches the:

excluded endpoint.


Infinity

Suppose the domain is:

x ≥ 2

This means the graph begins at x = 2 and continues indefinitely to the:

right.

We can write:

Domain: x ≥ 2

or:

Domain: [2, ∞)

Infinity is not an actual endpoint.

Therefore, we always use a:

parenthesis with infinity.


Domain of an Equation

Sometimes the domain can be determined directly from the:

equation.

Consider:

f(x) = 2x + 5

Can we substitute:

x = 1?

Yes.

Can we substitute:

x = -100?

Yes.

Can we substitute:

x = 0?

Yes.

There is no obvious restriction on x.

Therefore:

Domain = all real numbers

or:

Domain: -∞ < x < ∞


Linear Functions

Most ordinary linear functions have:

all real numbers

as their domain.

For example:

f(x) = 4x - 7

Any real value of x can be substituted into the:

equation.

The graph also extends forever to the:

left and right.


246−2−4−1−2−3−4−5−6−7−8−9
0,0
Give feedback

For this function:

Domain = all real numbers

and:

Range = all real numbers.


Quadratic Functions

Consider:

f(x) = x²

Any real value can be used for:

x.

Therefore:

Domain = all real numbers

However, squaring a real number cannot produce a:

negative result.

So:

Range: y ≥ 0


246−2−4−61234−1−2−3−4−5−6
0,0
Give feedback

The graph extends forever:

left and right,

but its lowest y-value is:

0.


Another Quadratic Example

Consider:

f(x) = x² + 3

The parabola has been shifted:

3 units upward.

The domain is still:

all real numbers.

But the smallest possible output is:

3.

Therefore:

Range: y ≥ 3


246−2−4−61234567−1−2−3
0,0
Give feedback

Square Root Functions

Consider:

f(x) = √x

Can we substitute:

x = 4?

Yes.

√4 = 2

Can we substitute:

x = 0?

Yes.

√0 = 0

Can we substitute:

x = -4?

Not if we are working with real numbers.

Therefore:

Domain: x ≥ 0

The outputs are also non-negative.

Therefore:

Range: y ≥ 0


246−2−4−61234−1−2−3−4−5−6
0,0
Give feedback

Why Square Roots Can Restrict the Domain

For real-valued functions:

the quantity inside an even square root cannot be negative.

Consider:

f(x) = √(x - 3)

We need:

x - 3 ≥ 0

Therefore:

x ≥ 3

So:

Domain: x ≥ 3


Worked Example: Square Root Restriction

Find the domain of:

f(x) = √(x + 5)

The expression inside the square root must be:

greater than or equal to zero.

Therefore:

x + 5 ≥ 0

Subtract 5:

x ≥ -5

Therefore:

Domain: x ≥ -5


Fractions Can Restrict the Domain

Consider:

f(x) = 1 ÷ x

What happens when:

x = 0?

We would have:

1 ÷ 0

Division by zero is:

undefined.

Therefore:

x cannot equal 0.

So:

Domain: x ≠ 0


0.511.522.5−0.5−1−1.5−2−2.50.511.5−0.5−1−1.5−2−2.5
0,0
Give feedback

Notice that the graph never touches:

x = 0.


Denominators Cannot Equal Zero

This gives us an important rule:

The denominator of a fraction cannot equal zero.

Consider:

f(x) = 5 ÷ (x - 2)

We cannot allow:

x - 2 = 0

Therefore:

x ≠ 2

So:

Domain = all real numbers except 2


Worked Example: Rational Function

Find the domain of:

f(x) = 3 ÷ (x + 4)

The denominator cannot equal zero.

Set:

x + 4 = 0

Therefore:

x = -4

So:

Domain: x ≠ -4

Every other real value of x is allowed.


Two Common Domain Restrictions

When finding domain from an equation, two especially important restrictions are:

Division

You cannot divide by:

zero.

Even Square Roots

You cannot take the square root of a negative number when working with:

real numbers.

These restrictions allow us to determine the domain of many functions.


Domain Does Not Always Mean All Mathematically Possible Values

Real-world situations can create additional:

restrictions.

Suppose:

C = 5n + 20

represents the cost of renting bicycles, where n is the number of bicycles rented.

Mathematically, we could substitute:

n = -10.

But what would:

-10 bicycles

mean?

It makes no sense in this context.

Therefore, the real-world domain is more restricted than the equation alone might suggest.


Domain in Context

Suppose:

C = 5n + 20

where n represents the number of bicycles.

Reasonable values might be:

n = 0, 1, 2, 3, 4, ...

The domain consists of:

non-negative whole numbers.

Why not 2.7?

Because we cannot normally rent:

2.7 bicycles.

Context determines which mathematical values are:

meaningful.


Range in Context

Using:

C = 5n + 20

if:

n = 0

then:

C = 20

If:

n = 1

then:

C = 25

If:

n = 2

then:

C = 30

So possible outputs include:

20, 25, 30, 35, ...

These values form the:

range.


Discrete and Continuous Domains

A domain can be:

discrete

or:

continuous.

A discrete domain contains separate values.

Example:

number of students

Possible values:

0, 1, 2, 3, ...

You cannot normally have:

14.6 students.


Continuous Domains

A continuous domain can contain any value within an:

interval.

Examples include:

  • time
  • temperature
  • distance
  • mass
  • height

If time can vary from 0 to 10 seconds, then values such as:

2 s

2.5 s

2.537 s

may all be possible.

This creates a:

continuous domain.

https://images.openai.com/static-rsc-4/JZno3Oc2m4XQkKon-HIZY4EY19nfCoaFsiJC5kw4qK2t_2RHwcqMe0ErYn749JnBpQ2YZdTjtRwAjLaLHvYnEESUQZBvpRyqxUk7jYeMZUtnnwshGMT0JtLJ0dvKbWnUp-9QGhMn8EX178eesL6LhzJXZP2tHIK-PwQOWf7NlEbW1VS-YJULP1UzPXtHHOdc?purpose=fullsize
 
https://images.openai.com/static-rsc-4/E_3EiJeJMDMiJ1ZIQfVYwikwI7FQW4GW55qyiGuKKVaQhkvpXLwfHUvlgGP01jsl3qKwPTt3P2On0gp3TT3QhEjMFU0dPnC_rBAxnhJsntTqQoL8BRt9mfVE40FS_s7JUnCmDDpTGdU-PhqjG4mSfn7sQSViP9JkV-Cp119Kw4s_QhnW9x99-zepVt-gpTKk?purpose=fullsize
 
https://images.openai.com/static-rsc-4/uinG1y_SPyXrVU_3rADiD4UxJOfbarn4NcPbwphd21Q4_Hs2bb_lLBbFhjwh6sg7Iuus6485qqWt8VRWcbVvbPae5c8ucK5z9APnbBG2ilWME1U2MIhyFoKc7w9KgXP9WeRv052klYfwZpMl6JBEAGTp0CKMU8guZ9bdEONb2IKFMQLsdLn7Cs7mF1FCrN8R?purpose=fullsize
 
5

Worked Example: A Thrown Ball

Suppose the height of a ball is modeled by:

h = -5t² + 20t + 1

where:

t = time in seconds

and:

h = height in metres.

Mathematically, the quadratic equation accepts negative values of t.

But:

negative time before the ball was thrown

may not belong to the situation being modeled.

If the model begins when the ball is thrown, then:

t ≥ 0

until the ball reaches the ground.

The physical situation determines the meaningful:

domain.


Domain and Range Have Meaning

Domain and range are not simply mathematical rules.

They answer two useful questions:

Domain

What inputs make sense or are allowed?

Range

What outputs are possible?

This becomes especially important when functions represent:

real situations.


Example: Movie Tickets

Suppose:

C = 12n

where:

n = number of tickets

and:

C = total cost in dollars.

If a cinema allows one person to purchase at most 8 tickets, then:

Domain = {0, 1, 2, 3, 4, 5, 6, 7, 8}

The corresponding range is:

Range = {0, 12, 24, 36, 48, 60, 72, 84, 96}

The context creates both:

restrictions and meaning.


Example: Filling a Tank

Suppose a tank begins empty and fills at:

5 litres per minute

for 20 minutes.

Let:

V = 5t

where:

t = time in minutes

and:

V = volume of water in litres.

The meaningful domain is:

0 ≤ t ≤ 20

The corresponding range is:

0 ≤ V ≤ 100

Because time and volume can vary continuously, these intervals contain:

all values between the endpoints.


Domain from a Graph

When examining a graph, start at its:

leftmost point.

Then move toward the:

rightmost point.

Ask:

Which x-values does the graph contain?

Those values form the:

domain.

If arrows show that the graph continues forever, the domain may extend toward:

infinity.


Range from a Graph

Now examine the graph from:

bottom to top.

Ask:

Which y-values does the graph contain?

Those values form the:

range.

Look carefully for:

  • highest points
  • lowest points
  • open endpoints
  • closed endpoints
  • arrows
  • gaps

These features determine whether particular values are:

included.


Worked Example: Reading Endpoints

Suppose a graph begins with a closed point at:

(-4, -2)

and ends with an open point at:

(6, 5).

Assume the graph covers all x-values and y-values between these endpoints.

For the domain:

-4 is included

6 is not included

Therefore:

Domain: -4 ≤ x < 6

For the range:

-2 is included

5 is not included

Therefore:

Range: -2 ≤ y < 5


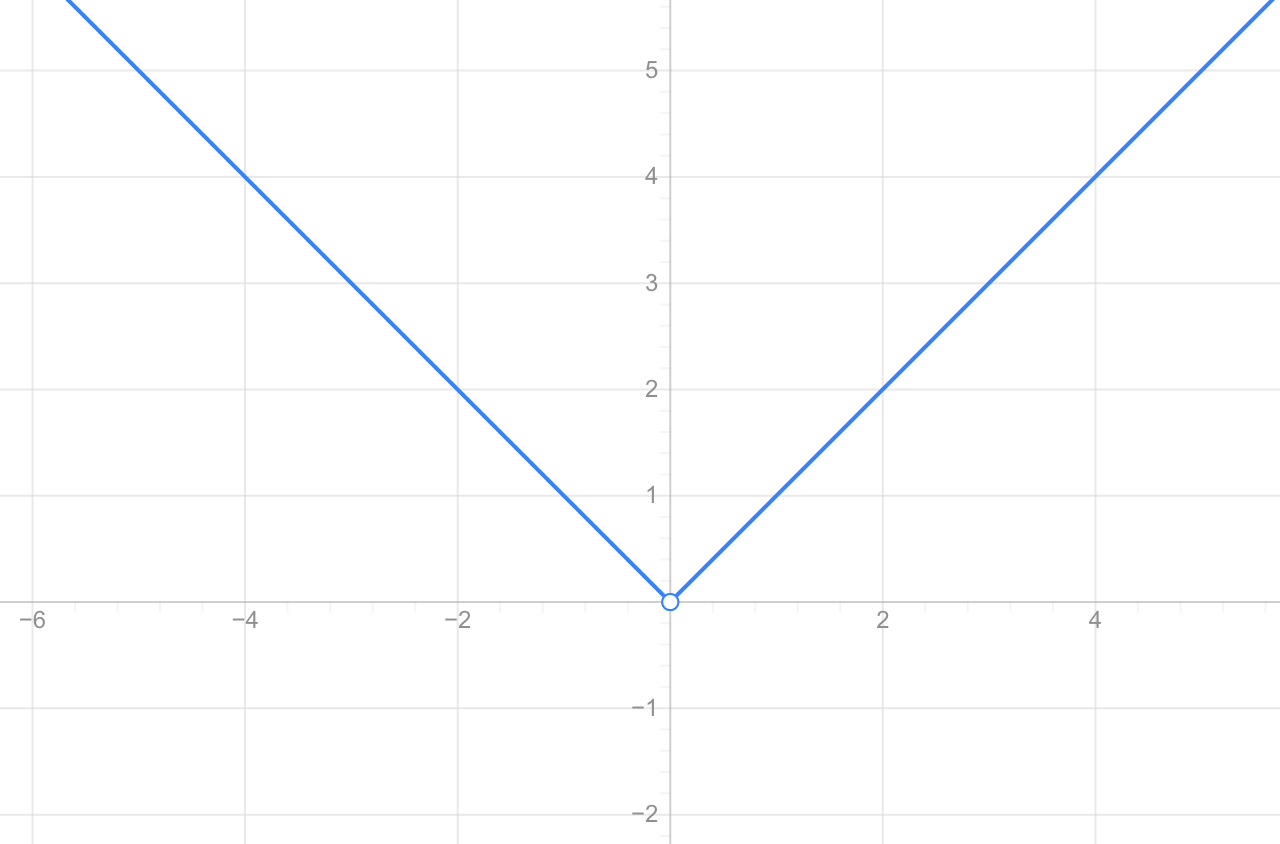
Domain and Range of Absolute Value

Consider:

f(x) = |x|

Any real number can be substituted for:

x.

Therefore:

Domain = all real numbers

Absolute value cannot produce a negative output.

Therefore:

Range: y ≥ 0

The graph extends left and right forever but has a minimum value at:

y = 0.


Comparing Common Functions

Function Domain Range
y = x All real numbers All real numbers
y = x² All real numbers y ≥ 0
y = x² + 3 All real numbers y ≥ 3
y = √x x ≥ 0 y ≥ 0
y = |x| All real numbers y ≥ 0
y = 1 ÷ x x ≠ 0 y ≠ 0

Recognizing these common patterns makes domain and range much easier to:

determine.


A Useful Domain Checklist

When given an equation, ask:

Is there a denominator?

If yes:

What values make the denominator zero?

Exclude those values.

Is there an even square root?

If yes:

What values make the expression inside the root negative?

Exclude those values.

Is there a real-world context?

If yes:

Which values actually make sense?

Apply those restrictions.

Are there no restrictions?

Then the domain may be:

all real numbers.


A Useful Range Checklist

Finding range from an equation can sometimes be more difficult.

Ask:

Does the function have a minimum?

Example:

y = x²

Minimum:

y = 0

So:

y ≥ 0

Does the function have a maximum?

A downward-opening parabola may have a:

maximum output.

Are some y-values impossible?

Example:

y = 1 ÷ x

The output can never equal:

0.

Does the context restrict outputs?

Example:

A height cannot reasonably be:

negative.


Domain and Range from Real Data

Suppose a table records the temperature of water during an experiment.

Time (min) Temperature (°C)
0 20
2 29
4 38
6 47
8 56
10 65

The recorded domain is:

{0, 2, 4, 6, 8, 10}

The recorded range is:

{20, 29, 38, 47, 56, 65}

But if the function models temperature continuously throughout the experiment, the meaningful domain may instead be:

0 ≤ t ≤ 10

This illustrates an important distinction between:

recorded data points and the underlying situation.


Common Mistake: Switching Domain and Range

A common mistake is to reverse:

domain and range.

Remember:

Domain = x = input

Range = y = output

On a graph:

Domain → horizontal

Range → vertical


Common Mistake: Listing Repeated Values

Suppose the outputs are:

3, 5, 5, 7, 7, 7

When writing the range as a set:

Range = {3, 5, 7}

Each possible output only needs to be listed:

once.


Common Mistake: Ignoring Restrictions

Consider:

f(x) = 4 ÷ (x - 6)

It would be incorrect to say:

Domain = all real numbers

because:

x = 6

would make the denominator:

zero.

The correct domain is:

x ≠ 6.


Common Mistake: Ignoring Context

Suppose:

P = 8n

represents the price of n notebooks.

A purely algebraic interpretation might allow:

n = -4

or:

n = 2.7.

But neither represents a sensible number of notebooks.

The mathematical model must be interpreted within:

its context.


Why Domain and Range Matter

Domain and range help us understand the:

limits of a mathematical model.

They tell us:

  • which inputs are possible
  • which outputs are possible
  • where a graph exists
  • where an equation is defined
  • which values make sense in context

Without domain and range, we may apply a function to values for which it was never:

intended.


Domain and Range in Science

Suppose a scientist models the growth of a plant during a:

30-day experiment.

The time domain might be:

0 ≤ t ≤ 30

Even if the mathematical equation could accept:

t = 1,000,

the model may not be valid that far into the:

future.

Mathematical models have:

limits.


Domain and Range in Business

Suppose a company can manufacture at most:

5,000 products per month.

If x represents the number of products manufactured, then the meaningful domain might be:

0 ≤ x ≤ 5000

If only whole products can be manufactured, x would also need to be:

a whole number.

Domain restrictions can therefore represent:

real limitations.


Domain and Range in Geometry

Suppose the perimeter of a square is:

P = 4s

where:

s = side length.

Mathematically, the equation works for negative s-values.

But a physical side length cannot be:

negative.

Therefore:

s > 0

for an actual square.

The corresponding perimeter must also satisfy:

P > 0.


The DR Method

A simple strategy is the:

DR Method.

D — Domain

Ask:

What x-values or inputs are possible?

Look:

left to right.

R — Range

Ask:

What y-values or outputs are possible?

Look:

bottom to top.

Then check:

Are there mathematical or real-world restrictions?


Check Your Understanding

1. Define domain.

2. Define range.

3. Which variable usually represents the domain?

4. Which variable usually represents the range?

5. Find the domain of the table:

x y
-3 2
0 5
4 8
7 11

6. Find the range of the same table.

7. Find the domain of:

(-2, 5), (1, 7), (4, 5), (8, 10)

8. Find the range of the ordered pairs above.

9. Why do repeated output values only need to be listed once in the range?

10. What is the domain of:

f(x) = 5x - 3

11. What is the range of:

f(x) = x²

12. Find the domain of:

f(x) = √x

13. Find the domain of:

f(x) = √(x - 7)

14. Find the domain of:

f(x) = 1 ÷ x

15. Find the domain of:

f(x) = 4 ÷ (x + 3)

16. Explain why division by zero creates a domain restriction.

17. Explain why an even square root can create a domain restriction.

18. A line segment extends from x = -5 to x = 8 with both endpoints included. State its domain.

19. A graph extends from y = 2 upward forever. State its range.

20. Explain the difference between a discrete and continuous domain.

21. A concert venue sells at most 500 tickets. If n represents tickets sold, describe a sensible domain for n.

22. A tank fills for 15 minutes. If t represents time since filling began, describe the domain.

23. Explain why the domain of a mathematical equation may differ from the meaningful domain of a real-world model.

24. What does an open point on a graph tell you about domain or range?

25. Explain how you can determine domain and range visually from a graph.


Key Terms

  • Function: Relationship in which each allowed input has exactly one output.
  • Domain: Set of all possible input values of a function.
  • Range: Set of all possible output values of a function.
  • Input: Value entered into a function.
  • Output: Value produced by a function.
  • Independent variable: Variable whose value is used as the input.
  • Dependent variable: Variable whose value depends on the input.
  • Ordered pair: Pair of coordinates written as (x, y).
  • Mapping diagram: Diagram showing connections between inputs and outputs.
  • Restriction: Condition preventing certain values from belonging to a domain or range.
  • Real numbers: Numbers represented on the ordinary number line.
  • Discrete: Consisting of separate individual values.
  • Continuous: Containing all possible values throughout an interval.
  • Endpoint: Value marking the beginning or end of an interval.
  • Closed point: Endpoint that is included.
  • Open point: Endpoint that is excluded.
  • Inequality notation: Method of describing a set of values using symbols such as <, >, ≤, and ≥.
  • Interval notation: Method of describing continuous sets of numbers using brackets and parentheses.
  • Undefined: Mathematical expression that has no permitted value under the given number system or operation.
  • Mathematical model: Function or equation used to represent a real-world situation.

Key Takeaways

  • The domain is the set of possible inputs of a function.
  • The range is the set of possible outputs.
  • Domain usually corresponds to x-values.
  • Range usually corresponds to y-values.
  • From a table, domain comes from the x-column and range comes from the y-column.
  • From ordered pairs, domain comes from the first coordinates and range from the second coordinates.
  • Repeated values only need to appear once when writing a set.
  • On a graph, read domain from left to right.
  • On a graph, read range from bottom to top.
  • Closed endpoints are included.
  • Open endpoints are excluded.
  • Linear functions such as y = 2x + 3 usually have all real numbers as both their domain and range.
  • The function y = x² has all real numbers as its domain but y ≥ 0 as its range.
  • The function y = √x has x ≥ 0 as its real-number domain.
  • A denominator can never equal zero.
  • Therefore, rational functions may have excluded domain values.
  • Even square roots cannot contain negative values when working with real numbers.
  • Real-world contexts can create additional domain restrictions.
  • Counts such as numbers of people or objects usually have discrete domains.
  • Measurements such as time, distance, and temperature can have continuous domains.
  • The mathematical domain of an equation and the meaningful domain of a model are not always the same.
  • Domain asks: What inputs are allowed?
  • Range asks: What outputs are possible?
  • Understanding domain and range helps us determine both the mathematical and practical limits of a function.


3. Function Notation

Learning outcomes
  • I can interpret function notation.
  • I can evaluate functions using function notation.
  • I can distinguish between variables and function notation.
  • I can write functions using standard notation.
  • I can explain the advantages of function notation.

https://images.openai.com/static-rsc-4/7ol-vmd4p65Vo5dpJQ5jo-M7b9TnpTYi8vpQxY5pUPtz-vfNGKVPBxseS7ald1gdGUHwIi8AJBAbYBmaGJ-358WgZiEfxZyBzNY5i3KtaJmLxP7uJ_dlioi9Q9EhgfVOS2AUjyEzwQ5IW-lAc6UbxCMq4M1zNF4SydNchKo-sWjvEWVw1E5xfKSLHWqzu968?purpose=fullsize
 
https://images.openai.com/static-rsc-4/-HbRQFtUz57OaAfX3v7aJoMNRECIQKlQ3HWlhXVF_GjU_T_ng1XKXKqZM5PYBNARgejFn3S3sTsdvxX__2iWDoBWKZO7crRkr0obUxOTBRcPjCVbqFXzQ4kg-CzzXQRO5ZH6xFWH8e-JRxzNZycMj6gJd6J29hmOOuuzfZg5LPN_6UGMHp2ZLy14_cnozv7D?purpose=fullsize
 
https://images.openai.com/static-rsc-4/JvD4xRJf_9Ds9i075_mkdDsCbmf_DPsf9KV9cdS7QuKURSDWVvPrb8gFE-efY8nGlY95xZWS6HBB-0VgcbAYxaChEV6SqAKNZQadDu7hMAklLNofYp4o_BFg2omzvbAemQNCqHvbAdz-fTLTic1B6SEGoButpGd1Njfge0DX11Grp4jIVkX380ATR2_NpQNx?purpose=fullsize
 
6

What Is Function Notation?

A function describes a relationship between an:

input

and an:

output.

You may already be familiar with equations such as:

y = 2x + 3

Function notation gives us another way to write the same relationship:

f(x) = 2x + 3

These two equations can describe the same function.

However, function notation gives us a clearer way to identify and work with:

specific functions and their inputs.


Understanding f(x)

The expression:

f(x)

is read as:

"f of x".

It does not mean:

f × x.

The letter f is the:

name of the function.

The value inside the parentheses is the:

input.

So:

f(x)

means:

the output of function f when the input is x.


Function Notation as a Machine

One useful way to think about a function is as a:

machine.

An input enters the machine.

The function performs a rule.

An output comes out.

For example:

f(x) = 2x + 3

If the input is:

4

then:

f(4) = 2(4) + 3

f(4) = 8 + 3

f(4) = 11

So the function takes:

4 → 11

https://images.openai.com/static-rsc-4/slJmBFJ9T6xPiZEDAaZLcr7Iae8fzz0sabV0mJcAZrRyktSIpNs2laPhH2-HWcX2_krjk6KvbwbooDJw3vu6hj2jZxylIyqb0-xIph_k75ko99ccZU7bXCIV-JXIqzgjYc-tOERLVrqhP59GHbRZ95plUU91OjYqpprG86aqR4F9NM1EDv9sxEN0FwHXhekX?purpose=fullsize
 
https://images.openai.com/static-rsc-4/TchFi7MNSXGxfOD3sboYUkca0bVpN0Bf4i0NzVDdvcQjhy83adOoNzPw6kirpS4l6ouksVKm_6z9fY3ayp8hILBJI2_SrX40CHemO42RQ22st57YVrm1qIFCPdHWP-YK717IPURHQ9RvmQCjOggU9-Hu2wInkLjTMPsIjFxgeyb7aUFAUeLUbVuCZUt21yXx?purpose=fullsize
 
https://images.openai.com/static-rsc-4/n59Laoh52sXrbfZ5kUku_N78z7_QDwOacE6F2RK50OsHQXkm_rj4tiqGlpbYy8TBXfviZDFcYOhuLFiYQ0oL7rzsXVL7sH1eYGpVsi-dajvXOmAOslGRq5-f_SUs7oy06k1xCCJf_L8sApTeE9Tp6ZgQG1FRk5bNfK66bhB6yxuIT13SUhKYB3u8zmWY2X0W?purpose=fullsize
 
4

The Parts of Function Notation

Consider:

f(x) = 3x - 5

There are several important parts.

f = name of the function

x = input variable

3x - 5 = function rule

f(x) = output produced by the function

The equation tells us:

Take the input, multiply it by 3, then subtract 5.


Function Names

Functions are often named using letters such as:

f, g, h, p, or C.

For example:

f(x) = 2x + 1

g(x) = x²

h(x) = √x

The letters simply allow us to:

identify different functions.


Why Do We Need Function Names?

Suppose we have two relationships:

y = 2x + 1

and:

y = x²

Writing both using y can become confusing.

Instead, we can write:

f(x) = 2x + 1

and:

g(x) = x²

Now we can clearly refer to:

function f

and:

function g.

This is one major advantage of:

function notation.


Evaluating a Function

To evaluate a function means to find its output for a particular:

input.

Suppose:

f(x) = 2x + 5

Find:

f(3)

The notation f(3) means:

use 3 as the input.

Replace every x with:

3.

Therefore:

f(3) = 2(3) + 5

f(3) = 6 + 5

f(3) = 11

So:

f(3) = 11


The Substitution Method

When evaluating a function, use these steps:

Step 1: Identify the input.

Step 2: Substitute the input for every x in the function.

Step 3: Calculate carefully.

Step 4: Write the answer using function notation.

For example:

f(x) = 4x - 7

Find:

f(5)

Substitute:

f(5) = 4(5) - 7

Calculate:

f(5) = 20 - 7

Therefore:

f(5) = 13


Evaluating at Zero

Suppose:

f(x) = 3x + 8

Find:

f(0)

Substitute 0 for x:

f(0) = 3(0) + 8

f(0) = 8

Therefore:

f(0) = 8

Notice that f(0) does not mean the answer must be:

zero.

It means:

find the output when the input is zero.


Evaluating Negative Inputs

Suppose:

f(x) = 2x + 7

Find:

f(-3)

Substitute:

f(-3) = 2(-3) + 7

f(-3) = -6 + 7

Therefore:

f(-3) = 1

Negative inputs are handled in exactly the same way as:

positive inputs.


Be Careful with Negative Numbers

Suppose:

f(x) = x² + 2

Find:

f(-4).

Substitute:

f(-4) = (-4)² + 2

f(-4) = 16 + 2

f(-4) = 18

The parentheses are important.

(-4)² = 16

This is why it is a good habit to place substituted values inside:

parentheses.


Evaluating Quadratic Functions

Consider:

f(x) = x² - 3x + 2

Find:

f(4).

Substitute 4 for every x:

f(4) = (4)² - 3(4) + 2

f(4) = 16 - 12 + 2

Therefore:

f(4) = 6

Every occurrence of x must be:

replaced.


Evaluating a Fraction

Suppose:

f(x) = (x + 4) / 2

Find:

f(6).

Substitute:

f(6) = (6 + 4) / 2

f(6) = 10 / 2

Therefore:

f(6) = 5


Evaluating a Square Root Function

Suppose:

f(x) = √(x + 1)

Find:

f(8).

Substitute:

f(8) = √(8 + 1)

f(8) = √9

Therefore:

f(8) = 3


Function Notation and Tables

Function notation can also describe information in a:

table.

Consider:

x f(x)
-2 1
-1 3
0 5
1 7
2 9

From the table:

f(-2) = 1

f(0) = 5

f(2) = 9

The x-column contains the:

inputs.

The f(x)-column contains the:

outputs.


Reading Function Notation from a Table

Using the same table:

x f(x)
-2 1
-1 3
0 5
1 7
2 9

What is:

f(1)?

Find:

x = 1

Then read the corresponding output.

Therefore:

f(1) = 7


Function Notation and Graphs

A graph of:

y = f(x)

shows the outputs of a function for different:

x-values.

Suppose a graph contains the point:

(3, 7).

This means:

when x = 3, the output is 7.

Using function notation:

f(3) = 7

So the coordinate:

(3, 7)

can be interpreted as:

input 3 → output 7.

https://images.openai.com/static-rsc-4/qj50xw4iCC5mRWtV2lg4iAOWSxicYv6uBoimwMSQ6peEVN2aQ-g9T2gfMI9-_dbtPTYnfwuvt9aUM60PZ93vgep6kPPtLD6VhbPrG9STS-O3WRAZUMHEZmrWKzXkrVetO3LZASurprout5KEi-ovIjrmhp02cTG9nJ5AGFJ9ygUBB5PuJ5agpQcpc5rnxNRX?purpose=fullsize
 
https://images.openai.com/static-rsc-4/jSByijKNaQCSHBMQPwFN6f5aj3caAIyM4Nm5vxUsltCSYF9YbRtFXqQgF12FBNI5MKZji8ItwQJn9YHfGg_dy-NBkMI9LE-vADk5nczuja_Jrsh81pZq-3SmqJI4Pyvey9o2q7lonmhInqs6Ag1vB9shUiWtiSyTIS0tTZuWaeJlrS-f4yQkoKtlt0F-bsEi?purpose=fullsize
 
https://images.openai.com/static-rsc-4/FOV9E2TLaRr3RsH8BV4cjibDA5ZcGdTcU1Kq5qXdRwdtDKP_kMCemJulzDFScWG6PC27QdFuD-nGKfq6dV7NnmkVOAYrShZshxVUU47pb99AxyzcBP6COrFM90wfYlB_vjShBX1JBw40LrKHxUBK1ubOJq_8OWbqaalzyObqrznhOqeJk76yz8G0scq33ZmK?purpose=fullsize
 
4

Connecting Coordinates and Function Notation

If:

f(2) = 5

then the graph of f contains the point:

(2, 5).

If:

f(-3) = 4

then the graph contains:

(-3, 4).

If:

f(0) = -2

then the graph contains:

(0, -2).

This connection is extremely useful:

f(a) = b ↔ (a, b)


Writing Equations in Function Notation

Suppose:

y = 5x - 2

To write this using function notation, replace y with:

f(x).

Therefore:

f(x) = 5x - 2

The mathematical relationship has not changed.

We have simply given the function:

a name.


Another Example

Rewrite:

y = x² + 4x - 1

using function notation.

Replace y with f(x):

f(x) = x² + 4x - 1

Now the function can easily be referred to as:

function f.


Different Function Names

There is nothing special about the letter:

f.

We could write:

g(x) = 2x + 7

or:

h(x) = x² - 3

or:

p(x) = 4x

The function name can often be chosen to make the situation easier to:

understand.


Meaningful Function Names

In real-world applications, letters may represent:

quantities.

For example:

CNein = 12n

could represent the cost C of buying n tickets at $12 each.

Then:

C(5)

means:

the cost of buying 5 tickets.

Calculate:

C(5) = 12(5)

C(5) = 60

So:

5 tickets cost $60.


Function Notation in Context

Suppose:

THerz = 20 - 2h

represents the temperature T after h hours.

What does:

T(3)

mean?

It means:

the temperature after 3 hours.

Calculate:

T(3) = 20 - 2(3)

T(3) = 14

Therefore:

the temperature after 3 hours is 14 degrees.

Function notation helps communicate the:

meaning of the variables.


Input and Output

Consider:

P(t) = 100 + 20t

Here:

t

is the input.

P(t)

is the output.

If P represents a population and t represents time, then:

P(5)

means:

the population at time 5.

This is more informative than simply writing:

y.


Function Notation Is Not Multiplication

This is one of the most important ideas in this topic.

f(x)

does not mean:

f × x.

The parentheses indicate the:

input to the function.

Compare:

3(x)

which means multiplication,

with:

f(x)

which means the output of function f for input x.

The notation may look similar, but the meanings are:

different.


The Value Inside the Parentheses

The value inside the parentheses tells us:

what to substitute for the input variable.

If:

f(x) = x² + 1

then:

f(3) means substitute 3.

f(-2) means substitute -2.

f(10) means substitute 10.

But the input does not have to be:

a number.


Evaluating with Another Variable

Suppose:

f(x) = 2x + 5

Find:

f(a).

Replace x with a:

f(a) = 2a + 5

Nothing else can be simplified because a is:

unknown.


Evaluating an Expression

Suppose:

f(x) = 3x - 2

Find:

f(n + 1).

Replace every x with:

n + 1.

Therefore:

f(n + 1) = 3(n + 1) - 2

Expand:

f(n + 1) = 3n + 3 - 2

Therefore:

f(n + 1) = 3n + 1

This shows that function inputs can be:

expressions as well as numbers.


Another Expression Example

Suppose:

f(x) = x² + 4

Find:

f(2a).

Substitute:

f(2a) = (2a)² + 4

Therefore:

f(2a) = 4a² + 4

Again, the entire input replaces:

x.


Comparing f(x) and f(2)

Suppose:

f(x) = 3x + 1

Then:

f(x)

describes the general output for any allowed:

x-value.

But:

f(2)

asks for one specific output.

Calculate:

f(2) = 3(2) + 1

f(2) = 7

So:

f(x) is a general expression.

f(2) is a specific value.


Comparing x and f(x)

The symbols:

x

and:

f(x)

do not represent the same thing.

x represents:

the input.

f(x) represents:

the output produced from that input.

For:

f(x) = 2x + 3

if:

x = 4

then:

f(x) = 11.

Input:

4

Output:

11.


More Than One Function

Suppose:

f(x) = 2x + 1

and:

g(x) = x²

Find:

f(3).

f(3) = 2(3) + 1 = 7

Now find:

g(3).

g(3) = 3² = 9

The same input can produce different outputs because:

the functions have different rules.


Why Function Names Are Useful

Suppose we want to compare:

f(x) = 2x + 1

g(x) = x²

h(x) = 10 - x

Function notation allows us to discuss all three relationships:

at the same time.

We can ask:

f(4)

g(4)

h(4)

without confusing which rule should be:

used.


Functions Can Be Compared

Using:

f(x) = 2x + 1

and:

g(x) = x²

at x = 3:

f(3) = 7

g(3) = 9

Therefore:

g(3) > f(3).

Function notation makes comparisons between functions:

clear and concise.


Finding the Input from an Output

Sometimes we know the output and must determine:

the input.

Suppose:

f(x) = 3x + 2

and:

f(x) = 17.

This means:

3x + 2 = 17

Subtract 2:

3x = 15

Divide by 3:

x = 5

Therefore:

f(5) = 17.


Another Reverse Example

Suppose:

g(x) = 2x - 6

Find x if:

g(x) = 10.

Write:

2x - 6 = 10

Add 6:

2x = 16

Divide by 2:

x = 8

Therefore:

g(8) = 10.


Function Notation and Domain

Function notation also connects naturally with:

domain and range.

The values that may be placed inside the parentheses belong to the:

domain.

The resulting values of the function belong to the:

range.

For example:

f(3) = 11

means:

3 is an input

and:

11 is the corresponding output.


Restricted Inputs

Consider:

f(x) = 1 / x

The expression:

f(0)

would mean:

1 / 0

which is undefined.

Therefore:

f(0) is undefined.

This occurs because 0 is not part of the:

domain.

Function notation does not remove the restrictions of a:

function.


Function Notation and Graphs

Consider:

f(x) = x²

The graph represents every pair:

(x, f(x)).

For example:

f(-2) = 4

f(-1) = 1

f(0) = 0

f(1) = 1

f(2) = 4

These correspond to the points:

(-2, 4)

(-1, 1)

(0, 0)

(1, 1)

(2, 4)

Together, these points form the familiar:

parabola.

https://images.openai.com/static-rsc-4/qjBotcHoIEK9aFlrFgGs3LRnSpMyS1D1ynGlcsjP3xb8F196Ew5PfhkyzXgrAdl4s8ZXbARio3-QOLvKnvx_KipyWB8Amz9cYflQvfVh2joZk9ZDTYzTBLwNbP_UdeAkJNRLg5V2uSzmrvfGlIDiJ9om8L8_isYsYKfpUOhFH3hHgaOjkBZR9sQHBwEO4JGP?purpose=fullsize
 
https://images.openai.com/static-rsc-4/EucNYuKMgSO7EX05DOfYukF3j9dwBFLWt7ilsE1dUwSFnBSd1FHn2yEOz59KmDJ6siOHnPdBl8gnC8RL--5uJEdrZflibPkoaUk70jTR76nJyuWLki0Pf_Ab7GA69BhgLtO8d-gXjBc94llVYoJ3ZbgKsz9MHrmmnUJuflrVIpAH5XywWj1frHLlmR67Qppq?purpose=fullsize
 
https://images.openai.com/static-rsc-4/ytvzPtiYXA_jivx-tBZ-aj1MUIDjlAltCvE_jj8w8F17Q9tVddFdcwv9VsFTV591Oi0xqqbgPJ4xcWgnPbrXn0meDz7oTrTwjt8fPk3TQexqorQJCjiU-VopKCpj--E3lVODP48ErNhVtBvlH5hyqmWmQ8yRuLYNojlqDBULMZmIwmXpeJ17DofJbgJ7Tf-v?purpose=fullsize
 
6

Worked Example 1

Given:

f(x) = 5x - 4

find:

f(6).

Substitute:

f(6) = 5(6) - 4

f(6) = 30 - 4

Therefore:

f(6) = 26


Worked Example 2

Given:

g(x) = x² + 3x

find:

g(-2).

Substitute:

g(-2) = (-2)² + 3(-2)

g(-2) = 4 - 6

Therefore:

g(-2) = -2


Worked Example 3

Given:

h(x) = 4 - 2x

find:

h(0).

Substitute:

h(0) = 4 - 2(0)

Therefore:

h(0) = 4


Worked Example 4

Given:

p(x) = x² - 5

find:

p(a).

Replace x with a:

p(a) = a² - 5


Worked Example 5

Given:

f(x) = 2x + 3

find:

f(x + 1).

Replace every x in the rule with:

x + 1.

Therefore:

f(x + 1) = 2(x + 1) + 3

Expand:

f(x + 1) = 2x + 2 + 3

Therefore:

f(x + 1) = 2x + 5


Function Notation from a Word Rule

Suppose a function:

multiplies an input by 4 and then subtracts 3.

We can write:

f(x) = 4x - 3

This converts a verbal rule into:

standard function notation.


Another Word Rule

Suppose a function:

squares the input and then adds 7.

We can write:

g(x) = x² + 7

The name g simply identifies:

this particular function.


From a Table to Function Notation

Consider:

x Output
0 3
1 5
2 7
3 9
4 11

The outputs increase by:

2

for every increase of 1 in x.

The function rule is:

f(x) = 2x + 3

We can verify:

f(0) = 3

f(1) = 5

f(2) = 7

and so on.


Function Notation in Real Life

Function notation is useful whenever one quantity depends on:

another quantity.

For example:

CNein = cost of n items

d(t) = distance travelled after time t

T(t) = temperature at time t

P(t) = population at time t

A(r) = area of a circle with radius r

The notation communicates both:

the quantity being calculated and the variable it depends on.


Example: Area of a Circle

The area of a circle depends on its:

radius.

Instead of simply writing:

A = πr²

we can write:

A(r) = πr²

This emphasizes that area is a:

function of radius.

For a radius of 5:

A(5) = π(5)²

A(5) = 25π

So A(5) means:

the area of a circle with radius 5.


Example: Distance Travelled

Suppose a vehicle travels at a constant speed of:

60 km/h.

Its distance after t hours can be written:

d(t) = 60t

Then:

d(2) = 120

means:

the distance travelled after 2 hours is 120 km.

The notation tells us exactly what the:

input and output represent.


Why Function Notation Is Better Than Always Using y

Writing:

y = 60x

tells us the mathematical relationship.

But:

d(t) = 60t

provides additional meaning.

It tells us:

d represents distance

and:

t represents time.

Function notation can therefore make mathematical models:

more informative.


Advantages of Function Notation

Function notation provides several important advantages.

It:

  • clearly identifies the function
  • clearly identifies the input
  • makes evaluating functions easy to express
  • allows several functions to be discussed at once
  • connects equations, tables, and graphs
  • makes real-world models easier to interpret
  • allows functions to be combined and compared
  • provides a standard language used throughout higher mathematics

Function notation becomes increasingly important in:

algebra, calculus, statistics, science, economics, and engineering.


Common Mistake: Treating f(x) as Multiplication

Incorrect idea:

f(x) = f × x

Correct idea:

f(x) means the output of function f for input x.

Always read:

f(x)

as:

"f of x".


Common Mistake: Forgetting to Substitute Every x

Suppose:

f(x) = x² + 3x - 1

and we want:

f(2).

Incorrect:

2² + 3x - 1

The x in 3x was not replaced.

Correct:

f(2) = (2)² + 3(2) - 1

f(2) = 4 + 6 - 1

f(2) = 9

Every x must be:

replaced by the input.


Common Mistake: Losing Parentheses

Suppose:

f(x) = x² - 4x

and we want:

f(-3).

Write:

f(-3) = (-3)² - 4(-3)

not:

-3² - 4 × -3

Using parentheses helps prevent:

sign errors.


Common Mistake: Confusing Input and Output

If:

f(4) = 11

then:

4 is the input

and:

11 is the output.

It does not mean that:

f = 4

or that:

x = 11.


Common Mistake: Thinking f Is Always the Function Name

The function does not have to be called:

f.

For example:

g(x) = 3x

h(t) = t²

CNein = 5n + 10

are all valid examples of:

function notation.


A Useful Function Notation Strategy

When you see something such as:

f(7)

think:

"Put 7 into function f."

Then:

  1. Find the rule for f.
  2. Replace every input variable with 7.
  3. Calculate the result.
  4. Write the output.

For example:

f(x) = 3x² - 2

Find:

f(2).

Substitute:

f(2) = 3(2)² - 2

f(2) = 12 - 2

f(2) = 10


Check Your Understanding

1. What does f(x) mean?

2. How do you read f(x) aloud?

3. Does f(x) mean f multiplied by x? Explain.

4. In f(x) = 3x + 2, what is the input variable?

5. In f(x) = 3x + 2, what does f represent?

6. If f(x) = 2x + 5, find f(4).

7. If f(x) = 7x - 3, find f(0).

8. If f(x) = 4x + 1, find f(-2).

9. If g(x) = x² + 2, find g(3).

10. If g(x) = x² - 5x, find g(-2).

11. If h(x) = √(x + 4), find h(5).

12. Rewrite y = 6x - 7 using function notation.

13. Rewrite y = x² + 4x + 1 using function notation.

14. If f(3) = 8, what point lies on the graph of f?

15. If the point (-2, 7) lies on the graph of g, write this using function notation.

16. Given f(x) = 5x + 1, find f(a).

17. Given f(x) = 2x - 3, find f(n + 1).

18. Given g(x) = x² + 4, find g(2a).

19. If f(x) = 3x + 2 and f(x) = 20, find x.

20. If g(x) = 5x - 4 and g(x) = 31, find x.

21. Explain the difference between x and f(x).

22. Explain the difference between f(x) and f(5).

23. Give one advantage of naming functions f, g, and h instead of writing every function using y.

24. Write a function that doubles an input and then adds 7.

25. A taxi charges a starting fee of $4 plus $3 per kilometre. Write the total cost C as a function of distance d.


Key Terms

  • Function: Relationship that assigns each allowed input exactly one output.
  • Function notation: A system for representing functions using expressions such as f(x).
  • f(x): Output of function f for the input x.
  • Function name: Symbol used to identify a function, such as f, g, or h.
  • Input: Value supplied to a function.
  • Output: Value produced by a function.
  • Variable: Symbol representing a value that can change.
  • Independent variable: Variable used as the input.
  • Dependent variable: Variable whose value depends on the input.
  • Evaluate: Calculate the output of a function for a given input.
  • Substitute: Replace a variable with a specified value or expression.
  • Function rule: Mathematical operation or expression connecting inputs to outputs.
  • Ordered pair: Pair of values written as (x, y).
  • Domain: Set of allowed inputs.
  • Range: Set of possible outputs.
  • Mathematical model: Function used to represent a real-world relationship.

Key Takeaways

  • Function notation provides a standard way to represent relationships between inputs and outputs.
  • f(x) is read as "f of x."
  • f(x) does not mean f multiplied by x.
  • The letter f names the function.
  • The value inside the parentheses identifies the input.
  • f(x) represents the output of the function.
  • To evaluate a function, substitute the given input for every occurrence of the input variable.
  • Using parentheses during substitution helps prevent sign and exponent errors.
  • f(3) means the output of function f when the input is 3.
  • If f(3) = 7, then the point (3, 7) lies on the graph of f.
  • Functions can be named using letters other than f.
  • Function notation allows several different functions to be discussed clearly at the same time.
  • A function can be evaluated using numerical inputs, negative inputs, variables, or algebraic expressions.
  • Function notation can be read from equations, tables, graphs, and real-world models.
  • Domain values are the possible values that can appear as inputs.
  • Range values are the possible resulting outputs.
  • Real-world function names such as CNein, d(t), and A(r) can communicate what the quantities represent.
  • Function notation is more descriptive than always using x and y.
  • Function notation becomes increasingly important in advanced algebra, calculus, science, and other quantitative subjects.
  • The central idea is simple: input → function rule → output.

4. Multiple Representations

Learning outcomes
  • I can represent functions using tables.
  • I can represent functions using equations.
  • I can represent functions using graphs.
  • I can convert between different representations.
  • I can explain how each representation describes the same relationship.

https://images.openai.com/static-rsc-4/WCoYWXYdqVA9rlpV5KqLQS-FMNV_Im7pd-B_YApixn7p3qlZ6hIED6zgmQ3sGcLPv01-NUH-2kGCcALVurMvKJ9QrPGuaXPZmqFgXrosiOsN22R2--gHICDxUL61f8ggNfsiNNl_AVvgxusPb00GIwMLWMVtlxeYIAxCQdUu-Xx3W0IS-UtTKPnAq4uIgbQU?purpose=fullsize
 
https://images.openai.com/static-rsc-4/tbOUAOVBq05VvfXS1FyV9-iqjEK2seff93XQTQbs9wBku3gQxbZ7wVyxr8HSE9m3P7DqCY8LCbgs13LZpRoGF194reLoG8GarmWWy91I86uYlr5VsDOFgULIKJcRjS0bnl6cuvZ0bif86HFJnPEQQEgk8sz3PbWu73abm6Rl9tjD_FEW3VlirOgKjF3AU4TW?purpose=fullsize
 
https://images.openai.com/static-rsc-4/W96LDGqdGFNnYi--86SgfiYzpS545OwJZAh_AohOFTJj3o4S1Qikfo1zhDOdUsl0r_3urAIkTlnnzXNzun3G1vR5y68m4Snzk6ceKyZ8NO7HmssaHKbAzUWjvd-GiVV4cLuvL0i-WngKabC2Oiq0GblwUFFXnXsD2ldZdFCs_oodcylGlCOG9wtm8DQN9s-i?purpose=fullsize
 
5

One Relationship, Different Representations

A function describes a relationship between:

inputs and outputs.

The same function can be represented in several different ways.

For example, imagine the rule:

Multiply the input by 2, then add 1.

We could represent this using an equation:

f(x) = 2x + 1

We could represent it using a table:

x f(x)
-2 -3
-1 -1
0 1
1 3
2 5

We could also represent it using a:

graph.

Although these representations look different, they all describe exactly the:

same mathematical relationship.


The Main Representations of a Function

Functions can commonly be represented using:

  • words
  • tables
  • equations
  • graphs
  • ordered pairs
  • mapping diagrams

In this topic, we will concentrate mainly on:

tables, equations, and graphs.

Being able to move between these representations is an important part of:

understanding functions.

https://images.openai.com/static-rsc-4/in9fPng_Sn4DHasiEX7k7aNat8E_OFv0Eqe2N-gZEV4NXK-XrkB9piL3cRhW7hHB1IBVabujGjuG3St90bEgqSpBwHmoZlJuguWydRAyUp5isotsX4R-g7SlZanmK5Pffq-3OEZppoC_bUpD4jX9nVIB52Utoz7nCyl6mJFN0dHPjmIxgFefpoCc0eO7RVwf?purpose=fullsize
 
https://images.openai.com/static-rsc-4/h1iAT4_pXN2bucV6aTK6RI7XinSkZjL-74IievGR8Gu1TDN7aXf-l1huZl6t5Uyu7c0Pvy6eFbxQlpYlP6LzNfR-fkoV7ke-SxZUzeMy1eVuJOyLty4b3KT0FL8vkQSiW8kRE8ei-KxaM8AA3dWo5uqLER_CfMlgacmCIFYxKJat_qZULXySfk5zmnAflqM_?purpose=fullsize
 
https://images.openai.com/static-rsc-4/ni4KvibVPXCUjQut0eay92HFTNNpYAd8LabW51T__Q4_fN4O9dH_J41nWbLf-Z_Yuwm8TDGkSrNIX_cqDZlOwk8Pv10fd1TwsKzR_9xq5ay4HxHW_k1xLDSKd9eOwTsKo-QwWF9YkCN5IYs-9I_Y1LwEpxPiPRbUPsYqKBuAnoV4Y6IJQPaL6IOv5fBnE0Pl?purpose=fullsize
 
4

Why Use Different Representations?

Each representation helps us see something different.

A table shows:

specific input-output pairs.

An equation shows:

the mathematical rule.

A graph shows:

the visual pattern or shape of the relationship.

Words explain:

what the relationship means.

No single representation is always best.

Different representations help us answer:

different questions.


Representing Functions with Tables

A function table lists input values and their corresponding:

outputs.

For example:

f(x) = 3x + 2

Choose some x-values and calculate f(x).

x f(x)
-2 -4
-1 -1
0 2
1 5
2 8

Each row represents one:

input-output pair.


Creating a Table from an Equation

Suppose:

f(x) = 2x - 3

We want to create a table.

Choose:

x = -2, -1, 0, 1, 2

Now substitute each value into the equation.

For x = -2:

f(-2) = 2(-2) - 3

f(-2) = -7

For x = -1:

f(-1) = 2(-1) - 3

f(-1) = -5

For x = 0:

f(0) = 2(0) - 3

f(0) = -3

For x = 1:

f(1) = 2(1) - 3

f(1) = -1

For x = 2:

f(2) = 2(2) - 3

f(2) = 1

So:

x f(x)
-2 -7
-1 -5
0 -3
1 -1
2 1

The table represents the same function as:

f(x) = 2x - 3.


Tables Show Specific Values

One advantage of a table is that it gives us:

exact values.

If we want to know f(2), we can simply find:

x = 2

and read the corresponding:

output.

In the previous example:

f(2) = 1

Tables are especially useful when we want to examine:

individual input-output pairs.


Limitations of Tables

A table usually shows only:

some values of a function.

Consider:

f(x) = 2x - 3

A table might show x-values from -2 to 2.

But the function may also be defined for:

x = 10

x = 3.5

x = -100

and many other values.

The table does not necessarily show the function's:

entire domain.


Representing Functions with Equations

An equation provides a mathematical rule connecting:

inputs and outputs.

For example:

f(x) = 4x + 3

tells us:

multiply the input by 4 and add 3.

An equation allows us to calculate the output for:

any allowed input.


Equations Are Compact

Suppose a function contains thousands of possible:

input-output pairs.

A table containing every pair might be impossible to:

write.

But an equation such as:

f(x) = 5x - 2

describes the entire relationship in:

one short statement.

This is one major advantage of:

equations.


Equations Reveal Structure

Consider:

f(x) = 3x + 4

The equation immediately tells us that this is a:

linear function.

We can identify:

slope = 3

and:

y-intercept = 4.

The equation reveals mathematical information that may be less obvious from a:

table.


Representing Functions with Graphs

A graph represents a function visually.

Each point on the graph has coordinates:

(x, y)

or:

(x, f(x)).

For example, if:

f(2) = 5

then the graph contains the point:

(2, 5).

A graph is created by plotting many input-output pairs.

https://images.openai.com/static-rsc-4/Pzg5i-TW68kv8H3LEBKMJWoXq0zbz94ZTE6D4clI_mma17GKD4rwWTmNBrnXV5oSaQhj5n7QLoLrSwV6oZpwAAMTu6aRzhjvJT2Wo39cz7Q2AWhb_YE8QIYHGFd4KacL-ll4JFGulSTj2Qjx3W8JWMZiARcKUtJaKyuGbw7zWLfCNjoC7MIBFqeaZglGzlwr?purpose=fullsize
 
https://images.openai.com/static-rsc-4/Q30EY7Zm_KcEu2uJEwTfYpa7M0UoPuRwCjsYwaWXpa3a31yyJj1MJ4CWSsqwdL_12dT0yt-h59qwxZt00UXEbfxctwljfKiyIeCSVP12VEflbkM9ADvmi-RPrJXcKfyf-gTOEmHWXmWlG01g-fO2q2jdW-DyryNxSMTMhRfK7FIhHZXcPP24pu3ZTD-ya-7V?purpose=fullsize
 
https://images.openai.com/static-rsc-4/ni4KvibVPXCUjQut0eay92HFTNNpYAd8LabW51T__Q4_fN4O9dH_J41nWbLf-Z_Yuwm8TDGkSrNIX_cqDZlOwk8Pv10fd1TwsKzR_9xq5ay4HxHW_k1xLDSKd9eOwTsKo-QwWF9YkCN5IYs-9I_Y1LwEpxPiPRbUPsYqKBuAnoV4Y6IJQPaL6IOv5fBnE0Pl?purpose=fullsize
 
5

Creating a Graph from a Table

Suppose we have:

x f(x)
-2 -3
-1 -1
0 1
1 3
2 5

Convert each row into an ordered pair:

(-2, -3)

(-1, -1)

(0, 1)

(1, 3)

(2, 5)

Plot these points on a coordinate plane.

Because they come from the linear function:

f(x) = 2x + 1

the points lie on a:

straight line.


The Connection Between Tables and Graphs

Every row of a function table corresponds to:

one point on the graph.

For example:

Table Entry Graph Point
x = 0, f(x) = 1 (0, 1)
x = 1, f(x) = 3 (1, 3)
x = 2, f(x) = 5 (2, 5)

This connection is fundamental.

A table and graph are not separate pieces of mathematics.

They are two ways of displaying the:

same input-output pairs.


Graphs Show Overall Behaviour

A major advantage of a graph is that it shows the:

overall pattern.

From a graph we can often quickly see:

  • whether the function increases or decreases
  • where it crosses the axes
  • whether it is linear or curved
  • maximum or minimum values
  • where the function changes direction
  • domain and range
  • unusual features

Graphs are especially useful for understanding the:

shape and behaviour of a function.


Limitations of Graphs

Graphs may not always provide:

exact values.

If a point appears near:

(4, 7)

it may be difficult to determine whether the actual output is:

7

7.1

or:

6.95.

The accuracy depends partly on the:

scale and quality of the graph.

For exact calculations, an equation or table may sometimes be:

better.


From Equation to Table

Consider:

f(x) = x²

Choose several inputs:

x = -3, -2, -1, 0, 1, 2, 3

Calculate the outputs.

x f(x)
-3 9
-2 4
-1 1
0 0
1 1
2 4
3 9

Notice the pattern.

Different inputs can produce the:

same output.

For example:

f(-2) = 4

and:

f(2) = 4.


From Table to Graph

The previous table produces the points:

(-3, 9)

(-2, 4)

(-1, 1)

(0, 0)

(1, 1)

(2, 4)

(3, 9)

Plotting these points reveals a:

parabola.

https://images.openai.com/static-rsc-4/ZvrBpGPoCqjL0OgnmRcR6Suw1qfmDOdKXjPrFDsBUuAgqyxOiZQ2FF1U4dgm4R6f2oGEuZZ3GtqKnbjBF1BqxUodAl7GIcQzLwvA5oZC_d2GfIhPuCsdZnnPcqaMZ6uhDfQvWWA6bJWCeaFBEJOGthqzJfhG1CpqzQgtP-Djk15eqmQNbNhflDkRffUItU07?purpose=fullsize
 
https://images.openai.com/static-rsc-4/EucNYuKMgSO7EX05DOfYukF3j9dwBFLWt7ilsE1dUwSFnBSd1FHn2yEOz59KmDJ6siOHnPdBl8gnC8RL--5uJEdrZflibPkoaUk70jTR76nJyuWLki0Pf_Ab7GA69BhgLtO8d-gXjBc94llVYoJ3ZbgKsz9MHrmmnUJuflrVIpAH5XywWj1frHLlmR67Qppq?purpose=fullsize
 
https://images.openai.com/static-rsc-4/qjBotcHoIEK9aFlrFgGs3LRnSpMyS1D1ynGlcsjP3xb8F196Ew5PfhkyzXgrAdl4s8ZXbARio3-QOLvKnvx_KipyWB8Amz9cYflQvfVh2joZk9ZDTYzTBLwNbP_UdeAkJNRLg5V2uSzmrvfGlIDiJ9om8L8_isYsYKfpUOhFH3hHgaOjkBZR9sQHBwEO4JGP?purpose=fullsize
 
5

The table contains the values.

The equation contains the rule.

The graph reveals the:

shape.


From Table to Equation

Sometimes we are given a table and need to determine the:

function rule.

Consider:

x y
0 4
1 7
2 10
3 13
4 16

Look at how y changes.

Each time x increases by:

1

y increases by:

3.

This suggests a linear function with:

slope = 3.

When:

x = 0

we have:

y = 4.

Therefore, the y-intercept is:

4.

The equation is:

f(x) = 3x + 4


Using First Differences

For a linear function, we can examine the:

first differences.

Consider:

x f(x)
0 2
1 6
2 10
3 14
4 18

The outputs change by:

+4, +4, +4, +4

The constant first difference tells us the function is:

linear.

The slope is:

4.

Since:

f(0) = 2

the equation is:

f(x) = 4x + 2.


When x Does Not Increase by 1

Be careful.

Consider:

x y
0 1
2 7
4 13
6 19

The y-values increase by:

6

but the x-values increase by:

2.

Therefore:

slope = change in y / change in x

slope = 6 / 2

slope = 3

Since y = 1 when x = 0:

f(x) = 3x + 1

We must compare changes in:

both variables.


From Graph to Table

Suppose a graph passes through:

(-2, -5)

(-1, -2)

(0, 1)

(1, 4)

(2, 7)

We can record these points in a table:

x f(x)
-2 -5
-1 -2
0 1
1 4
2 7

The graph has now been converted into a:

table.


From Graph to Equation

Suppose a straight-line graph crosses the y-axis at:

2

and rises:

3 units

for every:

1 unit to the right.

Then:

slope = 3

and:

y-intercept = 2.

Using:

y = mx + b

we obtain:

y = 3x + 2

or:

f(x) = 3x + 2.


Finding Slope from Two Points

Suppose a graph contains:

(1, 4)

and:

(3, 10).

Calculate the change in y:

10 - 4 = 6

Calculate the change in x:

3 - 1 = 2

Therefore:

slope = 6 / 2

slope = 3

If the graph also crosses the y-axis at 1, then:

f(x) = 3x + 1.


From Words to an Equation

Functions can also begin with a:

verbal description.

Suppose:

A taxi charges $4 initially and $2 for every kilometre travelled.

Let:

d = distance travelled

and:

C(d) = total cost.

The starting cost is:

4.

The cost increases by:

2 for every kilometre.

Therefore:

C(d) = 2d + 4


From Words to a Table

Using:

C(d) = 2d + 4

we can create:

Distance d (km) Cost C(d) ($)
0 4
1 6
2 8
3 10
4 12
5 14

The table shows specific examples of the relationship described in:

words.


From Words to a Graph

We can plot:

(0, 4)

(1, 6)

(2, 8)

(3, 10)

and so on.

The resulting graph shows that the total cost:

increases at a constant rate.

Now the same relationship has four representations:

Words: $4 starting fee plus $2/km

Equation: C(d) = 2d + 4

Table: specific distances and costs

Graph: visual representation of cost against distance


Each Representation Answers Different Questions

Consider the taxi example.

If we ask:

What is the exact cost for 5 km?

The table may answer this quickly:

$14.

If we ask:

What rule calculates the cost for any distance?

The equation is useful:

C(d) = 2d + 4.

If we ask:

How does cost change as distance increases?

The graph provides an immediate:

visual picture.


Comparing the Representations

Representation What It Shows Well Possible Limitation
Words Meaning and context May be less precise
Table Specific exact values Shows only selected inputs
Equation Complete mathematical rule Pattern may be less visually obvious
Graph Shape and overall behaviour Exact values may be difficult to read

Each representation provides a different:

view of the same relationship.


Representing a Nonlinear Function

Consider:

f(x) = x² + 1

The equation tells us the:

rule.

A table gives:

x f(x)
-3 10
-2 5
-1 2
0 1
1 2
2 5
3 10

When plotted, the points create a:

curved parabola.

https://images.openai.com/static-rsc-4/9rUouK_IB15gzR_ndnvyBu3OC7AsgCgiBFtx2FFgQBKjS4oSLDyid9k5b5lzSAl4kVS2RtX1eI-sA2eBoiGiX09OJa_4J3y6EsoJB0xOey_rPGD93HK_oeZv7wYQiW5Phv1sMzjG_99gbYx2Ecwxluz-D_1BhOsjLD-Yu2vJHHwE-jXoZfMIOGHUROn1Fdlm?purpose=fullsize
 
https://images.openai.com/static-rsc-4/vxbbXlkgTnt_28s3EY5rpEC52TxHHNy21vB7bsYYD6yOVK-PedQ9Dd4FMuh6q3jEWMMIA8GSjMHXU7Kg_-mZxfn_0J1BqAM5dKFfw4fTCqe1GKM0ClhtXoK3lkbGhaPFWWDPqW-SbpkxZ2vJx7FO6jkPcB0UtMvfKyonvl4FnINi9E6Pf2BQzmgVUZoaQTgt?purpose=fullsize
 
https://images.openai.com/static-rsc-4/EucNYuKMgSO7EX05DOfYukF3j9dwBFLWt7ilsE1dUwSFnBSd1FHn2yEOz59KmDJ6siOHnPdBl8gnC8RL--5uJEdrZflibPkoaUk70jTR76nJyuWLki0Pf_Ab7GA69BhgLtO8d-gXjBc94llVYoJ3ZbgKsz9MHrmmnUJuflrVIpAH5XywWj1frHLlmR67Qppq?purpose=fullsize
 

This demonstrates that multiple representations are useful for:

nonlinear functions as well as linear functions.


Recognizing Linear Relationships from Tables

Consider:

x y
1 5
2 8
3 11
4 14

The output increases by:

3

every time the input increases by:

1.

This constant rate of change suggests a:

linear relationship.


Recognizing Linear Relationships from Graphs

A linear relationship produces a:

straight-line graph.

The constant slope shows that the output changes at a:

constant rate.

If the graph curves, the rate of change is generally:

not constant.

Therefore, graphs make it easy to distinguish between:

linear and nonlinear relationships.


Recognizing Nonlinear Relationships from Tables

Consider:

x y
0 0
1 1
2 4
3 9
4 16

The changes in y are:

+1, +3, +5, +7

The first differences are:

not constant.

Therefore, the relationship is:

not linear.

In fact:

y = x².


Ordered Pairs as a Bridge

Ordered pairs provide a useful connection between:

tables and graphs.

A row such as:

x y
3 8

becomes:

(3, 8).

That ordered pair becomes:

a point on the graph.

So we can think of the process as:

Table row → Ordered pair → Graph point


Equations Generate Ordered Pairs

An equation can generate as many ordered pairs as we:

need.

For:

f(x) = 2x + 1

choose x = 4.

Then:

f(4) = 9

This creates the ordered pair:

(4, 9).

Choose x = 10.

Then:

f(10) = 21

This creates:

(10, 21).

Every allowed input creates a corresponding:

point on the function's graph.


Graphs Represent More Than the Points We Plot

When drawing a continuous function such as:

f(x) = 2x + 1

we might calculate only five points.

But the function contains infinitely many points between:

those calculated points.

For example:

x = 0.5

gives:

f(0.5) = 2

So:

(0.5, 2)

also lies on the graph.

The table helps us construct the graph, but it does not contain:

every possible point.


Discrete Functions

Not every function should be drawn as a:

continuous line.

Suppose:

CNein = 5n

represents the cost of buying n notebooks.

Possible values of n might be:

0, 1, 2, 3, 4, ...

Values such as:

2.6 notebooks

do not make sense.

The graph should therefore contain:

separate points.

This is a:

discrete function.

https://images.openai.com/static-rsc-4/tM-x5c9UDoTo9SO9t3yh25XkdPOHta0Qfdm0_odfiHnXunza_ahxfHu9LSmow4K2-6a_2WC6bk-VFfewknJr84LCD43Dr2g5N5VJE3g9ZYbPxRL7anTvujAnm0grbhhkDBECMPG44YdjKyuPgouBGE-Rc0ARY3q6F1i_CEk301hzoevSmpqgrur3O2Ltthv5?purpose=fullsize
 
https://images.openai.com/static-rsc-4/qaw1CWZI59WM7BFccVIed3e2dVbud-CybKveugBI01T_jOuN6KUYDysBCqwPgW1sMKczZ-IlKxu5UqOQSTudf6kno6uuyP3mT9vKjt55rVvD1ESs4OhHjXcdbHEhBz3yXTP5a5yuDkEkOcLDvje4_ko55fBS9vsHiY8uHkxy8-i0b_NkfypsGkMjwz59oODS?purpose=fullsize
 
https://images.openai.com/static-rsc-4/s6VKN9-syMTBXfPwEHlMa_hVETfWXFn8TAupNFXw-mzwNxZwsl30oTqFn7k7BaC-sBmX2LIDPpY6IdxM9EAqT2yV_WzdpwahcSi-xWMD7MtTlgNmVMUNZ-zA1qPgkZ2R9zOQJQjNVhVGBygKOq5p9K162TBtSE6j2vcHFXnMQm02phR9qXOWEyQbqCZY5bS0?purpose=fullsize
 
4

Continuous Functions

Suppose:

d(t) = 60t

represents distance travelled at 60 km/h.

Time could be:

1 hour

1.5 hours

1.57 hours

or many other values.

The inputs can vary continuously.

Therefore, the graph can normally be drawn as a:

continuous line.


Converting Between Representations

A useful skill is being able to move freely between:

words ↔ equation ↔ table ↔ graph

For example:

Words

A quantity begins at 3 and increases by 2 for each unit of x.

↓

Equation

f(x) = 2x + 3

↓

Table

x f(x)
0 3
1 5
2 7
3 9

↓

Graph

Plot:

(0, 3), (1, 5), (2, 7), (3, 9)

and connect appropriately.

All four representations describe:

the same relationship.


Worked Example 1: Equation to Table

Given:

f(x) = -2x + 5

complete the table.

For x = -1:

f(-1) = -2(-1) + 5 = 7

For x = 0:

f(0) = 5

For x = 1:

f(1) = 3

For x = 2:

f(2) = 1

For x = 3:

f(3) = -1

Therefore:

x f(x)
-1 7
0 5
1 3
2 1
3 -1

Worked Example 2: Table to Equation

Consider:

x y
0 -2
1 2
2 6
3 10

The y-values increase by:

4

when x increases by 1.

Therefore:

slope = 4.

When x = 0:

y = -2.

Therefore:

y-intercept = -2.

The equation is:

f(x) = 4x - 2.


Worked Example 3: Graph Information to Equation

A straight-line graph passes through:

(0, 6)

and:

(2, 10).

Calculate the slope:

slope = (10 - 6) / (2 - 0)

slope = 4 / 2

slope = 2

The y-intercept is:

6.

Therefore:

f(x) = 2x + 6.


Worked Example 4: Words to Multiple Representations

A streaming service charges:

$8 per month plus a one-time $12 registration fee.

Let:

m = number of months

and:

C(m) = total cost.

Equation:

C(m) = 8m + 12

Table:

Months Total Cost
0 $12
1 $20
2 $28
3 $36
4 $44

Graph:

Plot the points:

(0, 12)

(1, 20)

(2, 28)

(3, 36)

(4, 44)

Because months are normally counted in whole numbers for this model, the context may make the representation:

discrete.


Checking That Representations Match

Suppose an equation is:

f(x) = 3x - 1

but a table contains:

x f(x)
0 -1
1 2
2 6

Does the table represent the equation?

Check x = 2:

f(2) = 3(2) - 1

f(2) = 5

But the table says:

6.

Therefore, the table does:

not match the equation.


Checking a Point Against an Equation

Suppose the graph of:

f(x) = 2x + 3

appears to contain the point:

(4, 11).

Check:

f(4) = 2(4) + 3

f(4) = 11

Therefore:

(4, 11)

does lie on the graph.

This is a useful way to verify whether different representations:

agree.


Comparing Two Functions

Multiple representations also help us compare:

different functions.

Suppose:

f(x) = 2x + 1

and:

g(x) = x + 4.

A table can compare their outputs:

x f(x) g(x)
0 1 4
1 3 5
2 5 6
3 7 7
4 9 8

We can immediately see:

f(3) = g(3) = 7.


Comparing Functions Graphically

If we graph:

f(x) = 2x + 1

and:

g(x) = x + 4

the lines intersect at:

(3, 7).

This shows visually that both functions produce the same output when:

x = 3.

The table and graph communicate the same:

intersection.


Choosing the Best Representation

Different situations may favour different representations.

Use a table when:

  • exact individual values matter
  • the dataset is small
  • you want to compare selected inputs and outputs

Use an equation when:

  • you need the mathematical rule
  • you want to calculate new values
  • you want a compact representation

Use a graph when:

  • you want to see the overall pattern
  • you want to identify trends
  • you want to compare functions visually
  • you want to identify intersections or turning points

Use words when:

  • the context and meaning need to be explained

Representations Work Together

Strong mathematical understanding means being able to look at one representation and imagine:

the others.

When you see:

f(x) = 3x + 2

you should begin to imagine:

  • a table increasing by 3
  • a straight-line graph
  • a y-intercept of 2
  • an input-output rule
  • a constant rate of change

These are not separate facts.

They are different features of:

one function.


Multiple Representations in Science

Suppose an object moves at constant speed.

A scientist might describe the relationship in words:

The object moves at 5 m/s.

Equation:

d(t) = 5t

Table:

Time (s) Distance (m)
0 0
1 5
2 10
3 15
4 20

Graph:

A straight line through:

(0, 0)

with a slope of:

5.

Each representation provides useful information about the:

same physical motion.


Multiple Representations in Business

Suppose a company charges:

$25 fixed fee plus $10 per item.

Words describe the:

pricing system.

Equation:

CNein = 10n + 25

A table can show costs for selected quantities.

A graph can show how cost changes as the number of items:

increases.

This is why functions are so useful for:

mathematical modelling.


Multiple Representations in Everyday Life

The same idea appears in:

  • phone plans
  • taxi fares
  • wages
  • electricity costs
  • distance and time
  • temperature changes
  • population growth
  • savings
  • scientific experiments
  • business profits

In each situation, multiple representations help us understand the relationship from:

different perspectives.

https://images.openai.com/static-rsc-4/tqy62YB6KqTDeYuW7tEfpCCBVWuQs8bHOT1p6Qp08cGkeVPuMUC9m23oat8I065k3-dCURJaJwSSVu2tDoHPkY2AReU8Doi4Xtxj9DFXukopazh6SjqNMVmeFvMQlhTXqm82al88Rin0n7SSHJmJD81mmQgabCj_RCbfYU-gX3hq81gSXi01g4nngZZh--Nz?purpose=fullsize
 
https://images.openai.com/static-rsc-4/TiYLeLS_eqpFSHIvNe5O3WPwM-Q0WNFvCLPxcjpY5RU2i6K7wzYvYcikI_TyZ4Wq945oKi7D5dsAiICxSG5hAjfIrGk1LXq0LXHZWpucTfFscarHHoJl2b3TfKDMXqb_zTEoqvSwCuYyQoS426RaSE5ntMTCirtZ1Imsm1V5C43E7NjUJQKy6EwXtOGkwxya?purpose=fullsize
 
https://images.openai.com/static-rsc-4/2FHYm0zQfelYKNiINmziTLgsDV6tmv-RyWvo6sF1Bsyao8MGiCBEh5alMN-KEysvjLMyMykIf7QQTFTnV8Qfk-euzssFk9SrIbZ8r9Wa7pfgsJsCzX-NPMOZ-jDmg20JblFA3BjYjZ6beMXz9EpR13eE7T8u7Z6HxrBXXZRO3ayugCzBcYVRkK7HPJ9dHTHZ?purpose=fullsize
 

Common Mistake: Treating Representations as Separate

A table, equation, and graph are not:

different functions

simply because they look different.

If they represent the same input-output rule, they describe:

the same function.


Common Mistake: Connecting Discrete Points

Suppose a graph represents:

number of concert tickets purchased.

Values such as:

2.4 tickets

do not make sense.

Therefore, the plotted points should not automatically be connected with:

a continuous line.

Always consider the:

context.


Common Mistake: Reading a Graph Inaccurately

When converting a graph to a table:

  • check the axis scale
  • identify coordinates carefully
  • include negative signs
  • distinguish x from y
  • do not estimate when an exact value is clearly shown

Graph reading requires:

precision.


Common Mistake: Assuming Every Pattern Is Linear

A table may contain a clear pattern without being:

linear.

For example:

1, 4, 9, 16, 25

has a strong pattern.

But the differences are:

3, 5, 7, 9.

They are not constant.

The relationship is:

quadratic, not linear.


The REPRESENT Strategy

When working with multiple representations, ask:

R — Relationship

What relationship is being described?

E — Equation

Can I write a mathematical rule?

P — Points

What input-output pairs are known?

R — Rate or Pattern

How do the values change?

E — Examine the Graph

What shape should the relationship have?

S — Same Relationship?

Do all representations agree?

E — Explain

What does the relationship mean?

N — Note Restrictions

Is the function discrete, continuous, or otherwise restricted?

T — Test

Choose an input and check that every representation gives the same output.


Check Your Understanding

1. Name three common ways of representing a function.

2. What information does a table show particularly well?

3. What information does an equation show particularly well?

4. What information does a graph show particularly well?

5. Explain how a row in a table corresponds to a point on a graph.

6. Create a table for f(x) = 2x + 3 using x = 0, 1, 2, 3, 4.

7. Write the ordered pairs produced by your table.

8. Create a table for g(x) = x² - 1 using x = -2, -1, 0, 1, 2.

9. A table has outputs 5, 8, 11, 14 as x increases by 1. What is the constant first difference?

10. A table contains (0, 4), (1, 6), (2, 8), and (3, 10). Determine the equation.

11. A straight line has slope 5 and y-intercept -2. Write its equation.

12. Explain how you can convert an equation into a table.

13. Explain how you can convert a table into a graph.

14. Explain how you can convert a linear graph into an equation.

15. What does a constant first difference tell you about a function?

16. Why might a table fail to show the entire function?

17. Give one advantage and one limitation of a graph.

18. Give one advantage and one limitation of an equation.

19. Give one advantage and one limitation of a table.

20. Explain the difference between a discrete and continuous graph.

21. A taxi charges $6 initially plus $3 per kilometre. Write a function for the total cost.

22. Create a table for the taxi function for distances of 0, 1, 2, 3, and 4 km.

23. Explain what the slope of the taxi graph represents.

24. Explain what the y-intercept of the taxi graph represents.

25. Explain how a table, equation, graph, and verbal description can all represent the same function.


Key Terms

  • Function: Relationship assigning each allowed input exactly one output.
  • Representation: A way of displaying or describing mathematical information.
  • Table: Arrangement showing selected input-output pairs.
  • Equation: Mathematical statement describing the rule connecting variables.
  • Graph: Visual representation of the relationship between variables.
  • Ordered pair: Pair of coordinates written as (x, y).
  • Input: Value supplied to a function.
  • Output: Value produced by a function.
  • Function notation: Notation such as f(x) used to describe a function's output.
  • Linear function: Function with a constant rate of change and a straight-line graph.
  • Nonlinear function: Function whose graph is not a straight line.
  • Slope: Rate of change of a linear function.
  • Y-intercept: Point where a graph crosses the y-axis.
  • First difference: Difference between consecutive output values.
  • Discrete function: Function represented by separate input values.
  • Continuous function: Function that can take all allowed values throughout intervals.
  • Mathematical model: Mathematical representation of a real-world relationship.
  • Rate of change: Amount by which one variable changes compared with another.
  • Independent variable: Input variable.
  • Dependent variable: Output variable.

Key Takeaways

  • A function can be represented using words, tables, equations, graphs, ordered pairs, and mapping diagrams.
  • Different representations can describe exactly the same mathematical relationship.
  • A table shows specific input-output pairs clearly.
  • An equation gives a compact mathematical rule for the function.
  • A graph shows the overall shape and behaviour of a function.
  • Words help explain the meaning and context of a relationship.
  • Every row of a function table corresponds to an ordered pair.
  • Every ordered pair corresponds to a point on the graph.
  • An equation can be converted into a table by choosing inputs and calculating outputs.
  • A table can be converted into a graph by plotting its input-output pairs.
  • A linear table can often be converted into an equation by identifying the slope and y-intercept.
  • Constant first differences suggest a linear relationship when the x-values increase by equal amounts.
  • If x-values do not increase by 1, calculate slope using change in y / change in x.
  • Straight-line graphs represent linear relationships.
  • Curved graphs generally represent nonlinear relationships.
  • Tables usually show only selected values rather than every possible value of a function.
  • Graphs reveal patterns clearly but may not always provide exact values.
  • Equations allow outputs to be calculated for any allowed input.
  • Discrete functions should not automatically be drawn as continuous lines.
  • Context helps determine whether a function should be discrete or continuous.
  • Different representations are useful for answering different types of questions.
  • Checking the same input in several representations can verify that they describe the same function.
  • Strong mathematical understanding means being able to move confidently between tables, equations, graphs, and words.
  • Multiple representations provide different views of one underlying relationship, helping us understand functions more completely.


5. Real-World Functions

Learning outcomes
  • I can identify functions in everyday situations.
  • I can distinguish between independent and dependent variables.
  • I can interpret functions in context.
  • I can describe how one quantity changes with another.
  • I can model simple situations using functions.

https://images.openai.com/static-rsc-4/9Q9KrnNPI7Smz3RroYH2bM-eo9dbqyNmfTMBrZU_TvUwlSxoGBEXS6isHWYpzRm0bYUgKnT_JiNG4evorU88P56HtaYiTyj1o6G8H534pqlcY2Mpwm-3ziwCnTcHIIVkxAdRhXfC6cuF5M2hjWwUFEx26ofpt--QdPOEFUDxr9ppfGSNvvP90NMnQ32DnOqL?purpose=fullsize
 
https://images.openai.com/static-rsc-4/QhpYFxURz54WLalDrmKQgWj1GGnkvHVZyEGqQ7-JhRFjMHd0GBDaes5bFEN1u90D5R8gOjekt_KviYFboBLmx1oAateWnaBmDuRpBD_-8Km5YMpdDFLpA-VBj4YN3TYiTuBuHbW_KmbpfKrZG4WSwaJ-qx9VmSrPz_6GB9cXKhEgvopFzsCFL0HwrAnfXH7s?purpose=fullsize
 
https://images.openai.com/static-rsc-4/qU0etf33RAobJhT3uYcUjFy7EsKXm2xHAxqXE2wqIIDLK4Lk-wYq6abhSFlD-H6ESosZ_e_3dlK0zFoch9IwNXlefXRNbaHZxzSAbsBsXHgD-otlP6QFu-2OIUcwuKkUFx1zvZeaShHO4Xy2i_MU5hetdQk5m2otENtc7-_Bl9rR9I4ZBfiC0xkGIVtzAECL?purpose=fullsize
 
6

Functions Are Everywhere

Functions are not just mathematical equations.

They describe relationships that occur throughout:

everyday life, science, technology, business, and nature.

Whenever one quantity depends on another quantity, there may be a function.

For example:

The cost of fuel depends on how many litres you buy.

The distance travelled depends on how long you travel.

The amount you earn depends on how many hours you work.

The area of a circle depends on its radius.

In each situation, one quantity acts as an:

input

and another quantity is the resulting:

output.


Input → Relationship → Output

A useful way to recognize a function is:

Input → Rule or Relationship → Output

For example:

Hours worked → Pay rate → Total pay

If you earn $15 per hour:

1 hour → $15

2 hours → $30

5 hours → $75

The number of hours determines the:

total pay.

We can model this relationship using:

PHerz = 15h

where:

h = hours worked

and:

PHerz = total pay.

https://images.openai.com/static-rsc-4/KO0yic2_TB-xnRgEe5WEqYb09kFGJuk-lsi2wgQSxy6eFY99XAHpBb4VnJWTQY8vAnWtmoEb0GrXui4j1GcUjRHFFga4DrXdO8StMu5sM-juZ3pzJfemZNQxi6JTEBgIR7F4Ggs5j1Fj_bG5ehmXI2wQMndxkSzSvhojoLA5Ai4h5Jub9-bkuiMp5hlcY5pP?purpose=fullsize
 
https://images.openai.com/static-rsc-4/vECFgKHQdmgiEsytpjwQVvzd4Bl8o1gMM6JmxzqZRkd_UZog0jTMh50HuaKUg5waF0jKCVTfH0h4scQ-flQKJBkQ3L4ww47ZpWaZ7cj-geuoUGdljHITBfhIO2Yh_VglMiK7R4vUhHzU62IvBCwOQh66nnTgLnKZY1vBkvqjWUYqfu53nkCTWuwjZ_PypHqz?purpose=fullsize
 
https://images.openai.com/static-rsc-4/OAoTdTMJZP-zwftwNzAuVPPBl02HvdrqH6t2K1DpBNPCRZEYBrce3Zs7J_PjEfIa1Pc189Wm53mLZGoGYzJcJK08RDPFYv6EYrFafcVPiMcWneyDqFLt_Riq5U8qLcKVs1MtfU0SnGnjfUFgQApQdwxm6F__uf0s0P6XCdgu2zWLUv84j3fRbTYfBkbgtF5G?purpose=fullsize
 
5

Independent and Dependent Variables

In real-world functions, we often describe the two quantities as:

independent and dependent variables.

The independent variable is the input.

The dependent variable is the output.

The dependent variable changes because of, or is determined by, the:

independent variable.


Example: Distance and Time

Imagine a cyclist travelling at a constant speed of:

12 km/h.

The distance travelled depends on:

time.

Therefore:

Time = independent variable

Distance = dependent variable

We can write:

d(t) = 12t

where:

t = time in hours

and:

d(t) = distance travelled in kilometres.

After 3 hours:

d(3) = 12(3)

d(3) = 36

The cyclist has travelled:

36 km.


How to Identify the Variables

Ask:

Which quantity determines or helps determine the other?

That quantity is usually the:

independent variable.

Then ask:

Which quantity changes in response?

That quantity is usually the:

dependent variable.

For example:

The amount of water in a tank increases as filling time increases.

Time is the:

independent variable.

Amount of water is the:

dependent variable.


Independent Does Not Mean Unrelated

The word independent can sometimes be confusing.

It does not necessarily mean the variable has nothing to do with other quantities.

Instead, in a function model it usually means that we treat it as the:

input variable.

The dependent variable is then calculated or observed based on that:

input.


Identifying Functions in Everyday Life

Consider a parking garage that charges:

$3 per hour.

The total cost depends on the:

number of hours parked.

We could write:

CHerz = 3h

where:

h = hours parked

and:

CHerz = parking cost.

This is a real-world:

function.


Why Is It a Function?

For each allowed number of hours parked, there is exactly:

one corresponding cost.

For example:

1 hour → $3

2 hours → $6

3 hours → $9

An input cannot produce two different outputs under the same:

pricing rule.

That is why the relationship is a:

function.


Real-World Relationships That Are Functions

Many familiar relationships can be modeled as functions.

Examples include:

  • wages depending on hours worked
  • cost depending on quantity purchased
  • distance depending on travel time
  • temperature depending on time
  • population depending on year
  • area depending on dimensions
  • electricity cost depending on energy used
  • fuel used depending on distance travelled
  • height of a projectile depending on time
  • account balance depending on time

The important question is:

Does each allowed input correspond to exactly one output?


A Relationship That Is Not a Function

Suppose we try to describe:

people → phone numbers

A single person might have:

  • a personal phone number
  • a work number
  • another mobile number

Therefore, one input could correspond to:

several outputs.

Under that particular definition, the relationship would not be a:

function.

The way we define the input and output matters.


Context Matters

Consider:

Student → height

At a specific moment in time, each student has one:

height.

This can be treated as a function.

But:

Student → friends

would not normally be a function because one student may have:

many friends.

When deciding whether a real-world relationship is a function, carefully identify:

the input and the output.


Functions and Units

Real-world functions usually involve:

units.

Suppose:

CNein = 4n

represents the cost of buying notebooks.

Then:

n = number of notebooks

and:

CNein = cost in dollars.

If:

C(5) = 20

we should interpret the result as:

5 notebooks cost $20.

Not simply:

20.

Units give mathematical answers their:

real-world meaning.


Interpreting Function Notation in Context

Suppose:

T(t)

represents the temperature t hours after sunrise.

Then:

T(4) = 28

means:

The temperature 4 hours after sunrise is 28°C.

It does not simply mean:

4 becomes 28.

Function notation should always be interpreted using the:

context of the situation.


Another Context Example

Suppose:

P(t)

represents the population of a town t years after 2025.

If:

P(10) = 75,000

then this means:

10 years after 2025, the model gives a population of 75,000.

Since:

2025 + 10 = 2035

we could also say:

The model gives a population of 75,000 in 2035.


Describing How Quantities Change

Functions allow us to describe how one quantity changes as:

another quantity changes.

For example:

CNein = 5n

As the number of items increases, the total cost:

increases.

More specifically:

For every additional item, the cost increases by:

$5.

This is called a:

rate of change.


Rate of Change

The rate of change tells us how much the dependent variable changes when the independent variable:

changes.

Suppose:

d(t) = 60t

where d is distance in kilometres and t is time in hours.

The rate of change is:

60 km/h.

This means:

For every additional hour, distance increases by 60 km.


Rates Have Units

A real-world rate of change often combines:

two units.

Examples include:

60 km/h

$15/hour

5 L/min

$3/kg

2°C/hour

The units help explain what the rate:

means.


Positive Relationships

Sometimes, as one variable increases, the other variable also:

increases.

For example:

More hours worked → more money earned

More items purchased → greater total cost

More time travelling → greater distance travelled

These are examples of:

increasing relationships.

https://images.openai.com/static-rsc-4/zzgHiqvZEYUUCD4XfIJJxWX-xv3ZzJM71E678mF7DydYGrwGEtK8w9wL_j9nPq_H3emNsxa3oJwVfjkLBDz7r1-1i79t4CWhaYei0S8iTXVgPHmBDpx5XGMhUwtbfM7_kHRPz6O3ubX-ghsjcEWqDgvXTXhpV-ozda0VzuPncSoS3guKe76dZyLxs2o7iqGQ?purpose=fullsize
 
https://images.openai.com/static-rsc-4/akPZdS47F8NUW_4uZXhKFc74S79d2epy_qFgckkmJuC4nVkuWVUHl7dnHH2CwDhrh3sF10rTf-q_k8OTj1sxV_OMB-nmodmLHht9uThvgAdh6qf3DU6g5FTXYF_UV93a4sEiJtGAeX2aVwD3ggiDgdt_zQRMRvHi9xAYTRPKm7tQ15qDeehs6vmoLsbLPGK1?purpose=fullsize
 
https://images.openai.com/static-rsc-4/-en9Q8U6RAT6OK2AZJvTlQKlItpWJKyEd9X_6ivyDiHhO_yt9IoIujRvp5IW7pQy3vJJ3smYeoYgnWcskJcdcT8vdRZXax4LH0LpE-IEkOVIsQxFKXhjuPBTGkNh_bPeMwDsU-FkaksMmxlzoxd8G0EE2SwelBf8uMqTAiNAByyKVp6o5gUilmtzCQlClmGv?purpose=fullsize
 
7

Decreasing Relationships

Sometimes, as one quantity increases, another:

decreases.

For example:

A car begins with 50 litres of fuel and uses:

5 litres per hour.

We could model the remaining fuel as:

F(t) = 50 - 5t

As time increases, the amount of fuel:

decreases.

The rate of change is:

-5 L/h.

The negative sign tells us that fuel is being:

used up.


Constant Relationships

Sometimes the output remains unchanged even when the input:

changes.

Suppose a parking garage charges a flat daily fee of:

$20.

The cost might be modeled as:

CHerz = 20

for the allowed parking period.

Whether you park for 2 hours or 6 hours, the cost remains:

$20.

This is a:

constant function.


Linear Real-World Functions

Many simple real-world situations can be modeled using:

linear functions.

A common form is:

y = mx + b

or:

f(x) = mx + b

where:

m = rate of change

and:

b = starting value.

This structure appears frequently in:

real-world models.


Understanding the Starting Value

Consider:

C(d) = 2d + 5

Suppose this represents a taxi fare.

The taxi charges:

$5 before any distance is travelled

plus:

$2 per kilometre.

Therefore:

5 = starting fee

and:

2 = rate per kilometre.


Starting Value + Rate × Input

Many real-world linear functions can be understood using:

Output = Starting Value + (Rate × Input)

For example:

A gym charges:

$30 membership fee

plus:

$8 per visit.

Let:

v = number of visits

and:

C(v) = total cost.

Then:

C(v) = 30 + 8v

or:

C(v) = 8v + 30.


Creating a Function from a Situation

To create a simple function model:

Step 1: Identify the independent variable.

Step 2: Identify the dependent variable.

Step 3: Determine the starting value.

Step 4: Determine the rate of change.

Step 5: Write the function.

Step 6: Check that the function makes sense in context.


Worked Example: Movie Tickets

Movie tickets cost:

$12 each.

Let:

n = number of tickets

and:

CNein = total cost.

There is no additional starting fee.

Therefore:

CNein = 12n

For 4 tickets:

C(4) = 12(4)

C(4) = 48

So:

4 tickets cost $48.


Representing the Movie Ticket Function

We can represent:

CNein = 12n

using a table:

Tickets Cost ($)
0 0
1 12
2 24
3 36
4 48
5 60

Each row represents:

one input-output pair.


Is the Movie Ticket Function Continuous?

Can someone normally purchase:

2.7 movie tickets?

No.

The number of tickets must normally be:

whole numbers.

Therefore, this real-world function has a:

discrete domain.

Its graph should normally contain:

separate points rather than a continuous line.

https://images.openai.com/static-rsc-4/Nx6vQUBscMVI0ZHlPF17KFd1hleQBEptcKZPzTQjVLUnCpjwBPJVuueD1CjSI3GqkmOnoYWCPnigpkDL5xLc3g4ptPzIRHXK56x2J3bcSfBzxmaWEH4NFFVrD5I6UGms-gc9Q7K91FnYJGqJcA4b2NGL8ViY0GdjqL27JHBn0X-ozAsS63ixv5NpH_5baW-t?purpose=fullsize
 
https://images.openai.com/static-rsc-4/W424Be0CQJDlthzp47fvhRNvhdghyw26nc9zLfI9TzHLBu7Uag8Oab-53WZRHNU_BmGgr-7gW9mbeGoltiRh5rT4lKFfO3-r1fupYyEIxA9Mwo9M_8958zGlWyJiYtyB9f82JJUjL0U0tWFbrlpzv50TK3J4h7Fz2fgYe880JhsKDf2euKZvzXOp8B91FPdK?purpose=fullsize
 
https://images.openai.com/static-rsc-4/NjCrhPMvvcPN6ygzFHwvQzfEK0KLYP0eE__04wq46a5Ods0glML-3WoyPC7FxHIzB9JPfPiLqxJYMxHK7IKLRbsHAzANbAn2qUeWx3yt4o9ItK1dhH1HcD8WG1HgsHandWZ1AWB1cYIn2ciC-5h06nJHUu6Ws8KsF2pYNiyydarmuWpHLB5p43oPGs3hDBqs?purpose=fullsize
 
4

Worked Example: Filling a Swimming Pool

A pool already contains:

500 litres

of water.

Water enters at:

40 litres per minute.

Let:

t = time in minutes

and:

V(t) = volume of water in litres.

Starting amount:

500 L

Rate:

40 L/min

Therefore:

V(t) = 40t + 500


Interpreting the Pool Function

For:

V(t) = 40t + 500

the number:

500

represents the:

initial volume of water.

The number:

40

represents the:

rate at which water enters the pool.

If:

t = 10

then:

V(10) = 40(10) + 500

V(10) = 900

After 10 minutes, the pool contains:

900 litres.


Continuous Real-World Functions

Unlike movie tickets, time can take values such as:

2 minutes

2.5 minutes

2.57 minutes

and so on.

Therefore, the pool example can usually be modeled as a:

continuous function.

This is an important example of how:

context affects the domain of a function.


Worked Example: Cooling

Suppose a drink begins at:

80°C

and cools by approximately:

3°C per minute

over a short period.

A simple model might be:

T(t) = 80 - 3t

where:

t = time in minutes

and:

T(t) = temperature in °C.

The negative rate indicates that temperature:

decreases over time.


Interpreting the Cooling Function

Calculate:

T(5).

T(5) = 80 - 3(5)

T(5) = 65

Interpretation:

After 5 minutes, the model predicts a temperature of 65°C.

The phrase:

"the model predicts"

is important because mathematical models are often:

approximations of reality.


Models Have Limits

The cooling function:

T(t) = 80 - 3t

cannot remain accurate forever.

After 30 minutes, it predicts:

T(30) = -10°C.

That is unlikely to describe a drink cooling naturally in an ordinary room.

The model may work reasonably well only over a:

limited time interval.

Real-world functions often have restricted:

domains.


Mathematical Models

A mathematical model uses mathematics to represent a:

real situation.

Models can help us:

  • describe patterns
  • calculate unknown values
  • make predictions
  • compare situations
  • understand relationships
  • make decisions

But models are usually:

simplifications of reality.


A Model Is Not Reality

Suppose:

P(t) = 1000 + 50t

models a population.

The function assumes the population increases by exactly:

50 individuals per year.

Real populations are affected by:

  • births
  • deaths
  • migration
  • resources
  • disease
  • environmental conditions

Therefore, the mathematical function is a:

model, not a perfect description of reality.


Functions in Shopping

Suppose apples cost:

$4 per kilogram.

Let:

m = mass of apples in kilograms

and:

C(m) = cost.

Then:

C(m) = 4m

For:

m = 2.5 kg

we have:

C(2.5) = 4(2.5)

C(2.5) = 10

So:

2.5 kg of apples costs $10.

Because mass can take decimal values, this function can be:

continuous.


Functions in Employment

Suppose a worker earns:

$18 per hour.

Then:

PHerz = 18h

where:

h = hours worked

and:

PHerz = pay.

If the worker works 7.5 hours:

P(7.5) = 18(7.5)

P(7.5) = 135

The worker earns:

$135.


Functions with a Fixed Fee

Suppose a plumber charges:

$50 call-out fee

plus:

$40 per hour.

Let h represent hours worked.

Then:

CHerz = 40h + 50

The number:

40

represents the:

hourly rate.

The number:

50

represents the:

fixed starting charge.


Comparing Two Real-World Functions

Suppose two taxi companies charge:

Company A: A(d) = 2d + 5

Company B: B(d) = 3d + 2

For a 4 km trip:

A(4) = 2(4) + 5 = 13

B(4) = 3(4) + 2 = 14

The functions allow us to compare:

two real-world pricing systems.


Functions in Science

Science is full of relationships between:

variables.

Examples include:

Distance = speed × time

Density = mass / volume

Force = mass × acceleration

Voltage = current × resistance

Many scientific equations can be interpreted as:

functions.

One quantity depends mathematically on:

one or more other quantities.

https://images.openai.com/static-rsc-4/vCsi__PGvMPHh2MK7rjp4q2bKjjF3IFRlBKcFNRyvNhq1IBulp2Qhr8JcmIWUDWZuvT34hvsDzY2zIG8gX4m-wVTocK9oyk7ThpRUeOSpH_QoDcJDyIgtnQw8vMJTPvFv1pBBLiUSOClcMo0kZAhont_eyLjYFCRmNMusZ2ksdZv7PgCg64CQdy1q-lxh_qM?purpose=fullsize
 
https://images.openai.com/static-rsc-4/ibQgIVr7IqjXM9Er9rbi972Fs_NbQsZJh3Cq3ZrPUHOtGRbGfltTD7p-Di7OmzTkI6d4DDFJJn79SS6yyJmN7Nqm0uEqlzAh5i0gunVivs2hVRhwaq0acruJSbSlqbF8d691ZUaG8JcN-YvupWcYVlm7AFLSsqHJnr9yS2d9mXStX7A2wCHT4Fh11ZWGxFqd?purpose=fullsize
 
https://images.openai.com/static-rsc-4/YroDVi2dIDFP5HxRCpoe9AT02fnVcumvcLYzbOSblyeVqacsKgsgzH4zYzzVdUkT1oHR4NcN4BOzr89KUtrH5hPQMuxDQEhK2koaLBF0zRdfakfiwMPUvqkcUcDGtA4Pke3Cwdq1ofnzbieQCKaoLMoQh8cmiaZsXNHnplxA9zofjXjOaLGZ8atIBhW2cScD?purpose=fullsize
 
5

Functions in Biology

Suppose scientists measure plant height each week.

They might define:

H(t)

where:

t = time

and:

H(t) = plant height.

A table, graph, or equation could then describe how plant height:

changes over time.

Time is the:

independent variable.

Plant height is the:

dependent variable.


Functions in Chemistry

A chemist may investigate how temperature affects:

reaction rate.

Temperature could be treated as the:

independent variable.

Reaction rate could be treated as the:

dependent variable.

The relationship could be represented using:

a graph or mathematical model.

Functions therefore connect mathematics directly with:

experimental science.


Functions in Physics

Suppose an object moves at a constant velocity of:

5 m/s.

Its position might be modeled as:

d(t) = 5t

A table could show:

Time (s) Distance (m)
0 0
1 5
2 10
3 15
4 20

The graph would be:

a straight line through the origin.

The slope represents:

speed.


Functions in Geometry

Suppose we want to describe the area of a square.

If:

s = side length

then:

A(s) = s²

The area depends on:

side length.

Side length is the:

independent variable.

Area is the:

dependent variable.

This function is nonlinear because its graph is:

curved.


Not All Real-World Functions Are Linear

Many introductory examples are linear because they are:

easy to model.

But real-world functions can also be:

  • quadratic
  • exponential
  • periodic
  • piecewise
  • inverse
  • logarithmic

For example, the area of a circle is:

A(r) = πr²

This is not a linear relationship.

Doubling the radius does not simply:

double the area.


Example: Area of a Circle

Consider:

A(r) = πr²

If:

r = 2

then:

A(2) = 4π

If:

r = 4

then:

A(4) = 16π

The radius doubled from:

2 to 4.

But the area became:

four times as large.

This illustrates a:

nonlinear relationship.


Reading Real-World Graphs

Graphs are particularly useful for real-world functions because they show:

how quantities change.

When interpreting a real-world graph, ask:

  • What does the x-axis represent?
  • What does the y-axis represent?
  • What are the units?
  • Is the graph increasing or decreasing?
  • Is the relationship linear?
  • Is the rate of change constant?
  • What do intercepts mean?
  • Are there maximum or minimum values?
  • What domain makes sense?

These questions help transform a graph into a:

meaningful explanation.


Interpreting a Distance-Time Graph

Suppose a distance-time graph rises steadily.

This tells us:

distance increases as time increases.

If the graph is a straight line, the object is moving at a:

constant speed.

A steeper line represents:

a greater speed.

A horizontal section means the distance is not changing, so the object is:

stationary.

https://images.openai.com/static-rsc-4/kbrIUdn7lR9pLfRnWHllZXmq5Ks3vNk3ih_z5on0WjmQE9GAoOg4m_cH9n1ZjH8y2TtfRat_4SF_YFAQM16kn_FgS5AohIy9wfg44gvn4ET1HewiPz4wZ76hu4KFzVjnacbRH5fO3_ESFUcVEGL-o6HIeCHWDZGEhzfcHBOjjogiPXzm3o6YURPNVAXCrKws?purpose=fullsize
 
https://images.openai.com/static-rsc-4/ppkdWWSB1NBmbpVVjvsNpOV5jJ_ervmkBMqbsPyWa8knGlSHtY9-_8MQB9xUdn6fYsCVSG1Biwooh-sdyIsgBE1AVk0AwRForpszGBEjPpeprtyh_zIiqsPZ3Ojs7VVspX0ndOBMdsLTbtUvYS6v6oEgEeizqK6ltLpUelDjFj9Rct-1TAFXKROjxmPce2A0?purpose=fullsize
 
https://images.openai.com/static-rsc-4/QWwsa2tpDe3ZunFs-pUtlSZgMBHC8unIc_ZVgYx_Ndvroqlm5Yushl4k5EvWy_Pcrsqp7OUqucDlpu_KCOniP0qftXEvZQ8GyFCj6RgXUW6zEZha-z-8-3YBEvbovdqy9S7mnbRTXFuXa-npWBjs8iZ5h23Af7-_2g1zH5wMQjwxPQWNwlzvhN2xTo8gxXxF?purpose=fullsize
 
6

Interpreting an Intercept

Suppose:

C(x) = 5x + 20

represents a service charge.

The graph crosses the y-axis at:

20.

This means that when:

x = 0

the cost is still:

$20.

In context, the y-intercept represents the:

fixed starting charge.

Intercepts often have important:

real-world meanings.


Interpreting Slope

For:

C(x) = 5x + 20

the slope is:

5.

If x represents hours, the slope might mean:

$5 per hour.

If x represents kilograms, it might mean:

$5 per kilogram.

The number alone is not enough.

We must interpret the slope using:

the variables and units.


Building a Model from a Table

Suppose:

Hours Cost ($)
0 10
1 14
2 18
3 22
4 26

The cost increases by:

$4 per hour.

Therefore:

rate = 4

When:

h = 0

the cost is:

$10.

Therefore:

starting value = 10

The function is:

CHerz = 4h + 10.


Interpreting the Model

For:

CHerz = 4h + 10

we can say:

There is a $10 starting charge, and the cost increases by $4 for each additional hour.

This verbal explanation is often just as important as:

writing the equation.

A good mathematical model should be understandable in:

context.


Building a Model from Words

Suppose:

A water tank begins with 200 L and loses 8 L every minute.

Identify the variables.

Independent variable:

time, t

Dependent variable:

volume, V

Starting value:

200 L

Rate:

-8 L/min

Therefore:

V(t) = 200 - 8t


Interpreting the Tank Model

For:

V(t) = 200 - 8t

calculate:

V(10).

V(10) = 200 - 8(10)

V(10) = 120

Interpretation:

After 10 minutes, 120 L of water remains.


Finding a Meaningful Domain

For:

V(t) = 200 - 8t

can t equal:

100 minutes?

The equation would produce:

V(100) = -600 L.

A tank cannot contain:

negative water.

The tank reaches zero when:

200 - 8t = 0

8t = 200

t = 25

Therefore, a meaningful domain is:

0 ≤ t ≤ 25.


Real-World Restrictions

Mathematical equations may allow values that do not make sense in:

real situations.

Examples:

Number of people cannot be negative.

Number of cars usually must be a whole number.

Time may have a starting and ending point.

A container cannot hold more than its capacity.

Distance cannot always continue increasing forever.

Always interpret the:

context.


Prediction and Interpolation

Suppose we have data from:

0 to 10 hours.

Using a model to estimate a value at:

6 hours

is called interpolation because the value lies within the observed range.

Interpolation is often reasonably:

reliable, assuming the model fits the data well.


Extrapolation

Using the same model to predict a value at:

100 hours

is called extrapolation.

This extends the model beyond the observed:

data range.

Extrapolation can be much less reliable because the relationship may:

change outside the known interval.


Models and Predictions

Functions allow us to make predictions.

But predictions depend on:

how appropriate the model is.

A model may work well:

within a certain domain

but poorly:

outside that domain.

This is why mathematical modelling requires both:

calculation and judgment.


A Complete Real-World Function Example

A bicycle rental shop charges:

$10 starting fee plus $6 per hour.

Let:

h = number of hours

and:

CHerz = total cost.

The function is:

CHerz = 6h + 10

The independent variable is:

hours rented.

The dependent variable is:

total cost.

The rate of change is:

$6/hour.

The starting value is:

$10.

For 5 hours:

C(5) = 6(5) + 10

C(5) = 40

Interpretation:

Renting the bicycle for 5 hours costs $40.

This single example connects:

variables, function notation, equations, rates, context, and interpretation.


A Strategy for Real-World Functions

When you encounter a real-world function, use these questions:

1. What quantities are changing?

Identify the:

variables.

2. Which quantity is the input?

This is usually the:

independent variable.

3. Which quantity depends on the input?

This is the:

dependent variable.

4. What is the starting value?

Look for the value when the input is:

zero.

5. What is the rate of change?

Determine how quickly the output:

increases or decreases.

6. Can I write a function?

For a simple linear model:

Output = Rate × Input + Starting Value

7. Does the answer make sense?

Check:

units, domain, and context.


Common Mistake: Reversing the Variables

Suppose:

Total cost depends on the number of tickets purchased.

Correct:

Number of tickets = independent variable

Total cost = dependent variable

The cost depends on the number of tickets, not:

the other way around.


Common Mistake: Ignoring Units

Suppose:

d(4) = 240

If d represents kilometres and the input represents hours, the interpretation should be:

After 4 hours, the distance travelled is 240 km.

Units are essential to:

meaningful interpretation.


Common Mistake: Ignoring the Starting Value

Suppose a taxi charges:

$4 starting fee plus $2/km.

Incorrect:

C(d) = 2d

Correct:

C(d) = 2d + 4

The starting fee must be included even when:

d = 0.


Common Mistake: Ignoring Negative Rates

Suppose a tank loses:

3 L/min.

If it begins with 100 L, the model is:

V(t) = 100 - 3t

not:

V(t) = 100 + 3t.

The negative rate represents a quantity that is:

decreasing.


Common Mistake: Extending Models Forever

A function may be mathematically defined for many values but only make sense over a:

limited domain.

Always ask:

Does this input make sense in the real situation?

A good mathematical model includes:

reasonable restrictions.


Check Your Understanding

1. What is a real-world function?

2. Define independent variable.

3. Define dependent variable.

4. If total pay depends on hours worked, which variable is independent?

5. If plant height is measured over time, which variable is dependent?

6. A worker earns $20 per hour. Write a function for total pay PHerz.

7. Use your function to calculate P(7).

8. Interpret P(7) in context.

9. A taxi charges $5 initially plus $3/km. Write a function for total cost C(d).

10. What does the 5 represent in your function?

11. What does the 3 represent?

12. Calculate the cost of a 10 km journey.

13. A tank contains 600 L and loses 20 L/min. Write a function for its volume.

14. Which variable is independent in the tank model?

15. Which variable is dependent?

16. Why is the rate of change negative?

17. When will the tank become empty?

18. What is a reasonable domain for the tank function?

19. Explain the difference between a discrete and continuous real-world function.

20. Is the number of movie tickets purchased usually discrete or continuous? Explain.

21. Is the mass of fruit purchased usually discrete or continuous? Explain.

22. A table begins at $15 and increases by $4 for every additional hour. Write a function describing the relationship.

23. Explain what the slope represents in your function.

24. Explain what the y-intercept represents.

25. Why should mathematical models not always be extrapolated far beyond their original data?

26. Give an example of a real-world function from science.

27. Give an example of a real-world function from everyday life.

28. Explain why units are important when interpreting functions.

29. Describe how you would determine whether a real-world relationship is a function.

30. Explain how functions can help us understand and predict real-world situations.


Key Terms

  • Function: Relationship in which each allowed input has exactly one output.
  • Real-world function: Function used to represent a relationship between quantities in a real situation.
  • Independent variable: Input variable used to determine or predict another quantity.
  • Dependent variable: Output variable whose value depends on the input.
  • Input: Value supplied to a function.
  • Output: Value produced by a function.
  • Variable: Quantity that can change.
  • Function notation: Notation such as f(x) used to represent the output of a function.
  • Rate of change: Amount the dependent variable changes compared with the independent variable.
  • Starting value: Value of the dependent variable when the input is zero.
  • Linear function: Function with a constant rate of change.
  • Constant function: Function whose output remains unchanged.
  • Mathematical model: Mathematical representation of a real-world situation.
  • Discrete: Consisting of separate individual values.
  • Continuous: Able to take all values throughout an interval.
  • Domain: Set of meaningful or allowed input values.
  • Range: Set of possible output values.
  • Interpolation: Estimating a value within the range of known data.
  • Extrapolation: Predicting beyond the range of known data.
  • Slope: Rate of change of a linear function.
  • Y-intercept: Output value when the input is zero.

Key Takeaways

  • Functions can describe relationships found throughout everyday life, science, business, and technology.
  • A function connects an input to exactly one output.
  • The independent variable is usually the input.
  • The dependent variable is usually the output.
  • The dependent variable changes in relation to the independent variable.
  • Function notation can give real-world quantities meaningful names, such as CNein for cost or d(t) for distance.
  • Function values should always be interpreted using their context and units.
  • Real-world functions can be represented using words, equations, tables, and graphs.
  • The rate of change describes how one quantity changes compared with another.
  • Rates should be interpreted with appropriate units such as km/h, $/hour, or L/min.
  • Positive rates describe increasing relationships.
  • Negative rates describe decreasing relationships.
  • A constant function has an output that does not change as the input changes.
  • Many simple real-world situations can be modeled using linear functions.
  • In a linear model, the slope represents the rate of change.
  • The y-intercept often represents the starting value.
  • A useful linear model is Output = Rate × Input + Starting Value.
  • Real-world models may have restricted domains.
  • Counts such as people, tickets, or cars are usually discrete.
  • Measurements such as time, distance, mass, and temperature can often be continuous.
  • Not every real-world function is linear.
  • Mathematical models are simplifications and may not remain accurate forever.
  • Interpolation estimates values within known data, while extrapolation predicts beyond it.
  • Predictions become less reliable when a model is used far outside the conditions for which it was developed.
  • A good real-world model should be mathematically correct and meaningful in context.
  • Functions allow us to describe, calculate, compare, and predict relationships between changing quantities.