Collecting and Organizing Data
| Site: | Young Education |
| Course: | Data and Probability Foundations |
| Book: | Collecting and Organizing Data |
| Printed by: | Guest user |
| Date: | Friday, 25 September 2026, 1:01 AM |
1. What Is Data?
Learning outcomes
- I can define data and explain its importance in understanding the world.
- I can distinguish between qualitative and quantitative data.
- I can identify different sources of data and information.
- I can classify data according to its type.
- I can explain how data is used to answer questions and solve problems.


2. Collecting Data
Learning outcomes
- I can describe common methods of collecting data, including surveys, experiments, and observations.
- I can explain the advantages and limitations of different data collection methods.
- I can distinguish between populations and samples.
- I can identify appropriate sampling methods for different situations.
- I can collect data systematically and accurately.
Introduction
Good decisions depend on good data. Whether scientists are studying climate change, businesses are surveying customers, or teachers are assessing student learning, they all need reliable information.
However, collecting useful data requires careful planning. Choosing the right method, selecting appropriate participants, and recording information accurately all help ensure that the data collected is reliable and meaningful.
Learning how to collect data is an essential skill in mathematics, science, and everyday life.


What Is Data Collection?
Data collection is the process of gathering information to answer a question or solve a problem.
Before collecting data, it is important to ask:
- What question are we trying to answer?
- What information is needed?
- How will the data be collected?
- Who or what will be studied?
Careful planning helps ensure that the data collected is useful and reliable.
Common Methods of Collecting Data
There are several ways to collect data.
The three most common methods are:
- Surveys
- Experiments
- Observations
Each method is suited to different types of investigations.
Surveys
A survey collects information by asking people questions.
Surveys may use:
- Questionnaires
- Interviews
- Online forms
- Opinion polls
Examples:
- Favourite school subject
- Hours of sleep each night
- Preferred sports
Advantages
- Can collect information from many people.
- Quick and relatively inexpensive.
- Useful for opinions and preferences.
Limitations
- People may give inaccurate answers.
- Questions may be misunderstood.
- Results may be biased if the sample is not representative.


Experiments
An experiment is used to investigate how one factor affects another.
Experiments involve:
- Changing an independent variable.
- Measuring a dependent variable.
- Keeping other variables controlled.
Example:
Investigating how different amounts of sunlight affect plant growth.
Advantages
- Can identify cause-and-effect relationships.
- Produces measurable results.
- Variables can be carefully controlled.
Limitations
- May require specialised equipment.
- Can take time to complete.
- Some experiments are difficult or impossible to perform.


Observations
An observation involves watching and recording what happens without changing the situation.
Examples include:
- Counting birds in a park.
- Recording weather conditions.
- Watching animal behaviour.
- Measuring traffic flow.
Advantages
- Shows natural behaviour.
- Often simple to perform.
- Useful when experiments are not practical.
Limitations
- Cannot always identify cause and effect.
- Observer bias may affect results.
- Some events may be difficult to observe.


Comparing Data Collection Methods
| Method | Best Used For | Advantage | Limitation |
|---|---|---|---|
| Survey | Opinions and preferences | Quick to collect information | Responses may be inaccurate |
| Experiment | Testing relationships | Identifies cause and effect | Can require time and equipment |
| Observation | Natural behaviour | Does not interfere with events | Cannot always explain why something happens |
Choosing the right method depends on the question being investigated.
Populations and Samples
Often it is impossible to collect data from every member of a group.
Instead, we collect information from a sample.
Population
The population is the entire group being studied.
Example:
All students in a school.
Sample
A sample is a smaller group selected from the population.
Example:
One class of 30 students.
A well-chosen sample can provide useful information about the whole population.


Sampling Methods
Different investigations require different sampling methods.
Random Sampling
Individuals are selected by chance.
Advantages:
- Reduces bias.
- Gives everyone an equal chance of being selected.
Systematic Sampling
Individuals are selected at regular intervals.
Example:
Every 10th customer entering a shop.
Convenience Sampling
The easiest individuals to reach are selected.
Example:
Surveying your own classmates.
This method is quick but may not represent the whole population.
Stratified Sampling
The population is divided into groups, and samples are taken from each group.
Example:
Selecting students from every grade level in a school.
This helps ensure that important groups are represented.


Collecting Data Systematically
Good data collection follows a clear process.
Scientists and mathematicians:
- Decide what information is needed.
- Choose an appropriate collection method.
- Select a suitable sample.
- Record data carefully.
- Check for errors.
- Organize the results.
Collecting data systematically improves reliability.
Recording Data Accurately
Accurate recording is essential.
Good practices include:
- Using tables.
- Recording measurements immediately.
- Using consistent units.
- Measuring carefully.
- Checking calculations.
- Repeating measurements when necessary.
Mistakes made during data collection can affect the conclusions of an investigation.


Why Good Data Collection Matters
Poor data collection can lead to:
- Incorrect conclusions.
- Biased results.
- Poor decisions.
Careful data collection increases:
- Accuracy.
- Reliability.
- Fairness.
- Confidence in the results.
Real-World Applications


Data collection is essential in:
- Scientific research.
- Medicine.
- Education.
- Environmental monitoring.
- Business.
- Government.
- Sports analysis.
- Market research.
Almost every profession relies on collecting accurate data.
Worked Examples
Example 1
Which data collection method would you use to find students' favourite school subject?
Answer:
A survey, because it collects opinions from many people.
Example 2
A scientist changes the amount of fertilizer given to plants and measures their growth.
Which method is being used?
Answer:
An experiment.
Example 3
A researcher counts the number of birds visiting a pond without disturbing them.
Which method is being used?
Answer:
An observation.
Example 4
A school has 1,200 students. A researcher surveys 100 students.
Identify the population and the sample.
Answer:
- Population: All 1,200 students.
- Sample: The 100 students surveyed.
Example 5
Why is random sampling often preferred?
Answer:
Because every member of the population has an equal chance of being selected, reducing bias and making the sample more representative.
Did You Know?
Many national opinion polls survey only a few thousand people, even though millions of people live in the country. When the sample is carefully chosen to represent the population, it can provide remarkably accurate estimates of what the entire population thinks.
Key Terms
| Term | Definition |
|---|---|
| Data Collection | The process of gathering information for a specific purpose. |
| Survey | A method of collecting data by asking questions. |
| Experiment | A method of collecting data by changing one variable and measuring the effect on another. |
| Observation | A method of collecting data by watching and recording without changing the situation. |
| Population | The entire group being studied. |
| Sample | A smaller group selected from the population. |
| Random Sample | A sample in which every member of the population has an equal chance of being selected. |
| Bias | A systematic influence that makes results unfair or unrepresentative. |
| Systematic Sampling | Selecting individuals at regular intervals from a population. |
| Stratified Sampling | Dividing a population into groups and sampling from each group. |
Key Takeaways
- Data can be collected using surveys, experiments, and observations, depending on the question being investigated.
- Each method has its own advantages and limitations.
- A population is the entire group being studied, while a sample is a smaller group selected from that population.
- Choosing an appropriate sampling method helps ensure that results are representative and reliable.
- Collecting and recording data systematically improves accuracy and reduces errors.
- Reliable data is essential for answering questions, solving problems, and making informed decisions in mathematics, science, and everyday life.
3. Organizing Data
Learning outcomes
- I can organize data using tables and charts.
- I can create and interpret frequency tables.
- I can use tally charts to record and summarize data.
- I can identify patterns in organized datasets.
- I can present data clearly and accurately.


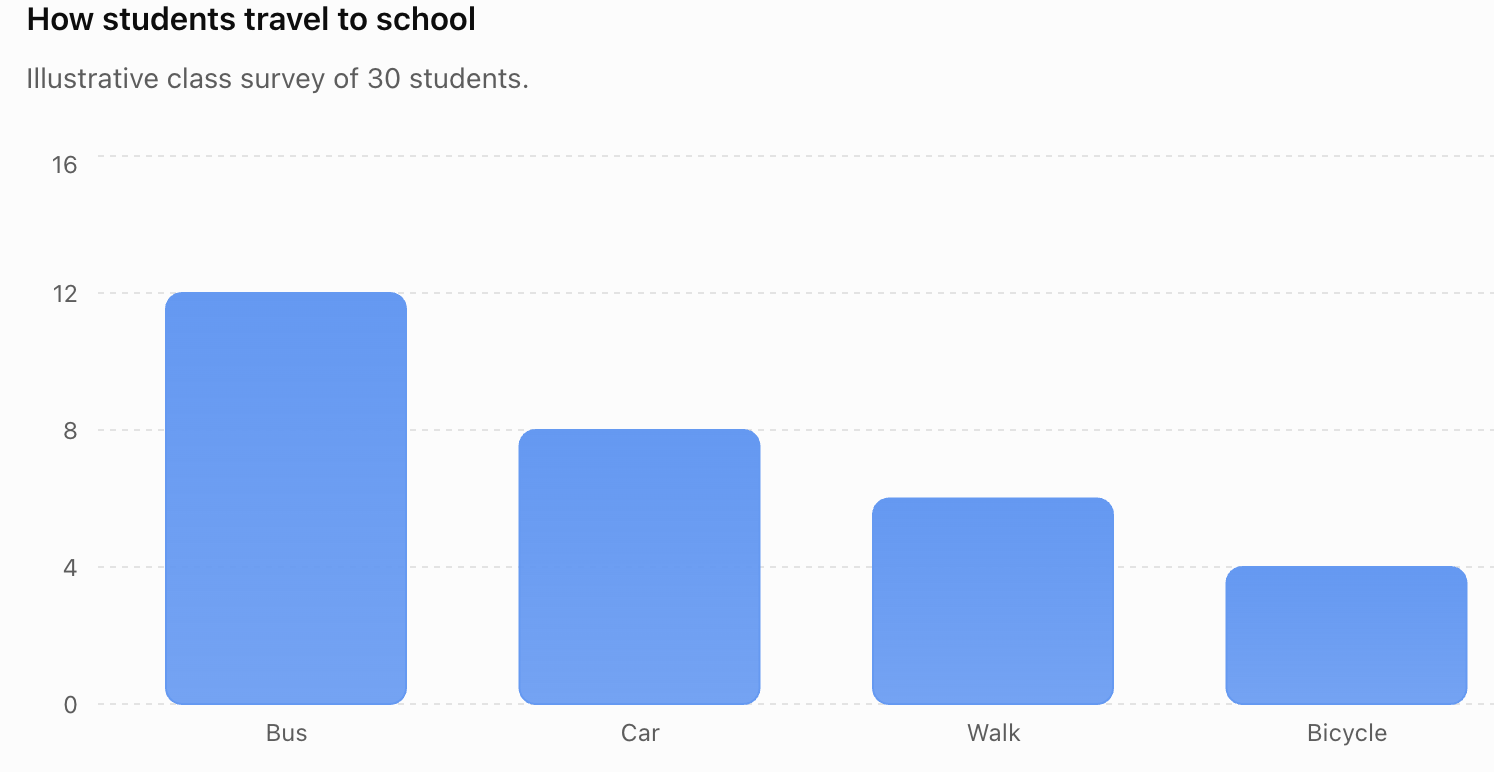


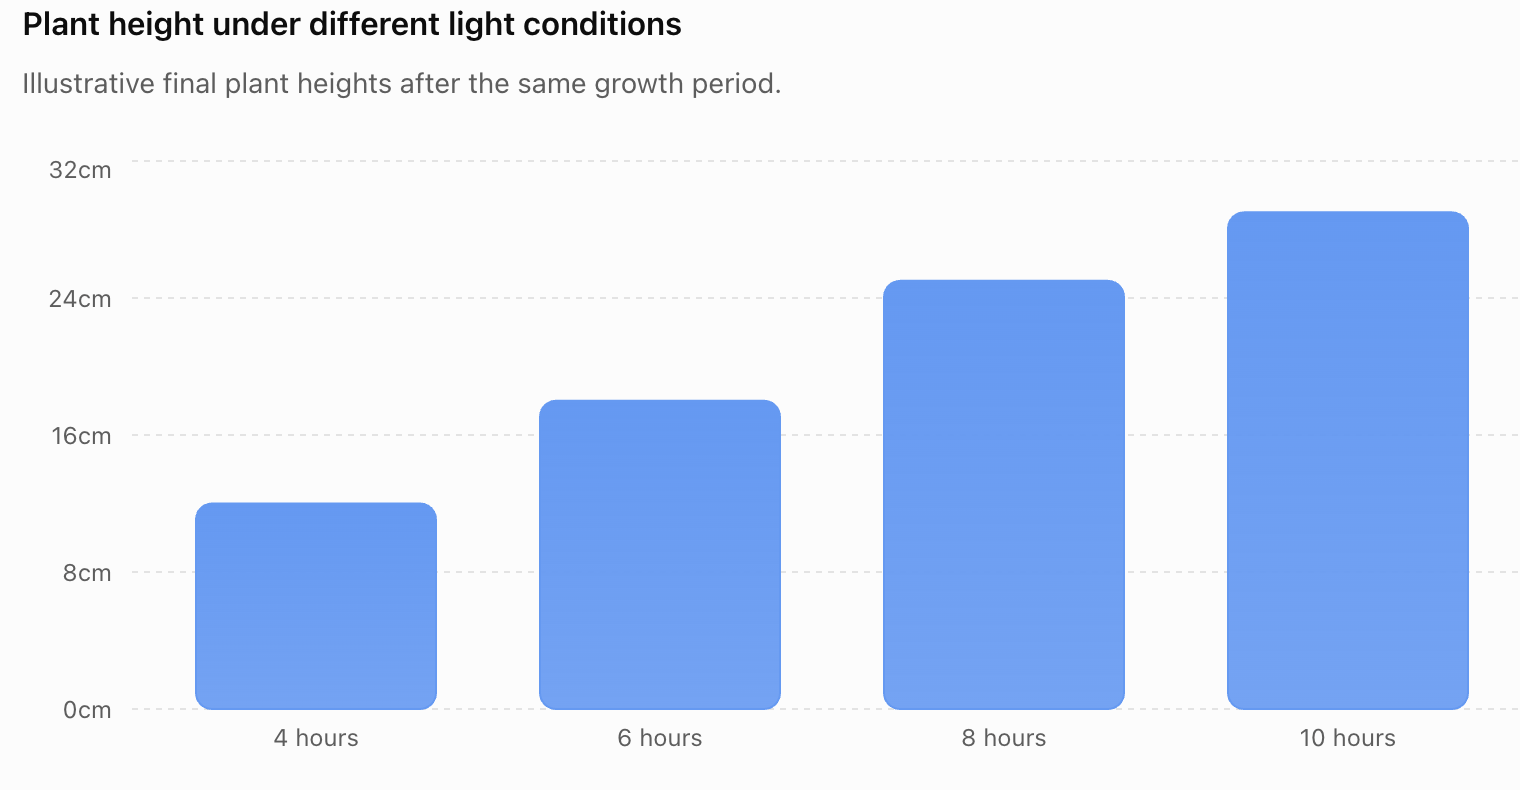
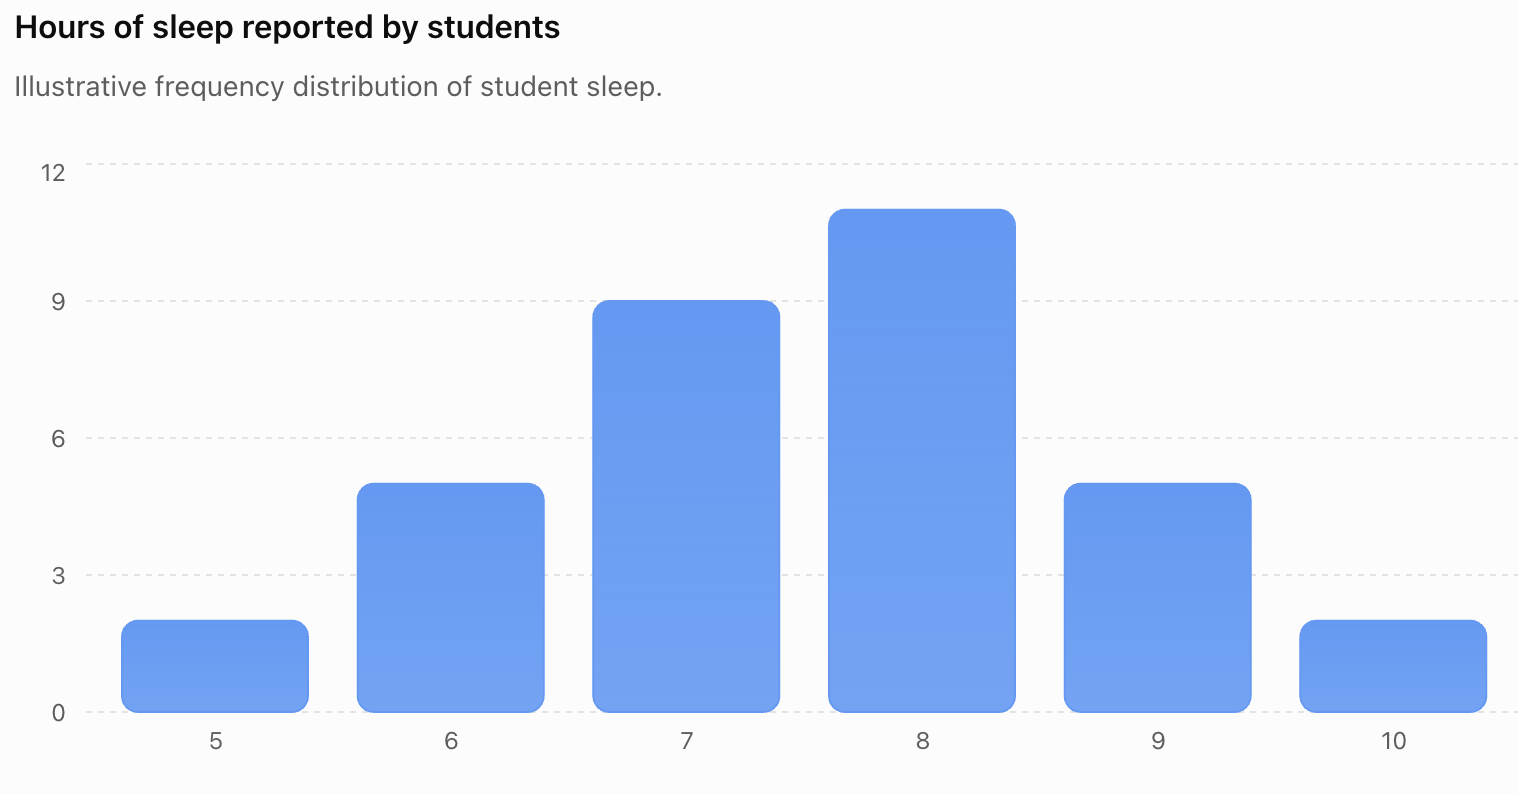


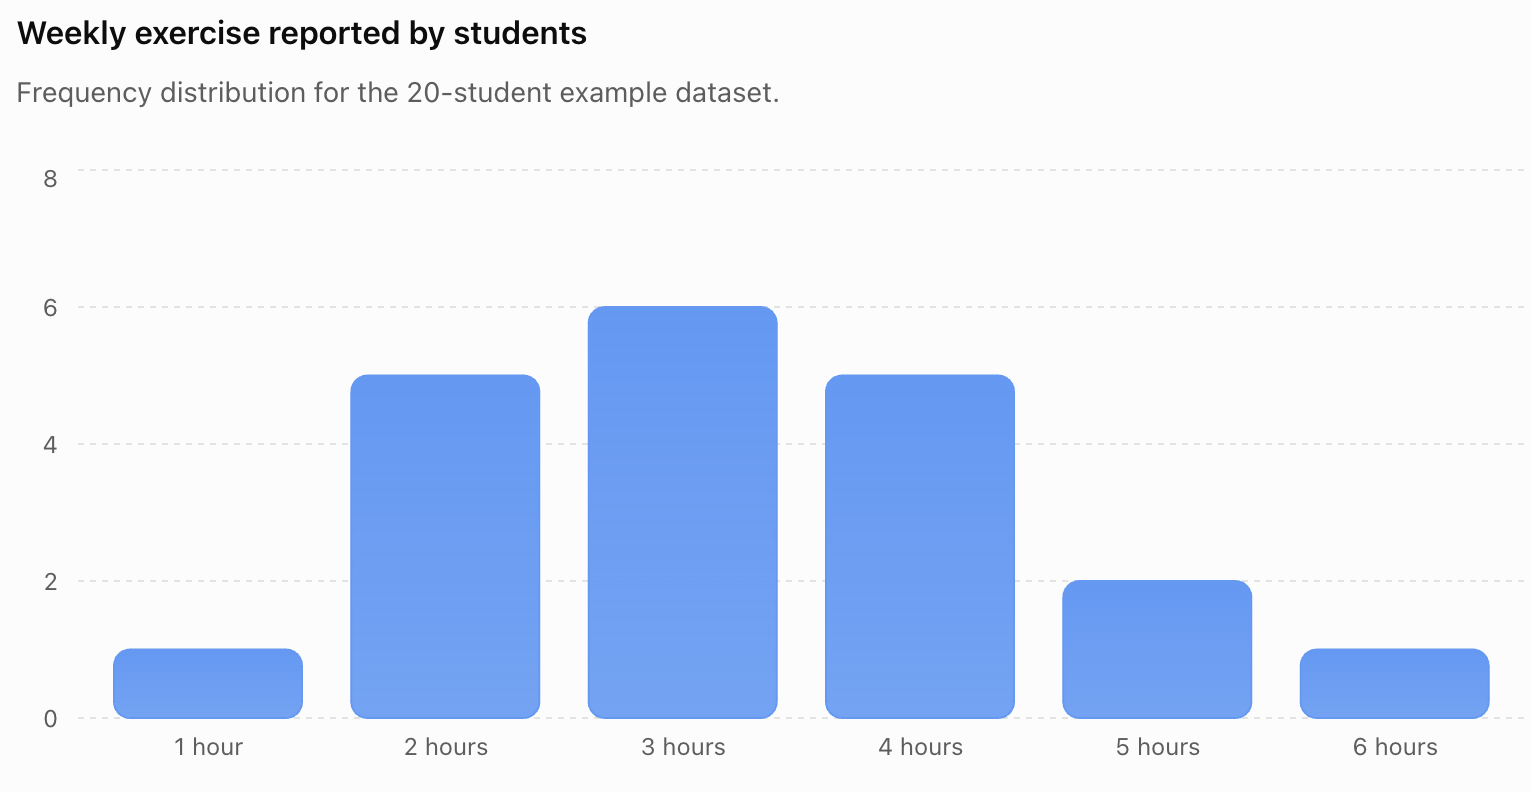
4. Displaying Data
Learning outcomes
- I can construct bar graphs, pictographs, and line plots.
- I can interpret information presented in graphical form.
- I can compare categories using graphical displays.
- I can select appropriate scales and labels for graphs.
- I can communicate information effectively using visual displays.


Why Display Data?
A table organizes information, but sometimes we want to see the information more:
visually.
Suppose a survey asks students to choose their favourite fruit:
| Fruit | Students |
|---|---|
| Apples | 12 |
| Bananas | 8 |
| Oranges | 10 |
| Grapes | 5 |
The table gives us the exact numbers.
A graph makes the comparison easier to see at a:
glance.
Graphical displays allow us to identify:
- largest and smallest categories
- similarities and differences
- patterns
- clusters
- gaps
- unusual values
A well-designed graph turns numerical information into a:
visual message.
From Data to a Display
Creating a graph is not simply drawing bars or plotting points.
You first need to decide:
What kind of data do I have?
What do I want the reader to notice?
Which display communicates the information most clearly?
For this topic, we will focus on three useful displays:
Bar graphs
Pictographs
Line plots
Each represents data in a different way.
Bar Graphs
A bar graph uses rectangular bars to represent numerical values or frequencies.
The length or height of each bar represents the:
value of that category.
Bar graphs are especially useful for comparing:
separate categories.


Example: Favourite School Subjects
Suppose 30 students choose their favourite subject.
| Subject | Students |
|---|---|
| Science | 9 |
| Mathematics | 7 |
| English | 5 |
| Art | 6 |
| Music | 3 |
A bar graph allows us to compare these categories visually.
The tallest bar represents:
Science.
The shortest bar represents:
Music.
The difference between them is:
9 − 3 = 6 students.
Parts of a Good Bar Graph
A good bar graph should normally include:
A Clear Title
The title tells the reader:
what the graph represents.
For example:
Favourite School Subjects
Category Labels
The categories should be clearly identified.
For example:
Science, Mathematics, English, Art, Music
Numerical Axis
The other axis shows the:
frequency or measured value.
Scale
The scale tells us what each interval represents.
Units
If the data involve measurements, the units should be:
clearly stated.
Bars Should Be Separated
In a standard bar graph, the bars normally have:
gaps between them.
Why?
Because each bar represents a separate:
category.
For example:
cats, dogs, fish, birds
are distinct categories.
The gaps help show that the categories are:
separate.
Vertical and Horizontal Bar Graphs
Bar graphs can be drawn:
vertically
or:
horizontally.
Both represent the same type of information.
A horizontal bar graph can be particularly useful when category names are:
long.
For example:
- Walking to school
- Public transportation
- Family vehicle
- School bus
- Bicycle
The choice should make the graph:
easy to read.
Constructing a Bar Graph
Suppose a class records the number of students participating in different activities:
| Activity | Students |
|---|---|
| Football | 12 |
| Basketball | 8 |
| Swimming | 6 |
| Tennis | 4 |
Step 1: Choose the categories
Place:
Football, Basketball, Swimming, and Tennis
along one axis.
Step 2: Determine the largest value
The largest value is:
12.
Step 3: Choose an appropriate scale
A scale from:
0 to 12
using intervals of:
2
would work well.
Step 4: Label the axes
For example:
Activity
and:
Number of Students
Step 5: Add a title
Participation in School Sports
Step 6: Draw the bars
The bar heights should be:
12, 8, 6, and 4.
Choosing a Scale
Choosing the correct scale is an important part of constructing:
any graph.
Suppose your values are:
20, 35, 45, 60, 75.
Using intervals of:
1
would create an unnecessarily large graph.
A scale increasing by:
10
would be more practical.
For example:
0, 10, 20, 30, 40, 50, 60, 70, 80
The goal is to choose a scale that is:
simple, consistent, and appropriate for the data.
Equal Intervals
Graph scales must normally use:
equal intervals.
This scale is correct:
0, 5, 10, 15, 20, 25
Each interval increases by:
5.
This scale is misleading:
0, 5, 10, 20, 25, 50
because the spacing is equal visually but the numerical intervals are:
not equal.
Worked Example 1: Reading a Bar Graph
A school records the number of books borrowed from different sections of its library.
| Section | Books Borrowed |
|---|---|
| Science | 24 |
| History | 15 |
| Fiction | 32 |
| Biography | 12 |
| Art | 17 |
From this information we can determine:
Most popular section: Fiction
Least popular section: Biography
Difference:
32 − 12 = 20 books
Total books borrowed:
24 + 15 + 32 + 12 + 17 = 100 books
A graph can make these comparisons much easier to:
see quickly.
Comparing Categories
One major purpose of bar graphs is to compare:
categories.
Suppose:
Team A = 18 points
Team B = 21 points
Team C = 12 points
Team D = 24 points
We can ask:
Which team scored the most?
Team D
Which team scored the least?
Team C
How many more points did Team D score than Team C?
24 − 12 = 12
Graphs allow us to combine:
visual interpretation and numerical reasoning.
Pictographs
A pictograph uses pictures or symbols to represent:
data.


For example:
Favourite Pets
| Pet | Pictograph |
|---|---|
| Dog | 🐾 🐾 🐾 🐾 |
| Cat | 🐾 🐾 🐾 |
| Fish | 🐾 🐾 |
| Bird | 🐾 |
But the pictures do not necessarily represent:
one item each.
That is why every pictograph needs a:
key.
The Pictograph Key
Suppose the key says:
🐾 = 2 students
Then:
🐾 🐾 🐾 🐾
represents:
4 × 2 = 8 students.
The symbol itself is not the value.
Its meaning comes from the:
key.
This is one of the most important rules when reading pictographs.
Worked Example 2: Reading a Pictograph
Suppose a pictograph shows books read by four students.
Key: 📘 = 3 books
Anna: 📘 📘 📘
Ben: 📘 📘
Carlos: 📘 📘 📘 📘
Dana: 📘
Therefore:
Anna:
3 × 3 = 9 books
Ben:
2 × 3 = 6 books
Carlos:
4 × 3 = 12 books
Dana:
1 × 3 = 3 books
Total:
9 + 6 + 12 + 3 = 30 books.
Partial Symbols
Sometimes a pictograph uses part of a symbol.
Suppose:
★ = 4 students
Then:
½ ★ = 2 students.
If a category contains:
★★½
the value is:
4 + 4 + 2 = 10 students.
Partial symbols allow pictographs to represent values that are not exact multiples of the:
full symbol.
Choosing a Good Pictograph Key
Suppose the values are:
10, 20, 30, 40.
A sensible key might be:
● = 10 items.
But if the values are:
100, 200, 300, 400,
using:
● = 1 item
would require hundreds of symbols.
Instead, we might use:
● = 100 items.
A good key makes the pictograph:
simple and readable.
Constructing a Pictograph
Suppose a shop sells:
| Day | Ice Creams Sold |
|---|---|
| Monday | 20 |
| Tuesday | 30 |
| Wednesday | 15 |
| Thursday | 25 |
Choose:
🍦 = 5 ice creams
Then:
Monday:
🍦 🍦 🍦 🍦
Tuesday:
🍦 🍦 🍦 🍦 🍦 🍦
Wednesday:
🍦 🍦 🍦
Thursday:
🍦 🍦 🍦 🍦 🍦
Always include the key:
🍦 = 5 ice creams.
Without the key, the pictograph is:
incomplete.
Advantages of Pictographs
Pictographs can be:
- visually appealing
- easy to understand
- useful for simple comparisons
- memorable
- effective for small datasets
They are especially useful when communicating information to a:
general audience.
Limitations of Pictographs
Pictographs become less useful when:
- there are many categories
- values are very large
- precise comparisons are required
- many partial symbols are needed
- the key is complicated
For more detailed numerical information, a:
bar graph
may be more effective.
Line Plots
A line plot displays numerical data along a:
number line.
Each observation is usually represented by a mark such as:
X
above its value.
Line plots are sometimes called:
dot plots
when dots are used instead of X marks.


Line Plots Are Not Line Graphs
These terms are easy to confuse.
A line plot displays individual data values along a:
number line.
A line graph usually shows how a quantity changes across an ordered variable, often:
time.
They are different graphical displays.
For this topic, we are focusing on:
line plots.
Example of a Line Plot
Suppose ten students record the number of books they read:
1, 2, 2, 3, 3, 3, 4, 4, 5, 3
The frequencies are:
| Books | Frequency |
|---|---|
| 1 | 1 |
| 2 | 2 |
| 3 | 4 |
| 4 | 2 |
| 5 | 1 |
The line plot would contain:
            X
            X
      X     X     X
X     X     X     X     X
--------------------------------
1     2     3     4     5
       Number of Books
Each X represents:
one observation.
Reading a Line Plot
From the previous plot:
The most common value is:
3 books.
The smallest value is:
1 book.
The largest value is:
5 books.
The number of students who read 4 books is:
2.
The total number of observations is found by counting all the X marks:
10.
Constructing a Line Plot
Consider:
2, 3, 4, 3, 5, 4, 3, 2, 4, 3
Step 1: Find the smallest value
2
Step 2: Find the largest value
5
Step 3: Draw an appropriate number line
2 — 3 — 4 — 5
Step 4: Add one X for each observation
The frequencies are:
2 → 2
3 → 4
4 → 3
5 → 1
Step 5: Add a clear title and label
The reader should know:
what the numbers represent.
Why Line Plots Are Useful
Unlike a bar graph showing broad categories, a line plot allows us to see the:
distribution of individual numerical values.
We can quickly identify:
- common values
- clusters
- gaps
- extremes
- range
- unusual observations
This makes line plots particularly useful for:
small numerical datasets.
Clusters
A cluster is a group of data values concentrated in a particular region.
Suppose most observations fall between:
6 and 8.
We might say:
The data cluster between 6 and 8.
Clusters help us describe where observations are:
concentrated.
Gaps
A gap is a region of the scale containing no observations.
For example, if values occur at:
2, 3, 4, 7, 8
there is a gap between:
4 and 7.
Gaps may reveal interesting features of a:
dataset.
Outliers
An outlier is a value that is unusually far from most of the other observations.
Suppose the data are:
10, 11, 11, 12, 12, 13, 12, 11, 35
The value:
35
is far from the rest of the data.
It may be an:
outlier.
An outlier is not automatically an error.
It may represent a:
real but unusual observation.
Range
The range measures the spread from the smallest to the largest value.
Range = maximum − minimum
For:
3, 4, 5, 5, 6, 8, 9
the range is:
9 − 3 = 6.
A line plot makes the minimum and maximum easy to:
identify visually.
Bar Graph vs Pictograph vs Line Plot
| Display | Best Used For | Main Feature |
|---|---|---|
| Bar graph | Comparing categories | Bars represent values |
| Pictograph | Simple visual comparisons | Symbols represent quantities |
| Line plot | Small numerical datasets | Marks show individual observations |
Choosing the correct graph depends on:
the type of data and the purpose of the display.
Which Graph Should I Choose?
Suppose you want to compare the favourite sports of students.
Use a:
bar graph or pictograph.
Suppose you want to display the heights of 20 plants.
A:
line plot
may be useful if the measurements use a manageable set of values.
Suppose you want to communicate a simple survey to young students.
A:
pictograph
might be especially effective.
The graph should fit:
the data and the audience.
Labels Matter
Consider a graph with bars of heights:
5, 10, 15, 20.
Without labels, we do not know whether the graph represents:
- kilograms
- students
- dollars
- centimetres
- animals
- test scores
Numbers without context communicate:
very little.
A good graph should answer:
What is being measured?
What do the categories represent?
What units are being used?
Titles Matter
Compare:
Graph 1
with:
Average Daily Temperature in June
The second title immediately tells the reader:
what the graph represents.
Titles should be:
brief, specific, and informative.
Scales Matter
Suppose a graph displays:
12, 14, 16, 18, 20.
A scale of:
0, 100, 200, 300
would make the bars appear almost identical and waste most of the graph.
A smaller scale would show the values more:
clearly.
The scale should match the:
range of the data.
Zero and Truncated Axes
Bar graphs often begin at:
zero.
This is important because bar length represents:
magnitude.
Suppose:
Company A = 98
Company B = 100
If the vertical axis begins at 97, the difference may look:
very large.
In reality, the numerical difference is only:
2.
Always inspect the graph's:
scale.
Misleading Graphs
A graph can contain correct numbers and still create a misleading:
visual impression.
Common problems include:
- unequal scale intervals
- missing units
- truncated axes
- exaggerated pictures
- unclear keys
- distorted shapes
- missing labels
Good graphical communication requires:
accuracy as well as appearance.


Misleading Pictographs
Suppose:
🚗 = 10 cars.
Town A has 20 cars, so it receives:
🚗 🚗
Town B has 40 cars, so it should receive:
🚗 🚗 🚗 🚗
Instead of adding symbols, someone might make Town B's car picture:
twice as tall and twice as wide.
That makes its visual area approximately:
four times as large.
The picture can therefore exaggerate the difference.
Pictographs should normally use symbols of:
consistent size.
Interpreting Graphs
When you see a graph, do not immediately look at the tallest bar or largest symbol.
First ask:
What is the title?
What do the axes represent?
What is the scale?
What are the units?
Is there a key?
Then examine the:
data.
This prevents many interpretation errors.
Comparing Categories
Suppose a bar graph shows:
| Animal | Number Observed |
|---|---|
| Birds | 18 |
| Butterflies | 12 |
| Bees | 15 |
| Beetles | 9 |
We can make comparisons such as:
Birds were observed most frequently.
Beetles were observed least frequently.
There were:
18 − 9 = 9
more bird observations than beetle observations.
There were:
15 − 12 = 3
more bee observations than butterfly observations.
Difference vs Total
Graphs often require more than simply reading one value.
Suppose:
Red = 12
Blue = 8
The difference is:
12 − 8 = 4.
The combined total is:
12 + 8 = 20.
Be careful to determine whether the question asks for:
difference or total.
Worked Example 3: Science Data
Students record the number of insects found in four habitats.
| Habitat | Insects |
|---|---|
| Grass | 18 |
| Soil | 12 |
| Under Logs | 25 |
| Flowers | 20 |
A bar graph would be appropriate because the habitats are:
separate categories.
The largest number was found:
under logs.
The smallest number was found in:
soil.
Difference:
25 − 12 = 13 insects.
Graphs in Science
Graphs are essential tools in:
science.
Scientists use graphical displays to communicate:
- experimental results
- population counts
- environmental observations
- measurements
- comparisons
- distributions
A graph allows a reader to recognize patterns much faster than reading a long:
list of numbers.
Graphs in Everyday Life
Graphical displays appear in:
- news reports
- sports statistics
- weather forecasts
- business reports
- health information
- advertisements
- school reports
- transportation information
- social media
Understanding graphs is therefore an important part of:
everyday numerical literacy.


Communicating Information Visually
A successful graph should allow someone unfamiliar with the dataset to understand:
what happened.
The reader should not need the creator standing beside the graph to:
explain it.
A strong visual display is:
self-explanatory.
The CLEAR Graph Check
Before finishing a graph, check that it is:
C — Correct
Are all values plotted accurately?
L — Labelled
Are the axes and categories labelled?
E — Equal
Are scale intervals equal?
A — Appropriate
Is this graph suitable for the data?
R — Readable
Can someone understand it easily?
This provides a useful checklist for creating:
effective graphs.
Worked Example 4: Choosing the Display
Situation A
A class wants to compare how many students prefer:
pizza, noodles, burgers, or salad.
Best choices:
bar graph or pictograph.
Why?
The data consist of:
categories.
Situation B
A teacher records these quiz scores:
6, 7, 8, 8, 8, 9, 9, 10, 7, 8, 9, 6
A useful choice is:
line plot.
Why?
The data consist of repeated:
numerical values.
Situation C
A children's club wants an attractive display showing the number of animals seen during a nature walk.
A useful choice could be:
pictograph.
Why?
The symbols provide an:
easy visual comparison.
Worked Example 5: From Raw Data to Line Plot
Suppose students measure the lengths of 15 leaves to the nearest centimetre:
5, 6, 7, 6, 8, 7, 7, 9, 6, 7, 8, 5, 7, 6, 8
First organize the frequencies:
| Length (cm) | Frequency |
|---|---|
| 5 | 2 |
| 6 | 4 |
| 7 | 5 |
| 8 | 3 |
| 9 | 1 |
The line plot would contain:
            X
      X     X
      X     X     X
X     X     X     X
X     X     X     X     X
--------------------------------
5     6     7     8     9
        Leaf Length (cm)
The most common length is:
7 cm.
The range is:
9 − 5 = 4 cm.
Most leaves are clustered between:
6 cm and 8 cm.
From Table to Graph
A useful data workflow is:
Collect data
↓
Organize data
↓
Create a table
↓
Choose an appropriate graph
↓
Select a scale
↓
Add labels and units
↓
Plot accurately
↓
Interpret the display
↓
Communicate the pattern
The graph is therefore part of a larger process of:
working with data.
Digital Graphs
Graphs can be created using spreadsheet and data-analysis software.
Digital tools can quickly:
- create bars
- calculate scales
- add labels
- change graph types
- organize large datasets
However, the computer does not automatically know which graph is:
most appropriate.
The person analyzing the data must still make good decisions about:
representation and interpretation.
Check Your Understanding
1. What is the main purpose of a bar graph?
2. Why are there usually gaps between bars?
3. Name four features that should appear on a well-designed bar graph.
4. Why should scale intervals be equal?
5. When might a horizontal bar graph be useful?
6. What is a pictograph?
7. Why must a pictograph include a key?
8. If ★ = 5 students, what does ★★★ represent?
9. If ● = 8 items, what does half a ● represent?
10. Give one advantage and one limitation of pictographs.
11. What is a line plot?
12. Explain the difference between a line plot and a line graph.
13. What does each X usually represent on a line plot?
14. What is a cluster?
15. What is a gap?
16. What is an outlier?
17. Calculate the range of:
4, 5, 5, 7, 8, 10
18. Which display would you choose to compare favourite school subjects? Explain your choice.
19. Which display would you choose for a small dataset of repeated numerical measurements? Explain your choice.
20. Explain two ways that a graph could mislead its audience.
Key Terms
- Graphical display: Visual representation of data.
- Bar graph: Graph using separated bars to compare categories or discrete values.
- Bar: Rectangular shape whose length or height represents a numerical value.
- Category: Group used to classify data.
- Axis: Reference line used to organize values or categories on a graph.
- Scale: Numerical intervals used along an axis.
- Interval: Difference between consecutive values on a scale.
- Label: Text identifying an axis, category, or quantity.
- Title: Description identifying what a graph represents.
- Pictograph: Graph using pictures or symbols to represent quantities.
- Key: Explanation of the numerical value represented by a symbol.
- Partial symbol: Fraction of a pictograph symbol representing part of its full value.
- Line plot: Graph showing individual numerical observations as marks above a number line.
- Dot plot: Line-plot style display using dots to represent observations.
- Line graph: Graph showing changes across an ordered variable, often time.
- Frequency: Number of times a value or category occurs.
- Cluster: Region where many data values are concentrated.
- Gap: Region containing no observations.
- Outlier: Observation unusually distant from most other values.
- Range: Difference between the maximum and minimum values.
- Truncated axis: Axis that begins above zero or omits part of the numerical range.
- Visual representation: Method of communicating information using graphical features.
Key Takeaways
- Graphs transform numerical data into visual information.
- Bar graphs, pictographs, and line plots serve different purposes.
- Bar graphs are particularly useful for comparing categories.
- Bar height or length represents the numerical value of a category.
- Bars representing separate categories normally have gaps between them.
- Bar graphs may be vertical or horizontal.
- Every graph should have a clear and informative title.
- Axes and categories should be clearly labelled.
- Measurement units should be included where appropriate.
- Graph scales should use equal intervals.
- The scale should suit the range and size of the data.
- Pictographs use symbols or pictures to represent quantities.
- Every pictograph requires a key.
- One symbol may represent more than one observation.
- Partial symbols can represent fractions of the value given in the key.
- Pictographs are useful for simple and visually engaging comparisons.
- Line plots display individual numerical observations along a number line.
- Line plots and line graphs are different types of displays.
- Line plots are useful for identifying clusters, gaps, extremes, and repeated values.
- The range is calculated using maximum − minimum.
- Different displays are appropriate for different types of data.
- Bar graphs and pictographs work well for categorical data.
- Line plots work well for relatively small sets of numerical data.
- Graphs can be misleading if scales, symbols, axes, or labels are poorly designed.
- Reading the title, scale, units, labels, and key should come before interpreting the data.
- Good graphical displays are correct, labelled, appropriately scaled, suitable, and readable.
- Effective graphs communicate information accurately without requiring additional explanation.
- Choosing the correct graph is part of analyzing and communicating data, not merely drawing it.
5. Evaluating Data Collection
Learning outcomes
- I can identify sources of bias in data collection.
- I can explain how sample size affects reliability.
- I can distinguish between reliable and unreliable data.
- I can evaluate the validity of a data collection method.
- I can suggest improvements to data collection procedures.


