Statistical Inference
5. Interpreting Statistical Studies
Learning outcomes
- I can critically evaluate statistical investigations.
- I can identify misleading conclusions.
- I can distinguish correlation from causation.
- I can recognise limitations of statistical studies.
- I can evaluate evidence using statistics.
Introduction
Every day, we encounter claims based on statistics. News articles report that certain foods improve health, advertisements claim that products are more effective than their competitors, and researchers publish studies suggesting relationships between different factors.
Consider the following headlines:
-
"Students who eat breakfast achieve higher examination scores."
-
"People who exercise regularly live longer."
-
"A new teaching method improves mathematics performance by 25%."
-
"Using social media causes students to perform poorly at school."
-
"A survey shows that 90% of people prefer our product."
These statements may sound convincing, especially when they include numbers, percentages, or references to scientific research.
But how can we determine whether the conclusions are justified?
For example, if students who eat breakfast tend to achieve higher examination scores, does this prove that eating breakfast causes better academic performance? Could other factors, such as sleep, family circumstances, or study habits, explain the relationship?
Interpreting statistical studies means examining how data were collected, how they were analysed, and whether the conclusions are supported by reliable evidence.
A statistically literate person does not simply accept a conclusion because it contains numbers. Instead, they ask critical questions about sampling, bias, study design, correlation, causation, uncertainty, and the limitations of the investigation.
These skills are essential for making informed decisions in science, medicine, education, economics, business, and everyday life.
Understanding Statistical Investigations
A statistical investigation is a systematic process used to collect, analyse, interpret, and communicate data in order to answer a research question.
A well-designed investigation typically follows several stages.
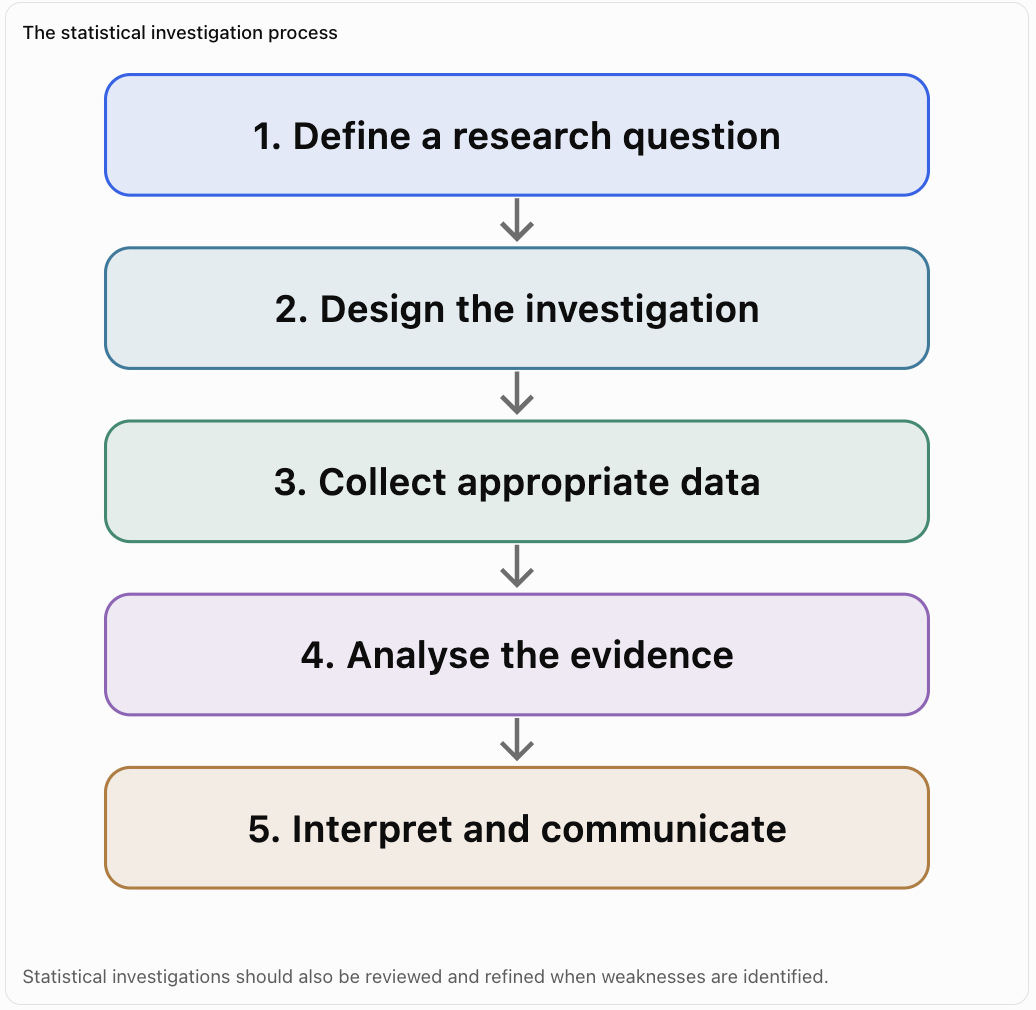
Stage 1: Define the Research Question
A research question should be specific and measurable.
Weak question:
"Does technology help students?"
Improved question:
"Do Grade 9 students who use an online revision program for four weeks achieve higher average test scores than students using printed revision materials?"
The improved question identifies the population, comparison, outcome, and time period.
Stage 2: Design the Investigation
Researchers decide:
-
Who will participate?
-
How will participants be selected?
-
What variables will be measured?
-
Will the study be observational or experimental?
-
How will bias and confounding variables be addressed?
-
What statistical methods will be used?
Stage 3: Collect Data
Researchers gather information using methods such as surveys, experiments, observations, or existing records.
Data collection should be accurate, consistent, ethical, and appropriate for the research question.
Stage 4: Analyse the Data
Researchers may calculate means, proportions, standard deviations, correlations, confidence intervals, or statistical test results.
Graphs can help identify patterns and unusual observations.
Stage 5: Interpret and Communicate Findings
Researchers explain what the results suggest, assess uncertainty, and identify limitations.
A strong conclusion distinguishes what the evidence actually establishes from what remains uncertain.
Evaluating the Quality of a Statistical Study
Not all statistical investigations provide equally reliable evidence.
Before accepting a conclusion, we should examine the quality of the study.
The Research Question
A good investigation begins with a clear research question.
For example:
"Are students happier when using technology?"
This is vague because happiness and technology use have not been clearly defined.
A more precise question is:
"Is daily recreational screen time associated with self-reported wellbeing scores among students aged 13–16?"
This identifies measurable variables and a defined population.
The Population and Sample
The population is the entire group that researchers want to investigate.
The sample is the subset from which data are collected.
Suppose a researcher wants to investigate the study habits of all secondary school students in Singapore.
If the researcher surveys only students from one advanced mathematics class, the sample may not represent the intended population.
This creates a risk of selection bias.
Sample Size
Larger samples generally provide more precise estimates, provided that the sampling method is appropriate.
However, a large sample does not automatically guarantee reliable conclusions.
A survey of 10,000 people selected using a biased method may be less representative than a carefully selected random sample of 500 people.
Measurement Quality
Researchers must ensure that variables are measured consistently and accurately.
For example, asking students to estimate how many hours they studied last month may produce inaccurate responses because students may not remember their study time.
Using a daily study log might produce more reliable measurements, although self-reporting can still introduce errors.
Recognising Bias in Statistical Studies
Bias is a systematic error that causes a statistical estimate or conclusion to deviate from the quantity it is intended to represent.
Bias can occur during sampling, measurement, analysis, or reporting.
Selection Bias
Selection bias occurs when the process of selecting participants produces a sample that differs systematically from the target population.
Example
A school surveys only students attending an optional after-school mathematics club to determine whether all students enjoy mathematics.
Students attending the club may be more interested in mathematics than the average student.
The results may therefore overestimate enjoyment.
Voluntary Response Bias
Voluntary response bias occurs when people choose whether to participate and those who respond differ systematically from those who do not.
Example
A website asks visitors to complete an optional survey about customer satisfaction.
People with very positive or very negative experiences may be more likely to respond.
The results may not represent all customers.
Nonresponse Bias
Nonresponse bias occurs when selected participants do not respond and their characteristics differ from those who participate.
Example
A survey about working hours receives responses mainly from employees who have flexible schedules.
Employees working longer or irregular hours may be underrepresented.
Response Bias
Response bias occurs when answers are systematically influenced by factors such as question wording, social expectations, or inaccurate recall.
Consider two questions:
"Do you agree that responsible students should complete homework every day?"
"How many days per week do you believe students should complete homework?"
The first question contains leading language that may influence responses.
The second is more neutral.
Confirmation Bias
Confirmation bias occurs when researchers or readers give greater attention to evidence supporting their existing beliefs.
For example, someone who believes that online learning is ineffective might focus on studies reporting poor results while ignoring studies showing benefits.
Publication Bias
Publication bias occurs when studies with statistically significant or striking findings are more likely to be published or promoted than studies with inconclusive findings.
This can distort the overall impression of the available evidence.
Correlation and Causation
One of the most important skills in interpreting statistical studies is distinguishing between correlation and causation.
What Is Correlation?
Correlation describes a statistical relationship between two variables.
When two variables are correlated, their values tend to vary together in a systematic way.
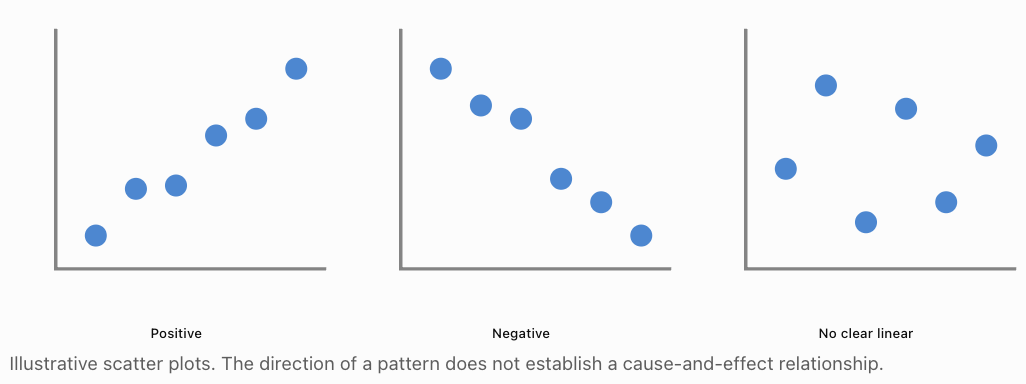
Correlation may be positive, negative, or approximately zero.
Positive Correlation
A positive correlation occurs when larger values of one variable tend to be associated with larger values of another.
Examples include:
-
Height and mass among growing children.
-
Hours studied and examination performance.
-
Outdoor temperature and ice cream sales.
Negative Correlation
A negative correlation occurs when larger values of one variable tend to be associated with smaller values of another.
Examples include:
-
Distance travelled and fuel remaining in a vehicle.
-
Price and quantity demanded under some market conditions.
-
Time spent practising a skill and the number of errors made.
No Linear Correlation
When there is no linear correlation, the variables do not display a clear straight-line relationship.
However, they may still have a nonlinear relationship.
Three possible correlation patterns
The Correlation Coefficient
The Pearson correlation coefficient, represented by r, measures the direction and strength of a linear relationship.
Its value lies between −1 and +1.
|
Value of r |
Interpretation |
|---|---|
|
+1 |
Perfect positive linear correlation |
|
+0.8 |
Strong positive linear correlation |
|
+0.3 |
Weak positive linear correlation |
|
0 |
No linear correlation |
|
−0.3 |
Weak negative linear correlation |
|
−0.8 |
Strong negative linear correlation |
|
−1 |
Perfect negative linear correlation |
These descriptions are approximate and depend on the research context.
The coefficient can be calculated using:
r = Σ[(x − x̄)(y − ȳ)] / √[Σ(x − x̄)² × Σ(y − ȳ)²]
For example, if a study finds:
r = 0.85
between study hours and examination scores, this indicates a strong positive linear relationship in the observed data.
It does not prove that increasing study hours causes higher scores.
What Is Causation?
Causation occurs when a change in one factor produces a change in another.
For example, in a controlled physical experiment, increasing the applied net force on an object of constant mass causes greater acceleration, according to Newton's Second Law.
In statistical investigations involving human behaviour, identifying causation is often more difficult because many variables may influence the outcome.
Why Correlation Does Not Prove Causation
Consider this example:
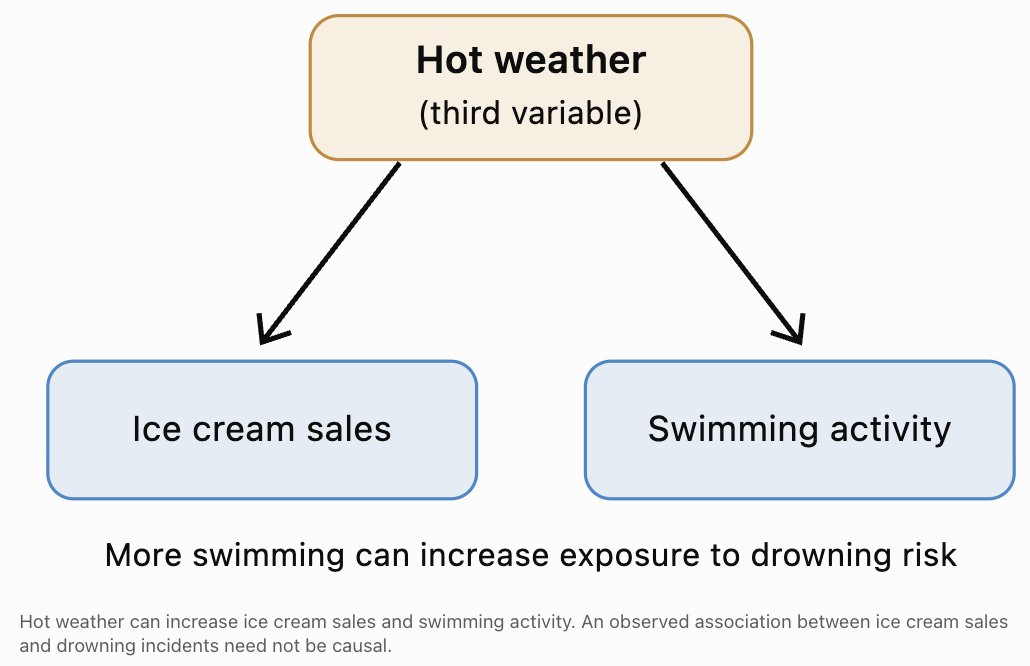
A study finds that ice cream sales and drowning incidents both increase during summer.
Does buying ice cream cause drowning?
No.
A third variable, hot weather, can influence both.
A confounding variable can create an association
Other Explanations for Correlation
Reverse causation
Researchers may incorrectly assume the direction of cause and effect.
For example, a study might find that students receiving extra tutoring have lower examination scores.
It would be misleading to conclude that tutoring causes poor performance.
Students who are already struggling may be more likely to receive tutoring.
Coincidence
Two variables may appear correlated simply by chance, especially when many possible relationships are examined.
Confounding variables
Other factors may influence both variables and create or distort the observed relationship.
Selection effects
The way participants are selected can create an apparent relationship that does not exist in the wider population.
Observational Studies and Experiments
The type of investigation strongly affects the conclusions researchers can draw.
Observational Studies
In an observational study, researchers measure variables without assigning participants to treatments or deliberately manipulating the exposure of interest.
For example, researchers might compare examination results among students who independently choose different revision methods.
Observational studies can identify associations and provide valuable evidence.
However, differences between groups may be caused by confounding variables.
Controlled Experiments
In a controlled experiment, researchers deliberately assign treatments or conditions and measure the resulting outcomes.
A randomized controlled experiment is particularly useful for investigating causation.
For example, researchers might randomly assign students to:
-
Group A: Traditional revision materials.
-
Group B: Interactive revision materials.
Both groups complete the same assessment after four weeks.
Random assignment helps balance both known and unknown confounding variables across groups, especially in sufficiently large studies.
Random Sampling Versus Random Assignment
These concepts serve different purposes.
|
Random sampling |
Random assignment |
|---|---|
|
Selects participants from a population |
Allocates participants to experimental groups |
|
Helps improve population representativeness |
Helps reduce confounding between treatment groups |
|
Supports generalization |
Supports causal inference |
|
Does not automatically establish causation |
Does not automatically ensure population representativeness |
An experiment can have strong internal validity but limited generalizability if its participants are not representative of the wider population.
Identifying Misleading Statistical Conclusions
Statistical claims can be misleading even when the underlying numbers are mathematically correct.
Misleading Percentages
Suppose an advertisement states:
"Our program increased student success by 100%!"
This sounds impressive.
However, imagine the pass rate increased from 2% to 4%.
Relative increase:
(4 − 2) / 2 × 100% = 100%
Absolute increase:
4% − 2% = 2 percentage points
The statement is mathematically correct but omits important context.
Always ask whether a reported percentage is an absolute change or a relative change.
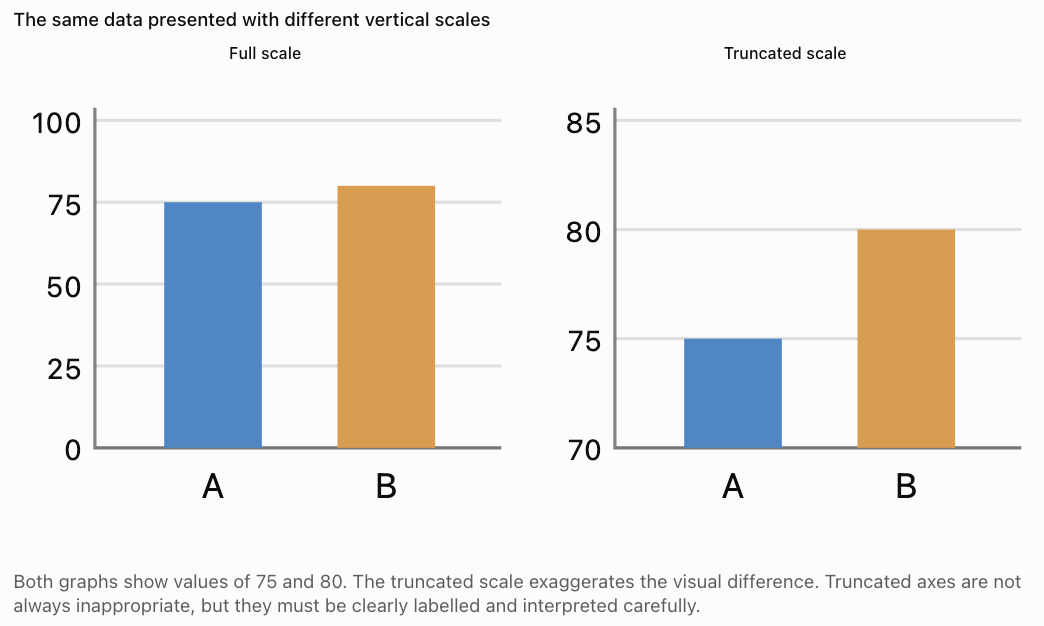
Misleading Graph Scales
A graph with a truncated vertical axis can make a small difference appear dramatic.
Cherry-Picking Data
Cherry-picking occurs when someone selects only data that support a desired conclusion.
For example, a company might report sales growth during its best three months while ignoring the rest of the year.
A fair analysis should consider the relevant full dataset and explain any exclusions.
Small or Unrepresentative Samples
Suppose a company claims:
"Nine out of ten customers recommend our product."
If only ten customers were surveyed, the estimate is highly uncertain.
If those customers were selected from a group of enthusiastic supporters, the result may also be biased.
Confusing Statistical Significance With Importance
A study may report a statistically significant improvement of 0.2 marks on a 100-mark examination.
This result could be statistically detectable but educationally unimportant.
We must consider the magnitude and consequences of the effect.
Evaluating Evidence Using Descriptive Statistics
Descriptive statistics help summarize the observations in a study.
However, different statistics reveal different aspects of the data.
Worked Example: Comparing Two Teaching Programs
Suppose researchers collect the following results:
|
Statistic |
Program A |
Program B |
|---|---|---|
|
Students |
50 |
50 |
|
Mean score |
72 |
78 |
|
Median score |
74 |
79 |
|
Standard deviation |
8 |
15 |
Step 1: Compare the means
78 − 72 = 6
Program B has a sample mean 6 marks higher.
Step 2: Compare the medians
79 − 74 = 5
Program B also has a higher median.
Step 3: Compare variation
Program A: SD = 8
Program B: SD = 15
Program B has substantially greater variability.
Step 4: Interpret the findings
Program B has higher typical scores in this sample, but its results are less consistent.
Some students may perform very well under Program B, while others may perform poorly.
Step 5: Evaluate limitations
Before concluding that Program B is more effective, we should ask whether students were randomly assigned, whether the assessments were comparable, and whether other differences between groups could explain the results.
Evaluating Evidence Using Confidence Intervals
A confidence interval provides an estimate of uncertainty around a population parameter.
Suppose a study estimates that a new teaching program improves scores by 5 marks.
Its 95% confidence interval for the mean improvement relative to a comparison program is:
(1, 9)
This suggests that the true mean difference is plausibly between 1 and 9 marks, assuming the statistical model is appropriate.
Because the interval does not contain zero, it provides evidence of a positive difference under a corresponding two-sided 5% test.
Now consider a second study:
Estimated difference = 5 marks
95% confidence interval:
(−3, 13)
Although both studies estimate the same difference, the second interval is much wider and includes zero.
The second study provides less precise evidence about the population difference.
Confidence Interval Width
Narrow confidence intervals generally indicate greater precision.
Wide confidence intervals indicate greater uncertainty.
Confidence interval width depends on factors including sample size, variability, confidence level, and the estimation method.
Evaluating Evidence Using Hypothesis Tests
A hypothesis test evaluates how compatible observed data are with a specified null hypothesis.
Worked Example: A New Learning Program
A study compares two teaching programs.
The null hypothesis is:
H₀: μ₁ = μ₂
The alternative hypothesis is:
H₁: μ₁ ≠ μ₂
The test produces:
p = 0.03
At a significance level of 0.05:
0.03 < 0.05
Therefore, the researchers reject the null hypothesis.
There is statistically significant evidence of a difference between the population means.
However, the p-value does not tell us:
-
How large the difference is.
-
Whether the difference is educationally important.
-
Whether the study was biased.
-
Whether one teaching method caused the difference.
-
The probability that the null hypothesis is true.
A p-value should be interpreted alongside the effect size, confidence interval, research design, and data quality.
Understanding Study Limitations
Every statistical investigation has limitations.
Recognising these limitations is essential for evaluating the strength of its conclusions.
Sampling Limitations
A sample may not represent the intended population.
For example, results from students at one school may not generalize to students across an entire country.
Measurement Limitations
Measurements may be inaccurate or inconsistent.
Self-reported exercise time, for example, may differ from actual exercise time.
Confounding Variables
Unmeasured variables may influence the results.
An observational study linking screen time to examination performance might be affected by sleep, prior achievement, or home environment.
Small Sample Sizes
Small samples often produce imprecise estimates and can be strongly affected by unusual observations.
Short Study Duration
A short investigation may not reveal long-term effects.
For example, a teaching intervention may improve short-term test scores without improving long-term retention.
Missing Data
If participants drop out or fail to provide information, the remaining data may be unrepresentative.
Lack of Replication
A single study may produce an unusual result by chance.
Replication helps determine whether findings are consistent across different samples and settings.
Generalizability
A conclusion may apply only to the population, conditions, and setting studied.
Researchers should avoid extending results beyond the evidence.
Evaluating Evidence Using Effect Size
Statistical significance tells us whether the data provide evidence against a null hypothesis.
Effect size describes the magnitude of an observed difference or relationship.
For two independent groups, a common standardized effect size is Cohen's d.
d = (x̄₂ − x̄₁) / sₚ
Here, sₚ is the pooled standard deviation.
Worked Example
Suppose:
Group A mean = 70
Group B mean = 76
Pooled standard deviation = 12
Then:
d = (76 − 70) / 12
d = 6 / 12
d = 0.5
The observed mean difference is half a pooled standard deviation.
A conventional interpretation is that this represents a medium-sized effect.
However, whether the effect is practically important depends on the situation.
For example, a modest improvement in a medical treatment could be important if it prevents serious complications, while a similar standardized difference in another context might have little practical consequence.
Evaluating Multiple Statistical Studies
When several studies investigate the same question, their findings may differ.
For example:
|
Study |
Sample size |
Estimated improvement |
95% confidence interval |
|---|---|---|---|
|
A |
40 |
+6 marks |
−2 to +14 |
|
B |
200 |
+5 marks |
+2 to +8 |
|
C |
500 |
+4 marks |
+2 to +6 |
All three studies estimate a positive improvement.
However, Study A has a wide confidence interval that includes zero, indicating substantial uncertainty.
Studies B and C provide more precise estimates, assuming the methods and data are reliable.
We should not automatically conclude that Study C is the best study simply because it has the largest sample.
Study quality, participant selection, measurement accuracy, confounding, and statistical methods must also be considered.
Systematic Reviews and Meta-Analyses
A systematic review uses a structured method to identify, evaluate, and summarize relevant studies.
A meta-analysis statistically combines results from multiple studies when appropriate.
These approaches can provide stronger evidence than a single study, but their reliability depends on the quality, comparability, and completeness of the included studies.
Combining several biased studies does not automatically eliminate bias.
Real-World Applications
Health and Medicine
Suppose a newspaper reports:
"People who drink green tea have a lower risk of heart disease."
Before accepting a causal interpretation, we should ask whether the study was observational or experimental, whether other lifestyle factors were considered, and how large and precise the estimated association was.
People who drink green tea may differ from other people in diet, exercise, income, or other characteristics.
Education
A school reports that examination scores increased after introducing a new online learning platform.
However, the increase might also reflect changes in teaching, examination difficulty, student composition, or additional revision time.
A comparison with an appropriate control group would provide stronger evidence about the platform's effect.
Advertising
A company advertises:
"95% of users experienced improvement."
Important questions include how improvement was measured, how many people participated, how participants were selected, and whether the study included a comparison group.
Environmental Science
Researchers report a correlation between air pollution and respiratory illness.
Statistical evidence can help identify an association, but causal interpretation requires careful consideration of other factors, exposure measurement, timing, and the broader body of scientific evidence.
Social Media and Technology
A study reports that students who spend more time on social media have lower average examination scores.
Possible explanations include:
-
Social media use affecting study time.
-
Students struggling academically spending more time online.
-
Other factors influencing both social media use and academic performance.
The association alone cannot establish which explanation is correct.
A Practical Framework for Critically Evaluating Statistical Claims
When reading a statistical study or news article, use the following questions.
Statistical study evaluation checklist
0 of 12 reviewed
A study that performs well on these criteria is generally more trustworthy than one that ignores important methodological weaknesses.
However, no checklist can replace careful consideration of the specific research question and study design.
Common Mistakes
Mistake 1: Assuming correlation proves causation
A relationship between two variables does not automatically mean one causes the other.
Look for confounding variables, reverse causation, and alternative explanations.
Mistake 2: Believing a large sample eliminates all bias
Large samples can reduce random sampling error, but they cannot automatically correct systematic bias.
Mistake 3: Treating a small p-value as proof that a hypothesis is true
A small p-value provides evidence against the null hypothesis under the model assumptions. It does not prove the alternative hypothesis with certainty.
Mistake 4: Ignoring absolute differences when reading percentages
A 100% relative increase may represent a change from 1% to 2%, which is only one percentage point.
Mistake 5: Assuming a statistically significant result must be important
Statistical significance and practical importance are different concepts.
Mistake 6: Ignoring the scale of a graph
A truncated or inconsistent scale can exaggerate or conceal differences.
Mistake 7: Generalizing beyond the population studied
Results from a small or narrowly selected group may not apply to a wider population.
Mistake 8: Accepting conclusions without examining study design
Observational studies, randomized experiments, and surveys support different types of conclusions.
Mistake 9: Ignoring uncertainty
A point estimate without a confidence interval or another measure of uncertainty may give an incomplete picture.
Mistake 10: Selecting only evidence that supports a preferred conclusion
Reliable statistical interpretation considers the relevant evidence as a whole, including contradictory findings and limitations.
Key Terms
-
Statistical investigation: A systematic process of collecting, analysing, and interpreting data to answer a research question.
-
Population: The complete group of individuals or observations of interest.
-
Sample: A subset of a population.
-
Representative sample: A sample that adequately reflects the relevant characteristics of its target population.
-
Bias: A systematic error that distorts a statistical estimate or conclusion.
-
Selection bias: Bias caused by the process used to select participants.
-
Response bias: Systematic distortion in participants' answers.
-
Nonresponse bias: Bias arising when nonrespondents differ from respondents in relevant ways.
-
Confirmation bias: The tendency to favour information supporting existing beliefs.
-
Publication bias: Distortion arising when certain study results are more likely to be published.
-
Correlation: A statistical relationship between variables.
-
Causation: A relationship in which a change in one factor produces a change in another.
-
Correlation coefficient: A numerical measure of the direction and strength of a relationship.
-
Confounding variable: A variable that can distort an observed relationship between an exposure and an outcome.
-
Observational study: A study in which researchers observe variables without assigning the exposure or treatment of interest.
-
Controlled experiment: An investigation in which researchers assign conditions or treatments and compare outcomes.
-
Random assignment: Allocation of participants to experimental groups using a random process.
-
Random sampling: Selection of participants from a population using a random process.
-
Null hypothesis: A statistical claim used as the reference point for a hypothesis test.
-
p-value: The probability, under the null hypothesis and statistical model, of observing a test statistic at least as extreme as the one obtained.
-
Statistical significance: Evidence against a null hypothesis according to a specified statistical test and significance level.
-
Confidence interval: An interval estimate constructed using a procedure with a specified long-run coverage rate.
-
Effect size: A measure of the magnitude of a difference or relationship.
-
Practical significance: The real-world importance of an observed result.
-
Generalizability: The extent to which findings apply beyond the individuals or conditions studied.
-
Replication: Repeating a study to assess whether findings are consistent.
-
Systematic review: A structured synthesis of research evidence.
-
Meta-analysis: A statistical method for combining results from multiple studies.
Key Takeaways
-
Statistical studies must be evaluated critically rather than accepted solely because they contain numerical evidence.
-
Reliable investigations require clear research questions, appropriate samples, accurate measurements, and suitable analytical methods.
-
Bias can arise during participant selection, data collection, analysis, and reporting.
-
Correlation describes an association between variables, while causation requires evidence that one factor influences another.
-
Randomized controlled experiments can provide stronger causal evidence than simple observational comparisons when appropriately designed.
-
Misleading statistical claims may involve selective reporting, confusing percentages, inappropriate graphs, or unsupported causal conclusions.
-
Confidence intervals, effect sizes, p-values, and descriptive statistics provide different but complementary information.
-
Statistical significance does not necessarily imply practical importance.
-
Every study has limitations that should be acknowledged when interpreting findings.
-
Strong statistical conclusions are supported by reliable evidence, appropriate methods, and clear communication of uncertainty.
Check Your Understanding
Question 1: Identifying Bias
A researcher wants to determine whether students enjoy mathematics.
The researcher surveys 100 students attending an optional mathematics enrichment club.
Explain why the results may be biased.
Answer
The sample may suffer from selection bias because students attending a mathematics enrichment club are likely to have a greater interest in mathematics than the general student population.
Therefore, the sample may overestimate how much students enjoy mathematics.
A better approach would be to select a representative sample from the wider student population.
Question 2: Correlation Versus Causation
A study finds that students who spend more time studying tend to achieve higher examination scores.
The correlation coefficient is:
r = 0.82
What does this indicate? Does it prove causation?
Answer
A correlation coefficient of 0.82 indicates a strong positive linear relationship between study time and examination scores.
Students who study more tend to achieve higher scores in the observed data.
However, correlation does not establish causation.
Other factors, such as motivation, previous academic achievement, and access to learning resources, may influence both study time and performance.
A carefully designed experiment could provide stronger evidence about the causal effect of additional study time.
Question 3: Misleading Percentages
A company reports that its product increased customer satisfaction by 50%.
The original satisfaction rate was 40%.
Calculate the new satisfaction rate if the claim refers to a relative increase.
Answer
Increase = 50% of 40%
Increase = 0.50 × 40% = 20 percentage points
New satisfaction rate:
40% + 20% = 60%
The satisfaction rate increased from 40% to 60%.
This is a relative increase of 50%, but an absolute increase of 20 percentage points.
Question 4: Interpreting a p-value
A statistical test produces:
p = 0.008
The significance level is:
α = 0.05
What conclusion should be reached?
Answer
Since:
0.008 < 0.05
We reject the null hypothesis.
The data provide statistically significant evidence against the null hypothesis under the assumptions of the test.
However, the p-value does not establish the size, practical importance, or causal nature of the effect.
Question 5: Evaluating Study Design
A school introduces a new teaching program.
At the end of the year, average examination scores increase from 70 to 78.
The school concludes that the program caused the improvement.
Explain why this conclusion may be unjustified.
Answer
The improvement could be associated with several other factors, including:
-
Changes in student ability.
-
Different examination difficulty.
-
Additional revision opportunities.
-
Changes in teaching staff.
-
Differences in attendance.
Without an appropriate comparison group or stronger experimental design, the school cannot confidently attribute the improvement to the new program.
The evidence establishes that average scores increased, but not necessarily why they increased.
Question 6: Interpreting Confidence Intervals
A study estimates that a new treatment reduces recovery time by an average of 3 days compared with an existing treatment.
The 95% confidence interval for the reduction is:
(−1, 7) days
What does this suggest?
Answer
The estimated mean reduction is 3 days, but the confidence interval includes zero.
It also includes negative values, which would indicate that the new treatment increases recovery time.
Therefore, the results do not establish a statistically significant difference at the 5% level under the corresponding two-sided test.
The evidence is compatible with a range of effects, from a small disadvantage to a substantial benefit.
More precise evidence may be needed.
Question 7: Comparing Statistical Evidence
Two studies investigate the same teaching method.
Study A:
n = 30
Estimated improvement = 5 marks
95% confidence interval = (−4, 14)
Study B:
n = 400
Estimated improvement = 5 marks
95% confidence interval = (3, 7)
Which study provides more precise evidence?
Answer
Study B provides more precise evidence because its confidence interval is narrower.
Study A interval width:
14 − (−4) = 18
Study B interval width:
7 − 3 = 4
Both studies estimate the same improvement, but Study B has substantially less uncertainty.
However, greater precision does not automatically mean lower bias. Study design and sampling quality must still be evaluated.
Question 8: Recognising a Confounding Variable
A study finds that people who own expensive sports equipment tend to exercise more frequently.
The researcher concludes that purchasing expensive equipment causes people to exercise more.
Identify a possible confounding variable.
Answer
One possible confounding variable is income.
People with higher incomes may be more likely to purchase expensive equipment and may also have greater access to fitness facilities or recreational opportunities.
Another possible factor is existing interest in fitness.
People who already exercise frequently may be more willing to purchase expensive equipment.
Therefore, the observed association does not prove that buying expensive equipment causes increased exercise.
Question 9: Evaluating Statistical Significance
A large study finds that a new educational program improves examination scores by an average of 0.4 marks out of 100.
The result is statistically significant, with:
p = 0.001
Should the school automatically adopt the program?
Answer
No.
Although the result is statistically significant, the average improvement is very small.
The school should also consider:
-
The cost of the program.
-
The time required to implement it.
-
The confidence interval around the improvement.
-
Whether the effect is consistent across different students.
-
Whether the study supports a causal conclusion.
-
Whether the improvement has meaningful educational consequences.
Statistical significance alone is insufficient for making an informed decision.
Question 10: Critical Evaluation of a Statistical Claim
A news article states:
"Scientists prove that drinking coffee makes students more intelligent."
The article describes an observational study of 200 university students.
Students who drank coffee regularly achieved an average test score of 78, while students who did not drink coffee achieved an average score of 73.
Identify at least four problems with the headline or conclusion.
Answer
Problem 1: Causation is not established.
The study is observational, so it cannot by itself prove that coffee causes higher intelligence or better performance.
Problem 2: Confounding variables may exist.
Coffee consumption may be associated with study habits, sleep, workload, age, or other factors.
Problem 3: Test scores do not directly measure intelligence.
The study measured examination performance, not necessarily intelligence.
Problem 4: Statistical uncertainty is not reported.
The article does not provide standard deviations, confidence intervals, or hypothesis test results.
Problem 5: Generalizability is uncertain.
The sample consists of 200 university students, and the sampling method is unknown.
Improved conclusion:
"In a study of 200 university students, regular coffee drinkers had an average test score 5 marks higher than non-coffee drinkers. However, the observational design does not establish that coffee consumption caused the difference."
This conclusion accurately describes the observed association without making unsupported causal claims.
Final Reflection
Statistics can reveal valuable information about the world, but numbers alone do not guarantee reliable conclusions.
A strong statistical thinker examines not only what the data show, but also how the data were obtained, what assumptions were made, how uncertainty was handled, and whether alternative explanations are possible.
When interpreting any statistical study, three questions are particularly important:
What does the evidence actually show?
What conclusions are justified by the research design and statistical analysis?
What limitations or uncertainties should be considered before accepting the findings?
Developing these habits allows us to distinguish strong evidence from misleading claims and make better-informed decisions in education, science, health, business, and everyday life.