Applications and Function Analysis
2. Function Features and Behaviour
Learning outcomes
- I can analyze intercepts, extrema, and asymptotes.
- I can identify intervals of increase and decrease.
- I can describe end behaviour.
- I can determine where functions are positive and negative.
- I can interpret graphical features.
Introduction
A mathematical function does much more than produce an output from an input. Its graph tells a story about how two quantities are related, how they change, and what happens as the input increases or decreases.
For example, a graph showing the height of a ball over time can tell us when the ball reaches its maximum height. A graph of business profit can show when a company begins making money. A graph of average production cost can reveal how costs change as production increases.
To understand these relationships, mathematicians study the features and behaviour of functions.
Some of the most important features include:
-
Intercepts: Where the graph meets the coordinate axes.
-
Extrema: Maximum and minimum values.
-
Asymptotes: Lines that a graph approaches in particular limiting situations.
-
Intervals of increase and decrease: Where the output rises or falls as x increases.
-
End behaviour: What happens to the function as x becomes very large or very negative.
-
Positive and negative intervals: Where the graph lies above or below the x-axis.
By combining these ideas, we can interpret graphs, compare functions, solve mathematical problems, and make meaningful predictions.
This lesson develops a systematic approach to analysing polynomial, rational, and other common functions.
Understanding a Function Graph
A function describes a relationship between an input and an output.
We usually write:
y = f(x)
where x is the input and f(x) is the corresponding output.
For example:
f(x) = x² − 4
The function assigns an output to every real input.
|
x |
f(x) |
|---|---|
|
−3 |
5 |
|
−2 |
0 |
|
−1 |
−3 |
|
0 |
−4 |
|
1 |
−3 |
|
2 |
0 |
|
3 |
5 |
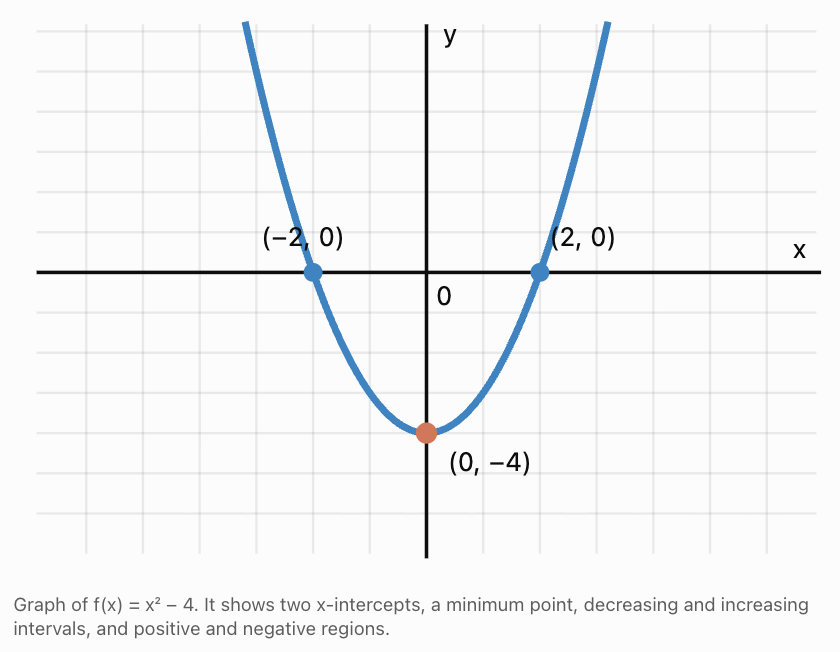
From this graph, we can identify several important features without calculating every possible output.
The graph crosses the x-axis at x = −2 and x = 2. It reaches a minimum at (0, −4). It decreases to the left of the minimum and increases to the right.
These features form the foundation of function analysis.
Intercepts
An intercept is a point where a graph meets one of the coordinate axes.
x-Intercepts
An x-intercept occurs where the output is zero.
Therefore:
f(x) = 0
To find x-intercepts algebraically, solve the equation f(x) = 0.
Worked Example 1: Finding x-Intercepts
Find the x-intercepts of:
f(x) = x² − 5x + 6
Step 1: Set the function equal to zero.
x² − 5x + 6 = 0
Step 2: Factor.
(x − 2)(x − 3) = 0
Step 3: Solve.
x = 2 or x = 3
Answer: x-intercepts (2, 0) and (3, 0).
y-Intercepts
A y-intercept occurs when x = 0.
Therefore, calculate:
f(0)
Worked Example 2: Finding a y-Intercept
For:
f(x) = x² − 5x + 6
Substitute x = 0:
f(0) = 0² − 5(0) + 6
f(0) = 6
Answer: y-intercept (0, 6).
Intercepts of Rational Functions
For a rational function:
f(x) = P(x)/Q(x)
x-intercepts occur where P(x) = 0, provided Q(x) ≠ 0.
The y-intercept is f(0), provided the function is defined at x = 0.
For example:
f(x) = (x − 3)/(x + 2)
x-intercept: (3, 0).
y-intercept: (0, −3/2).
The function is undefined at x = −2.
Interpreting Intercepts
Intercepts often have important practical meanings.
For a height–time graph, an x-intercept may represent the moment an object reaches the ground.
For a profit–production graph, an x-intercept may represent the break-even point.
For a population model, the y-intercept may represent the initial population.
Always interpret intercepts using the units and context of the problem.
Maximum and Minimum Values
An extremum is a maximum or minimum value of a function.
The plural is extrema.
There are two important types.
Local maximum: A point where the function value is greater than or equal to nearby function values.
Local minimum: A point where the function value is less than or equal to nearby function values.
An absolute maximum is the greatest output over the entire domain being considered.
An absolute minimum is the smallest output over that domain.
A local extremum does not necessarily have to be an absolute extremum.
Worked Example 3: Finding the Minimum of a Quadratic Function
Consider:
f(x) = x² − 6x + 5
Since the coefficient of x² is positive, the parabola opens upward.
The minimum occurs at its vertex.
For a quadratic:
f(x) = ax² + bx + c
the vertex x-coordinate is:
x = −b/(2a)
Here:
a = 1, b = −6
Therefore:
x = 6/2 = 3
Substitute:
f(3) = 3² − 6(3) + 5
= 9 − 18 + 5
= −4
Minimum point: (3, −4).
The minimum output is −4.
The function has no absolute maximum because it increases without bound.
Worked Example 4: Finding a Maximum
Consider:
h(t) = −5t² + 30t + 2
This could represent the height of an object above the ground.
The parabola opens downward, so its vertex is a maximum.
t = −30/[2(−5)]
t = 3
Calculate:
h(3) = −5(9) + 30(3) + 2
= −45 + 90 + 2
= 47
Maximum height: 47 m, reached after 3 seconds.
Local Versus Absolute Extrema
A cubic or higher-degree polynomial may have several turning points.
For example:
f(x) = x³ − 3x
has a local maximum at (−1, 2) and a local minimum at (1, −2).
However, the function has no absolute maximum or minimum on the real number line because its outputs extend without bound in both directions.
This distinction is important when interpreting graphs.
Intervals of Increase and Decrease
A function is increasing on an interval when its output becomes larger as x increases.
A function is decreasing on an interval when its output becomes smaller as x increases.
We describe these intervals using x-values, not y-values.
Example: Quadratic Function
Consider:
f(x) = (x − 2)² + 1
The vertex is (2, 1).
The parabola opens upward.
Therefore:
-
The function is decreasing on (−∞, 2).
-
The function is increasing on (2, ∞).
The turning point x = 2 separates the two intervals.
Worked Example 5: Increasing and Decreasing Intervals
Consider:
f(x) = x³ − 3x
This function has a local maximum at x = −1 and a local minimum at x = 1.
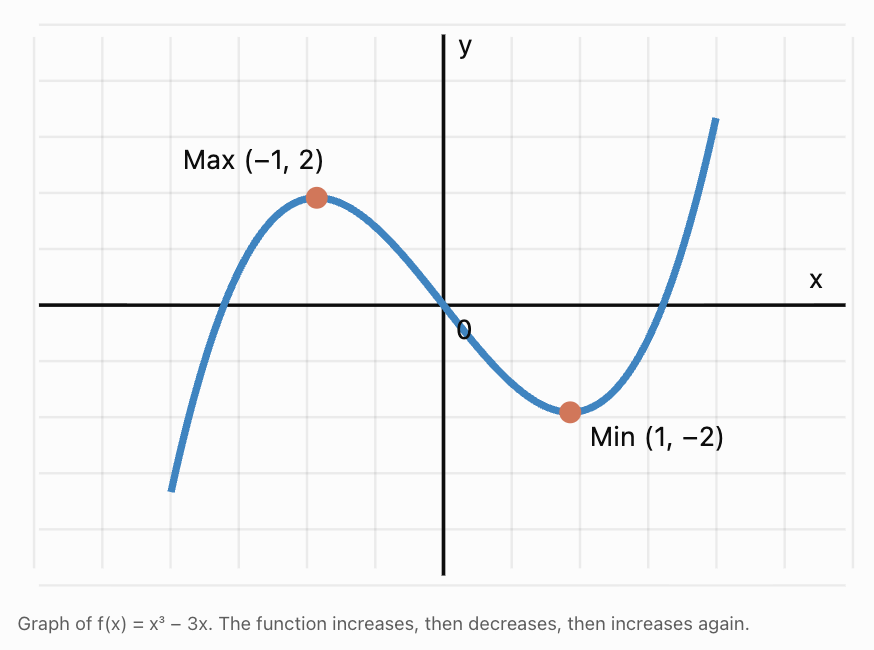
Reading from left to right:
The graph rises until x = −1.
It then falls between x = −1 and x = 1.
After x = 1, it rises again.
Therefore:
|
Interval |
Behaviour |
|---|---|
|
(−∞, −1) |
Increasing |
|
(−1, 1) |
Decreasing |
|
(1, ∞) |
Increasing |
Using a Table to Identify Behaviour
Consider:
f(x) = x² − 4x + 3
|
x |
f(x) |
|---|---|
|
0 |
3 |
|
1 |
0 |
|
2 |
−1 |
|
3 |
0 |
|
4 |
3 |
As x increases from 0 to 2, the outputs decrease.
As x increases from 2 to 4, the outputs increase.
This suggests a minimum at x = 2.
The complete intervals are:
Decreasing: (−∞, 2)
Increasing: (2, ∞)
A table can reveal a pattern, but it does not by itself prove the behaviour across every value in an interval.
Increasing and Decreasing Rational Functions
Consider:
f(x) = 1/x
The function decreases on both:
(−∞, 0) and (0, ∞).
However, it is not decreasing across its entire domain as one interval because x = 0 is excluded and the branches are separated.
Always divide intervals at discontinuities.
End Behaviour
End behaviour describes how a function behaves as x approaches positive infinity or negative infinity.
We are interested in what happens at the far left and far right of a graph.
End Behaviour of Polynomial Functions
The leading term usually determines the end behaviour.
For example:
f(x) = 2x⁴ − 3x² + 1
The leading term is 2x⁴.
Because the degree is even and the leading coefficient is positive, both ends rise.
|
Polynomial type |
As x → −∞ |
As x → +∞ |
|---|---|---|
|
Even degree, positive leading coefficient |
f(x) → +∞ |
f(x) → +∞ |
|
Even degree, negative leading coefficient |
f(x) → −∞ |
f(x) → −∞ |
|
Odd degree, positive leading coefficient |
f(x) → −∞ |
f(x) → +∞ |
|
Odd degree, negative leading coefficient |
f(x) → +∞ |
f(x) → −∞ |
Worked Example 6: Polynomial End Behaviour
Analyze:
f(x) = −3x⁵ + 2x³ − 7
The leading term is −3x⁵.
The degree is odd.
The leading coefficient is negative.
Therefore:
As x → −∞, f(x) → +∞.
As x → +∞, f(x) → −∞.
Interpretation: The graph rises on the left and falls on the right.
End Behaviour of Rational Functions
Rational functions often approach horizontal, oblique, or higher-degree polynomial asymptotes.
Consider:
f(x) = (2x + 1)/(x − 3)
Both numerator and denominator have degree 1.
The horizontal asymptote is the ratio of leading coefficients:
y = 2/1 = 2
Therefore:
As x → −∞, f(x) → 2.
As x → +∞, f(x) → 2.
Worked Example 7: Interpreting an Oblique Asymptote
Consider:
f(x) = (x² + 1)/(x − 2)
Polynomial division gives:
f(x) = x + 2 + 5/(x − 2)
As x becomes very large in magnitude:
5/(x − 2) approaches zero.
Therefore, the graph approaches:
y = x + 2
This is an oblique asymptote.
For large positive x, the graph approaches the line from above.
For large negative x, it approaches the line from below.
Vertical and Horizontal Asymptotes
An asymptote describes a line that a function approaches in a particular limiting situation.
Vertical Asymptotes
Vertical asymptotes occur at certain excluded x-values where function values grow without bound.
Consider:
f(x) = 1/(x − 2)
Vertical asymptote:
x = 2
As x approaches 2 from the left, f(x) approaches negative infinity.
As x approaches 2 from the right, f(x) approaches positive infinity.
Horizontal Asymptotes
Horizontal asymptotes describe behaviour as x approaches positive or negative infinity.
Consider:
f(x) = 3 + 2/x
Horizontal asymptote:
y = 3
As x becomes very large in magnitude, 2/x approaches zero.
Worked Example 8: Identifying Asymptotes
Analyze:
f(x) = (3x + 2)/(x − 4)
Vertical asymptote:
x − 4 = 0
x = 4
Horizontal asymptote:
Both polynomials have degree 1.
Leading coefficient ratio:
3/1 = 3
Therefore:
y = 3
Answer: Vertical asymptote x = 4; horizontal asymptote y = 3.
Positive and Negative Intervals
A function is positive when:
f(x) > 0
Its graph lies above the x-axis.
A function is negative when:
f(x) < 0
Its graph lies below the x-axis.
The points where f(x) = 0 separate positive and negative regions, although the sign does not always change at a zero.
Worked Example 9: Positive and Negative Intervals of a Quadratic
Consider:
f(x) = x² − 5x + 6
Factor:
f(x) = (x − 2)(x − 3)
The zeros are:
x = 2 and x = 3.
These divide the number line into three intervals.
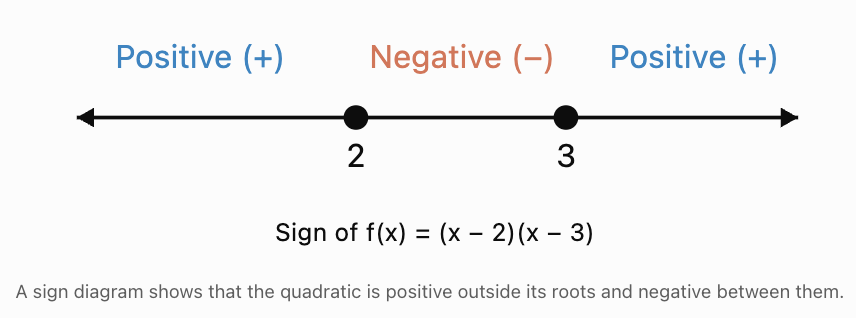
Test each interval.
Interval 1: x less than 2
Choose x = 0.
f(0) = 6
Positive.
Interval 2: 2 less than x less than 3
Choose x = 2.5.
f(2.5) = (0.5)(−0.5) = −0.25
Negative.
Interval 3: x greater than 3
Choose x = 4.
f(4) = (2)(1) = 2
Positive.
Therefore:
Positive on (−∞, 2) ∪ (3, ∞).
Negative on (2, 3).
The function equals zero at x = 2 and x = 3.
Worked Example 10: Sign Analysis of a Rational Function
Consider:
The numerator is zero at x = 1.
The denominator is zero at x = −2.
These values divide the number line into three intervals.
|
Interval |
Test x |
Sign of f(x) |
|---|---|---|
|
x less than −2 |
−3 |
Positive |
|
−2 less than x less than 1 |
0 |
Negative |
|
x greater than 1 |
2 |
Positive |
Therefore:
Positive: (−∞, −2) ∪ (1, ∞).
Negative: (−2, 1).
At x = 1, the function equals zero.
At x = −2, the function is undefined.
Important: A zero and a vertical asymptote can both separate sign intervals, but they have different meanings.
A Complete Method for Analysing Function Behaviour
When presented with an unfamiliar function, use the following process.
-
Identify the function type. Determine whether it is linear, quadratic, polynomial, rational, exponential, or another family.
-
Determine the domain. Identify permitted inputs and any excluded values.
-
Find intercepts. Solve f(x) = 0 and calculate f(0), where defined.
-
Identify extrema. Find maximum and minimum points using algebra, a graph, or calculus where appropriate.
-
Find asymptotes. Check for vertical, horizontal, and oblique asymptotes.
-
Determine intervals of increase and decrease. Identify where the graph rises or falls.
-
Determine positive and negative intervals. Use zeros, discontinuities, and test values.
-
Describe end behaviour. Explain what happens as x approaches positive and negative infinity.
-
Interpret the features. Explain their mathematical or real-world meaning.
Worked Example 11: Complete Analysis of a Quadratic Function
Analyze:
f(x) = −x² + 4x + 5
Step 1: Domain
This is a polynomial function.
Domain: all real numbers.
Step 2: x-Intercepts
Set f(x) = 0:
−x² + 4x + 5 = 0
Multiply by −1:
x² − 4x − 5 = 0
Factor:
(x − 5)(x + 1) = 0
Therefore:
x = 5 or x = −1
x-intercepts: (−1, 0) and (5, 0).
Step 3: y-Intercept
f(0) = 5
y-intercept: (0, 5).
Step 4: Maximum or Minimum
The coefficient of x² is negative, so the parabola opens downward.
Vertex x-coordinate:
x = −4/[2(−1)] = 2
Calculate:
f(2) = −4 + 8 + 5 = 9
Maximum point: (2, 9).
Step 5: Increasing and Decreasing Intervals
Increasing: (−∞, 2).
Decreasing: (2, ∞).
Step 6: Positive and Negative Intervals
The zeros are x = −1 and x = 5.
Because the parabola opens downward:
Positive: (−1, 5).
Negative: (−∞, −1) ∪ (5, ∞).
Step 7: End Behaviour
As x → −∞, f(x) → −∞.
As x → +∞, f(x) → −∞.
Step 8: Range
The maximum output is 9.
Range: (−∞, 9].
Summary
|
Feature |
Result |
|---|---|
|
Domain |
All real numbers |
|
Range |
y ≤ 9 |
|
x-intercepts |
(−1, 0), (5, 0) |
|
y-intercept |
(0, 5) |
|
Maximum |
(2, 9) |
|
Increasing |
(−∞, 2) |
|
Decreasing |
(2, ∞) |
|
Positive |
(−1, 5) |
|
Negative |
x less than −1 or greater than 5 |
|
End behaviour |
Both ends fall |
Worked Example 12: Complete Analysis of a Rational Function
Analyze:
Step 1: Domain
The denominator is zero at x = 2.
Domain: x ≠ 2.
Step 2: Intercepts
x-intercept:
x + 1 = 0
x = −1
Therefore, (−1, 0).
y-intercept:
f(0) = 1/(−2) = −1/2
Therefore, (0, −1/2).
Step 3: Asymptotes
Vertical asymptote:
x = 2
Horizontal asymptote:
Both polynomials have degree 1, with leading coefficient ratio 1.
Therefore:
y = 1
Step 4: Increasing and Decreasing Intervals
Rewrite:
f(x) = 1 + 3/(x − 2)
As x increases on either side of x = 2, the term 3/(x − 2) decreases.
Therefore:
Decreasing: (−∞, 2) and (2, ∞).
There are no increasing intervals.
Step 5: Positive and Negative Intervals
Critical values:
x = −1 and x = 2.
Test the intervals.
For x less than −1, the numerator and denominator are both negative, so f(x) is positive.
For −1 less than x less than 2, the numerator is positive and denominator negative, so f(x) is negative.
For x greater than 2, both are positive, so f(x) is positive.
Therefore:
Positive: (−∞, −1) ∪ (2, ∞).
Negative: (−1, 2).
Step 6: End Behaviour
As x → −∞, f(x) → 1 from below.
As x → +∞, f(x) → 1 from above.
Step 7: Range
Since f(x) = 1 + 3/(x − 2), the function cannot equal 1.
Range: all real numbers except 1.
Summary
|
Feature |
Result |
|---|---|
|
Domain |
x ≠ 2 |
|
Range |
y ≠ 1 |
|
x-intercept |
(−1, 0) |
|
y-intercept |
(0, −1/2) |
|
Vertical asymptote |
x = 2 |
|
Horizontal asymptote |
y = 1 |
|
Increasing |
None |
|
Decreasing |
(−∞, 2), (2, ∞) |
|
Positive |
x less than −1 or greater than 2 |
|
Negative |
−1 less than x less than 2 |
Real-World Applications
Application 1: Maximum Height of a Projectile
A ball is launched upward from a height of 2 metres.
Its height is modelled by:
h(t) = −5t² + 20t + 2
where t is time in seconds.
Maximum height:
t = −20/[2(−5)] = 2 seconds
h(2) = −5(4) + 20(2) + 2
= 22 m
The maximum occurs at (2, 22).
The ball rises for the first 2 seconds and falls after 2 seconds.
The model is physically meaningful only until the ball reaches the ground.
Solving h(t) = 0 gives:
t = 2 + √110/5 ≈ 4.10 seconds.
Therefore:
Increasing during 0 < t < 2.
Decreasing during 2 < t < 4.10.
The function's maximum represents the highest point of the ball's flight.
Application 2: Business Profit
A company's profit is modelled by:
P(x) = −2x² + 80x − 600
where x is the number of units produced and P(x) is measured in dollars.
Find the break-even points.
Set P(x) = 0:
−2x² + 80x − 600 = 0
Divide by −2:
x² − 40x + 300 = 0
Factor:
(x − 10)(x − 30) = 0
Therefore:
x = 10 or x = 30.
The company breaks even at 10 and 30 units.
Find maximum profit.
Vertex x-coordinate:
x = −80/[2(−2)] = 20
P(20) = −2(400) + 80(20) − 600
= −800 + 1600 − 600
= 200
Maximum profit = $200 at 20 units.
Interpret the signs.
Profit is positive for 10 < x < 30.
Profit is negative for x < 10 or x > 30.
For a real production model, only nonnegative whole-number values of x are meaningful.
Application 3: Average Cost
Suppose:
A(x) = 600/x + 15
where A(x) is average cost per item and x is the number of items.
The function is decreasing for x > 0.
As x becomes very large, A(x) approaches 15.
The horizontal asymptote is:
y = 15.
This means average cost approaches $15 per item as production increases.
The mathematical model has a vertical asymptote at x = 0, but the practical domain consists of positive whole-number production quantities.
Application 4: Interpreting a Population Graph
Suppose a population is modelled by:
P(t) = 500 + 200t − 10t²
where t represents years after the start of a study.
The graph initially increases because the linear growth term dominates.
Eventually, the negative quadratic term causes the model to reach a maximum and then decrease.
The maximum occurs at:
t = −200/[2(−10)] = 10
P(10) = 500 + 2000 − 1000
= 1500
The model predicts a maximum population of 1,500 after 10 years.
However, this quadratic model cannot remain realistic indefinitely because it eventually predicts negative population values.
This demonstrates why mathematical features must be interpreted alongside the assumptions and limitations of a model.
Common Mistakes
Mistake 1: Confusing x-Intercepts and y-Intercepts
x-intercepts occur where y = 0.
y-intercepts occur where x = 0.
For example, f(x) = x² − 4 has x-intercepts at (−2, 0) and (2, 0), and a y-intercept at (0, −4).
Mistake 2: Confusing Maximum Values with Maximum Points
For f(x) = −(x − 3)² + 7:
Maximum point: (3, 7).
Maximum value: 7.
The point includes both coordinates, while the value refers only to the output.
Mistake 3: Writing Increasing Intervals Using y-Values
Increasing and decreasing intervals are described using x-values.
For f(x) = (x − 2)²:
Increasing interval: (2, ∞), not (0, ∞).
Mistake 4: Including a Discontinuity in an Interval
For f(x) = 1/x, the function is decreasing on (−∞, 0) and (0, ∞).
It is not appropriate to combine these into one decreasing interval across x = 0.
Mistake 5: Assuming a Horizontal Asymptote Cannot Be Crossed
A graph may cross a horizontal asymptote.
Horizontal asymptotes describe end behaviour rather than forbidden values.
Mistake 6: Confusing Positive Functions with Increasing Functions
A function can be positive while decreasing.
For example, f(x) = 1/x is positive and decreasing for x > 0.
Positive describes the sign of the output.
Increasing describes how the output changes as x increases.
Mistake 7: Forgetting to Test Intervals
Knowing where a function equals zero does not automatically tell us where it is positive or negative.
Use a sign diagram or test values.
Mistake 8: Ignoring Context
A polynomial may be defined for all real numbers mathematically, but a physical model may only be meaningful over a restricted interval.
Always interpret the graph using the situation being modelled.
Key Terms
-
Function: A relationship assigning exactly one output to each input in its domain.
-
Domain: The set of permitted input values.
-
Range: The set of possible output values.
-
x-Intercept: A point where the graph meets the x-axis.
-
y-Intercept: A point where the graph meets the y-axis.
-
Zero or Root: An input value for which f(x) = 0.
-
Extremum: A maximum or minimum value.
-
Local Maximum: A function value greater than or equal to nearby values.
-
Local Minimum: A function value less than or equal to nearby values.
-
Absolute Maximum: The greatest function value over the domain being considered.
-
Absolute Minimum: The smallest function value over the domain being considered.
-
Turning Point: A point where a function changes from increasing to decreasing or vice versa.
-
Increasing Interval: An interval where outputs increase as inputs increase.
-
Decreasing Interval: An interval where outputs decrease as inputs increase.
-
End Behaviour: The behaviour of a function as x approaches positive or negative infinity.
-
Vertical Asymptote: A vertical line approached by a graph as function values grow without bound.
-
Horizontal Asymptote: A horizontal line approached by a graph as x becomes very large in magnitude.
-
Oblique Asymptote: A nonhorizontal straight line approached by a graph at infinity.
-
Positive Interval: An interval where f(x) > 0.
-
Negative Interval: An interval where f(x) < 0.
-
Sign Diagram: A representation showing where a function is positive, negative, zero, or undefined.
-
Critical Value: An input at which a derivative is zero or undefined, when the function itself is defined; such values are candidates for extrema.
-
Mathematical Model: A function or equation representing a real-world relationship.
Key Takeaways
-
Intercepts identify where a graph meets the coordinate axes.
-
Extrema identify maximum and minimum values.
-
Local extrema describe nearby behaviour, while absolute extrema describe the entire domain being considered.
-
Increasing intervals show where outputs rise as x increases.
-
Decreasing intervals show where outputs fall as x increases.
-
End behaviour describes what happens as x approaches positive or negative infinity.
-
Vertical asymptotes describe unbounded behaviour near certain excluded inputs.
-
Horizontal and oblique asymptotes describe long-term graph behaviour.
-
A function is positive above the x-axis and negative below it.
-
Zeros and discontinuities help divide a graph into sign intervals.
-
Positive and increasing are different mathematical properties.
-
Graph features can represent important events such as maximum height, break-even points, and changing costs.
-
A complete function analysis combines algebraic calculations, graphical interpretation, and contextual reasoning.
Check Your Understanding
Question 1: Intercepts
Find the x- and y-intercepts of:
f(x) = x² − 7x + 10
Question 2: Extrema
Find the vertex and determine whether it is a maximum or minimum:
f(x) = −2x² + 8x + 3
Question 3: Increasing and Decreasing Intervals
For:
f(x) = (x + 3)² − 2
Determine the intervals where the function is increasing and decreasing.
Question 4: End Behaviour
Describe the end behaviour of:
f(x) = −4x⁶ + 3x³ − 2
Question 5: Asymptotes
Find the vertical and horizontal asymptotes of:
f(x) = (2x + 5)/(x − 3)
Question 6: Positive and Negative Intervals
Determine where the following function is positive and negative:
f(x) = (x − 1)(x − 4)
Question 7: Rational Function Sign Analysis
Determine where:
f(x) = (x + 2)/(x − 3)
is positive, negative, zero, and undefined.
Question 8: Complete Function Analysis
Analyze:
f(x) = −x² + 6x − 5
Find:
a) Domain and range.
b) x- and y-intercepts.
c) Maximum or minimum point.
d) Increasing and decreasing intervals.
e) Positive and negative intervals.
f) End behaviour.
Question 9: Real-World Application
A ball's height is given by:
h(t) = −5t² + 25t + 1
where t is measured in seconds and h is measured in metres.
a) Find the initial height.
b) Determine when the ball reaches maximum height.
c) Calculate the maximum height.
d) Find approximately when the ball reaches the ground.
e) Explain the meaning of the increasing and decreasing intervals.
Question 10: Challenge
Analyze:
f(x) = (x − 2)/(x + 1)
Find:
a) Domain.
b) Range.
c) x- and y-intercepts.
d) Vertical and horizontal asymptotes.
e) Increasing or decreasing intervals.
f) Positive and negative intervals.
g) End behaviour.
Fully Worked Answers
Answer 1: Intercepts
Given:
f(x) = x² − 7x + 10
x-intercepts:
Set f(x) = 0:
x² − 7x + 10 = 0
Factor:
(x − 2)(x − 5) = 0
Therefore:
x = 2 or x = 5
x-intercepts: (2, 0) and (5, 0).
y-intercept:
f(0) = 10
y-intercept: (0, 10).
Answer 2: Extrema
Given:
f(x) = −2x² + 8x + 3
The coefficient of x² is negative, so the parabola opens downward.
Vertex x-coordinate:
x = −8/[2(−2)] = 2
Substitute:
f(2) = −2(4) + 8(2) + 3
= −8 + 16 + 3
= 11
Answer: Maximum point (2, 11).
Answer 3: Increasing and Decreasing
Given:
f(x) = (x + 3)² − 2
The vertex is (−3, −2).
The parabola opens upward.
Therefore:
Decreasing: (−∞, −3).
Increasing: (−3, ∞).
Answer 4: End Behaviour
Given:
f(x) = −4x⁶ + 3x³ − 2
The leading term is −4x⁶.
The degree is even and the leading coefficient is negative.
Therefore:
As x → −∞, f(x) → −∞.
As x → +∞, f(x) → −∞.
Answer: Both ends of the graph fall.
Answer 5: Asymptotes
Given:
f(x) = (2x + 5)/(x − 3)
Vertical asymptote:
x − 3 = 0
x = 3
Horizontal asymptote:
Both polynomials have degree 1.
Leading coefficient ratio:
2/1 = 2
Therefore:
y = 2.
Answer: x = 3 and y = 2.
Answer 6: Positive and Negative Intervals
Given:
f(x) = (x − 1)(x − 4)
Zeros:
x = 1 and x = 4.
Test intervals.
For x less than 1, both factors are negative, so their product is positive.
For 1 less than x less than 4, the first factor is positive and the second negative, so the product is negative.
For x greater than 4, both factors are positive, so their product is positive.
Positive: (−∞, 1) ∪ (4, ∞).
Negative: (1, 4).
The function equals zero at x = 1 and x = 4.
Answer 7: Rational Function Sign Analysis
Given:
f(x) = (x + 2)/(x − 3)
Numerator zero:
x + 2 = 0
x = −2
Denominator zero:
x − 3 = 0
x = 3
Critical boundaries for sign analysis:
−2 and 3.
For x less than −2, both numerator and denominator are negative, so f(x) is positive.
For −2 less than x less than 3, the numerator is positive and denominator negative, so f(x) is negative.
For x greater than 3, both are positive, so f(x) is positive.
Positive: (−∞, −2) ∪ (3, ∞).
Negative: (−2, 3).
Zero: x = −2.
Undefined: x = 3.
Answer 8: Complete Function Analysis
Given:
f(x) = −x² + 6x − 5
a) Domain and range
The domain is all real numbers.
Find the vertex:
x = −6/[2(−1)] = 3
f(3) = −9 + 18 − 5 = 4
The maximum output is 4.
Range: (−∞, 4].
b) Intercepts
Set f(x) = 0:
−x² + 6x − 5 = 0
Multiply by −1:
x² − 6x + 5 = 0
Factor:
(x − 1)(x − 5) = 0
x-intercepts: (1, 0) and (5, 0).
y-intercept:
f(0) = −5
Therefore, (0, −5).
c) Maximum or minimum
Maximum point: (3, 4).
d) Increasing and decreasing
Increasing: (−∞, 3).
Decreasing: (3, ∞).
e) Positive and negative
The parabola opens downward and has roots at 1 and 5.
Positive: (1, 5).
Negative: (−∞, 1) ∪ (5, ∞).
f) End behaviour
As x → −∞, f(x) → −∞.
As x → +∞, f(x) → −∞.
Answer 9: Projectile Motion
Given:
h(t) = −5t² + 25t + 1
a) Initial height
h(0) = 1
Initial height = 1 m.
b) Time of maximum height
t = −25/[2(−5)]
t = 2.5 seconds.
c) Maximum height
h(2.5) = −5(2.5²) + 25(2.5) + 1
= −31.25 + 62.5 + 1
= 32.25 m.
d) Time when the ball reaches the ground
Set h(t) = 0:
−5t² + 25t + 1 = 0
Multiply by −1:
5t² − 25t − 1 = 0
Using the quadratic formula:
The positive root is approximately:
t ≈ 5.04 seconds.
The negative root is not meaningful for time after launch.
e) Increasing and decreasing intervals
The ball rises from t = 0 to t = 2.5 seconds.
It falls from t = 2.5 seconds until it reaches the ground at approximately 5.04 seconds.
Therefore:
Increasing: (0, 2.5).
Decreasing: (2.5, 5.04), approximately.
Answer 10: Challenge
Given:
f(x) = (x − 2)/(x + 1)
a) Domain
The denominator is zero at x = −1.
Domain: x ≠ −1.
b) Range
Rewrite:
f(x) = 1 − 3/(x + 1)
The function cannot equal 1 because −3/(x + 1) cannot equal zero.
Range: y ≠ 1.
c) Intercepts
x-intercept:
x − 2 = 0
x = 2
Therefore, (2, 0).
y-intercept:
f(0) = −2
Therefore, (0, −2).
d) Asymptotes
Vertical asymptote: x = −1.
Horizontal asymptote: y = 1.
e) Increasing and decreasing intervals
Rewrite:
f(x) = 1 − 3/(x + 1)
As x increases on either side of x = −1, the function increases.
Increasing:
(−∞, −1) and (−1, ∞).
There are no decreasing intervals.
f) Positive and negative intervals
Critical boundaries:
x = −1 and x = 2.
For x less than −1, numerator and denominator are negative, so the function is positive.
For −1 less than x less than 2, the numerator is negative and denominator positive, so the function is negative.
For x greater than 2, both are positive, so the function is positive.
Positive:
(−∞, −1) ∪ (2, ∞).
Negative:
(−1, 2).
g) End behaviour
As x → −∞, f(x) approaches 1 from above.
As x → +∞, f(x) approaches 1 from below.
Near the vertical asymptote:
As x approaches −1 from the left, f(x) approaches positive infinity.
As x approaches −1 from the right, f(x) approaches negative infinity.
This completes Function Features and Behaviour, covering all five learning targets with graphical illustrations, algebraic analysis, real-world applications, common mistakes, key terms, key takeaways, and fully worked practice questions.